. 2020 Feb 6;21(3):1089.
doi: 10.3390/ijms21031089.

The Three-Dimensional Ultrastructure of the Human Alveolar Epithelium Revealed by Focused Ion Beam Electron Microscopy

Affiliations

The Three-Dimensional Ultrastructure of the Human Alveolar Epithelium Revealed by Focused Ion Beam Electron Microscopy

Jan Philipp Schneider et al. Int J Mol Sci. .

Abstract

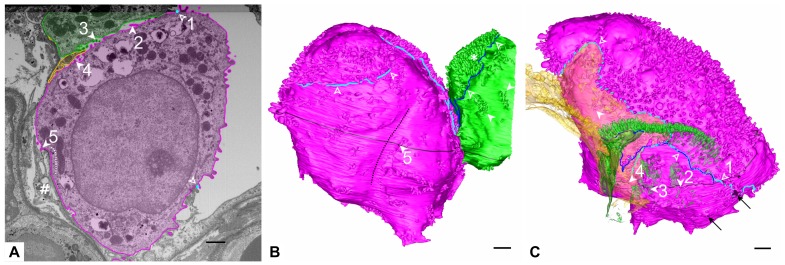
Thin type 1 alveolar epithelial (AE1) and surfactant producing type 2 alveolar epithelial (AE2) cells line the alveoli in the lung and are essential for normal lung function. Function is intimately interrelated to structure, so that detailed knowledge of the epithelial ultrastructure can significantly enhance our understanding of its function. The basolateral surface of the cells or the epithelial contact sites are of special interest, because they play an important role in intercellular communication or stabilizing the epithelium. The latter is in particular important for the lung with its variable volume. The aim of the present study was to investigate the three-dimensional (3D) ultrastructure of the human alveolar epithelium focusing on contact sites and the basolateral cell membrane of AE2 cells using focused ion beam electron microscopy and subsequent 3D reconstructions. The study provides detailed surface reconstructions of two AE1 cell domains and two AE2 cells, showing AE1/AE1, AE1/AE2 and AE2/AE2 contact sites, basolateral microvilli pits at AE2 cells and small AE1 processes beneath AE2 cells. Furthermore, we show reconstructions of a surfactant secretion pore, enlargements of the apical AE1 cell surface and long folds bordering grooves on the basal AE1 cell surface. The functional implications of our findings are discussed. These findings may lay the structural basis for further molecular investigations.

Keywords: 3D reconstruction; alveolus; focused ion beam scanning electron microscopy; lung; type 1 alveolar epithelial cell; type 2 alveolar epithelial cell.


Conflict of interest statement

The authors declare no conflict of interest. The funders had no role in the design of the study; in the collection, analyses, or interpretation of data; in the writing of the manuscript, nor in the decision to publish the results.

Figures

Figure 1
Figure 1
Overview of the 3D model. The figure shows an overview of the 3D model from an alveolar viewing direction. The model includes an almost complete type 2 alveolar epithelial (AE2) cell (pink) and parts of another AE2 cell (green) as well as two type 1 alveolar epithelial (AE1) cell domains (blue and yellow), which are labeled as AE2 and AE1, respectively. The filled arrowhead indicates a deep recess between the pink and green AE2 cells as well as the yellow AE1 cell. The AE2 cells show abundant microvilli on their surfaces but also plain parts (empty arrowhead on the pink AE2 cell, for example). The luminal AE1 cell surface may also be plain at a certain spot (asterisk) or enlarged somewhere else (hash key). Scale bar: 1 μm.
Figure 2
Figure 2
Luminal AE2 cell surface and surfactant secretion pore. (A) Detail from image 884 which shows an open surfactant secretion pore (arrowhead) and remnants of a lamellar body inside (asterisk). In this image the opening is much smaller than the profile diameter of the vesicle under secretion. (B) 3D model of the AE2 cell with the secretion pore (arrowhead) and the remnants of the lamellar body inside (yellow, asterisk). Note the plain cell surface in this area. (C) Same image content as in B but with a transparent cell body, which reveals the entire remnant of the lamellar body and indicates the size of the secretory vesicle (circumference marked by arrowheads), the projection of which is much larger than the secretion pore. Scale bars: 1 μm. The black lines in B and C indicate the position of the section plane of A.
Figure 3
Figure 3
Basolateral surface of AE2 cells. (A) Segmented electron micrograph (image 988 of the data set). The micrograph shows the segmentations of the pink and green AE2 cell as well as of the yellow AE1 cell domain with opaque outlines and transparent filling. Microvilli can be found at different sites of the AE2 cell, three of them are indicated on the micrograph: towards the adjacent green AE2 cell, which also shows microvilli at this site (filled arrowheads 2 and 3), towards the yellow AE1 cell domain (filled arrowhead 4), towards an interstitial cell (hash key) through a hole in the basal lamina (filled arrowhead 5). Turquoise circles indicate the lateral luminal cell border of the pink AE2 cell (empty arrowheads). The position at empty arrowhead 1 is found in the 3D model in C. The dotted line indicates the profile of the groove depicted in B. (B) 3D Model of the pink and green AE2 cells. The position of the segmented electron microscopic (EM) plane in A is indicated in black and the lateral luminal cell borders of the pink and green AE2 cells are indicated by turquoise and blue delineations, respectively (empty arrowheads; note that the positions do not correspond to the empty arrowheads in A). The pink AE2 cell has only one luminal surface. Note the abrupt appearance of a dense microvilli lawn on the luminal surface in some areas (asterisk). Filled arrowhead 5 indicates the region of the corresponding arrowhead 5 in A. Note also the surrounding basolateral microvilli, which may appear in larger groups. Two sites of basolateral groups of microvilli on the green cell are indicated (unnumbered filled arrowheads). Note the long and mostly smooth groove of the pink AE2 cell surface (dotted line). (C) Opaque 3D model of the pink AE2 cell and transparent models of the green AE2 cell and the yellow AE1 cell domain. The position of the segmented EM plane in A is indicated in black. The transparency of the yellow AE1 cell domain and the green AE2 cell enable visualization of intercellular microvilli. Numbered arrowheads correspond to the arrowheads in A: Filled arrowhead 2 and 3: Microvilli between the pink and green AE2 cells. Filled arrowhead 4: AE2 microvilli towards the yellow AE1 cell domain. The unnumbered filled arrowhead indicates another region with AE2 microvilli under the yellow AE1 cell domain. The lateral luminal AE2 cell borders are indicated by turquoise and blue delineations (cf. B). Empty arrowhead 1 refers to the corresponding empty arrowhead in A. Black arrows indicate the small parts of the cell where the cell extends beyond the available dataset. Scale bars: 1 μm.
Figure 4
Figure 4
Luminal surface of AE1 cells. (A–C) Images 1172, 1348 and 1520 of the dataset. Filled arrowheads 1 and 2 (A) indicate profiles of microvilli. Filled arrowheads 3 and 4 (B) indicate microvilli with a shared basis. Empty arrowheads 5 and 6 (A) and 7–10 (C) indicate profiles of plasma membrane protrusions filled with cytoplasm. The hash key indicates a region with smooth AE1 luminal surface. (D) Detail of the 3D model. Arrowheads and hash key refer to the particular profiles in A–C. The particular section planes 1172, 1348 and 1520 are labeled and emphasized by black color in the model. The different thickness of these black markings is caused by different segmentation intervals in these regions. Note the smooth surface of the cell in the center of the image and the surface enlargements around. Some of them seem to be concentrated in a surface cavity (asterisk). Scale bars: 1 μm.
Figure 5
Figure 5
Basolateral surface of AE1 cells. (A) Detail of the segmented EM plane 1384 including parts of the yellow AE1 cell domain. At the basal side small folds may appear which create a groove-like profile with the concavity pointing towards the interstitial space. The groove beyond the epithelium is filled with extracellular matrix (arrowhead 1). (B) A similar situation is found at the basal side of the blue AE1 cell domain, but here the groove is filled with capillary endothelium (arrowhead 2). Note the densely packed caveolae, which appear to be predominantly located in the basal compartment of the cell (asterisk). (C) View on the basal side of the 3D model. The model reveals that indeed the AE1 cell domains form grooves on their basal side which are bordered by cellular folds. The groove in the AE2 cell surface, which has been already described in Figure 3, is also indicated by a dotted line. The EM plane 1384 is indicated by black color. Scale bars: 1 μm.
Figure 6
Figure 6
AE1/AE1 contact. (AD) show the x-plane reconstructions 1603, 1987, 2179 and 2251 of the data set (lateral view on the dataset) on the left side of the panel and a clipped model of the yellow and blue AE1 cell domains on the right side of the panel. The transect plane in the foreground corresponds to the EM plane on the left side. The site of cell contact is indicated by arrowheads. The distance between the different transect planes is indicated in micrometers between the models. Note how the yellow AE1 cell domain slips under the blue cell domain in A and C while the cell domains in B and D meet each other just edge to edge. Note also the bulging of the cell domains into the alveolar lumen at the contact site (asterisks on the EM images). Scale bars: 1 μm.
Figure 7
Figure 7
AE1/AE1 contact. (A,B) show the yellow and blue AE1 cell domain with their alveolar surfaces. On each image one of both cell domains is shown transparently (A: yellow, B: blue) to visualize overlap. Images (C,D) follow the same principle but show the basolateral surfaces. Scale bars: 1 μm.
Figure 8
Figure 8
AE1/AE1 contact. The image shows the contact of parts of the yellow and blue AE1 cell domains. The blue cell domain in the foreground is displayed transparently to enable visualization of the yellow AE1 cell domain. Note how the yellow AE1 cell domain slips beneath the blue cell domain. Scale bar: 1 μm.
Figure 9
Figure 9
AE1/AE1 contact. (A,B) again show the yellow and blue AE1 cell domain from a luminal (A) and a basolateral (B) perspective but without transparency. Note the irregular contact site on the abluminal side compared to the luminal side caused by interdigitating cell processes. Compare in particular the region emphasized by the ellipse. Scale bars: 1 μm.
Figure 10
Figure 10
AE1/AE2 contact. (A) 3D model of the two AE1 cell domains and AE2 cells. AE2 cell models are transparent to enable visualization of the yellow AE1 cell domain behind the AE2 cells. AE1 cells may branch at the edge of an AE2 cell and extend their branches beneath and over the AE2 cell to form a bowl-like structure that enwraps the AE2 cell partially. The yellow AE1 cell domain forms a bowl at the edge of the pink AE2 cell (behind the transparent AE2 cell model). Note also the y-shaped branching of the blue AE1 cell domain and its extension beneath the pink AE2 cell (arrow). The black line indicates the position of the transect image in B. (B) Reconstruction of the y-plane (lateral view on the dataset) at the position indicated by the black line in A. The profiles of the yellow AE1 cell domain and the pink AE2 cell are indicated by yellow and pink outlines. Note the y-shaped profile of the yellow AE1 cell domain. The surface of the yellow AE1 cell domain (“inner surface” of the bowl) looked at in A and C is indicated by arrowheads. (C) 3D model of the yellow and blue AE1 cell domain transected by the y-plane shown in B. The different angle of view compared to A facilitates the imagination of a bowl formed by the yellow AE1 cell domain. The arrowhead indicates where the image plane transects the bowl of the yellow AE1 cell domain. Scale bars: 1 μm.
Figure 11
Figure 11
AE1/AE2 contact. (A) Detail of segmented image 1208. The image shows the segmentation of the pink and green AE2 cells as well as of the yellow and blue AE1 cell domain. Note the very small profiles of the yellow AE1 cell domain (arrowheads 1–5) and the small profile of the blue AE1 cell domain (arrowhead 6). These will probably be overseen if only single images are investigated. If they are recognized, it will almost be impossible to assign them to different cells (compare B). Only the sequence of images reveals their belonging. (B) The same EM image as in A but without segmentations. (C) 3D Modell of the yellow and blue AE1 cell domain as well as the pink and green AE2 cell with a view on the basolateral cell surfaces. The 3D model reveals that the labeled profiles in A belong to small and thin AE1 processes that crawl along the surface of the pink AE2 cell. The numbered arrowheads correspond to the arrowheads in A. Note also the processes of the yellow cell domain along the green AE2 cell. Some of the processes are found in close proximity to AE2 cell microvilli (asterisks). Scale bars: 1 μm.
Figure 12
Figure 12
AE2/AE2 contact. (A) EM image 1112. The image shows the green (top) and pink (bottom) AE2 cell contacting each other. Both cells show niches with microvilli on their basolateral surface facing each other (filled arrowheads). Between both cells also parts of the yellow AE1 cell domain are found (asterisk). The alveolar lumen is indicated by the hash key and the basal lamina by an empty arrowhead. (B) 3D model of the pink and green AE2 cell as well as the yellow and blue AE1 cell domains. The image plane of A is indicated in black. Arrowheads correspond to the arrowheads in A. The borders of the luminal/abluminal surface of the AE2 cells are indicated by turquoise (pink cell) and blue lines (green cell) (cf. Figure 3). The pink AE2 cell and its luminal/abluminal border are displayed transparently to visualize the green AE2 cell and yellow AE1 cell domain behind as well as the luminal/abluminal border of the green AE2 cell. Note the well defined niches with microvilli on the basolateral surface of the green AE2 cell (black arrowheads). Scale bars: 1 μm.

Similar articles

Cited by

References

    1. Ochs M., Weibel E.R. Functional design of the human lung for gas exchange. In: Fishman A.P., Elias J.A., Fishman J.A., Grippi M.A., Senior R.M., Pack A.I., editors. Fishman’s Pulmonary Diseases and Disorders. 4th ed. Volume 1. McGraw-Hill Medical; New York, NY, USA: 2008. pp. 23–69. Chapter 2.
    1. Guillot L., Nathan N., Tabary O., Thouvenin G., Le Rouzic P., Corvol H., Amselem S., Clemen A. Alveolar epithelial cells: Master regulators of lung homeostasis. Int. J. Biochem. Cell Biol. 2013;45:2568–2573. doi: 10.1016/j.biocel.2013.08.009. - DOI - PubMed
    1. Weibel E.R. On the tricks alveolar epithelial cells play to make a good lung. Am. J. Respir. Crit. Care Med. 2015;191:504–513. doi: 10.1164/rccm.201409-1663OE. - DOI - PubMed
    1. Weibel E.R. The mystery of “non-nucleated plates” in the alveolar epithelium of the lung explained. Acta Anat. (Basel) 1971;78:425–443. doi: 10.1159/000143605. - DOI - PubMed
    1. Sirianni F.E., Chu F.S.F., Walker D.C. Human alveolar wall fibroblasts directly link epithelial type 2 cells to capillary endothelium. Am. J. Respir. Crit. Care Med. 2003;168:1532–1537. doi: 10.1164/rccm.200303-371OC. - DOI - PubMed

MeSH terms

LinkOut - more resources