

Transcriptomic Profiling of Tumor-Infiltrating CD4+TIM-3+ T Cells Reveals Their Suppressive, Exhausted, and Metastatic Characteristics in Colorectal Cancer Patients
- PMID: 32041340
- PMCID: PMC7157206
- DOI: 10.3390/vaccines8010071
Transcriptomic Profiling of Tumor-Infiltrating CD4+TIM-3+ T Cells Reveals Their Suppressive, Exhausted, and Metastatic Characteristics in Colorectal Cancer Patients
Abstract
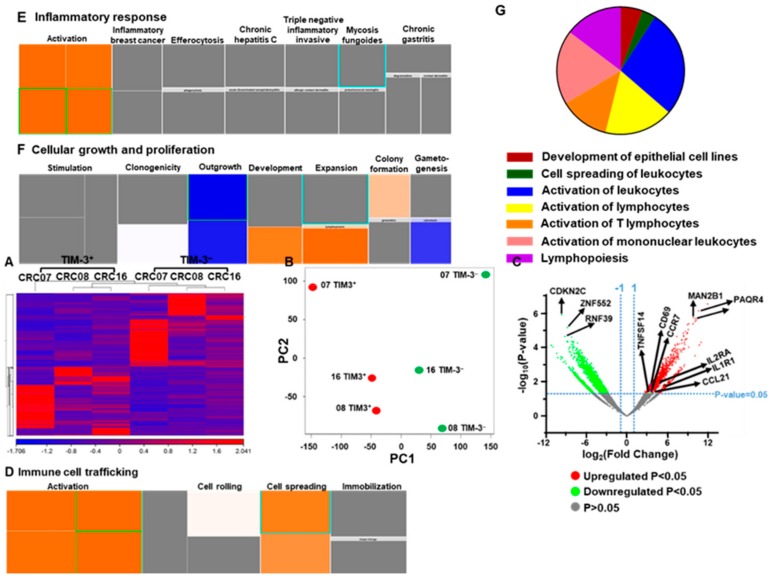
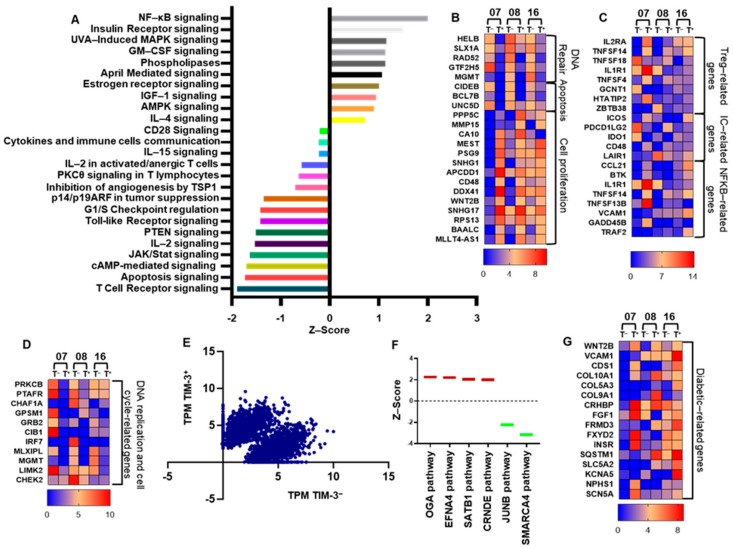
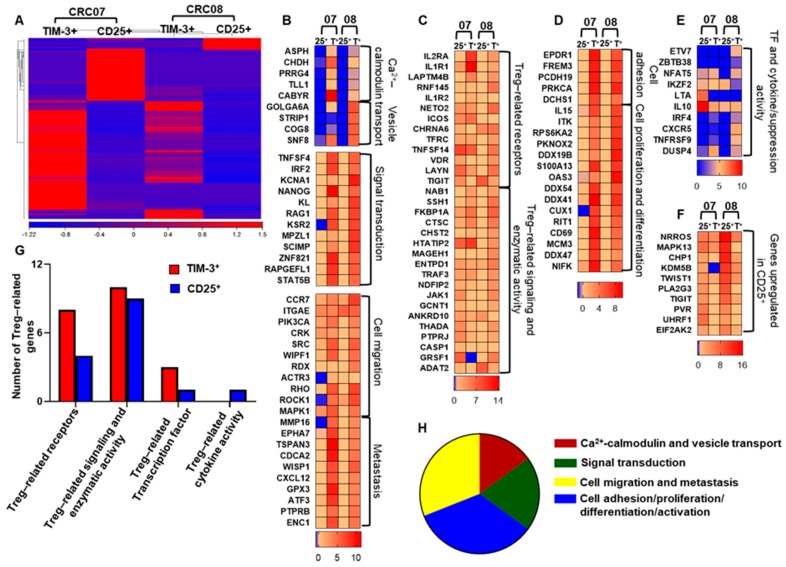
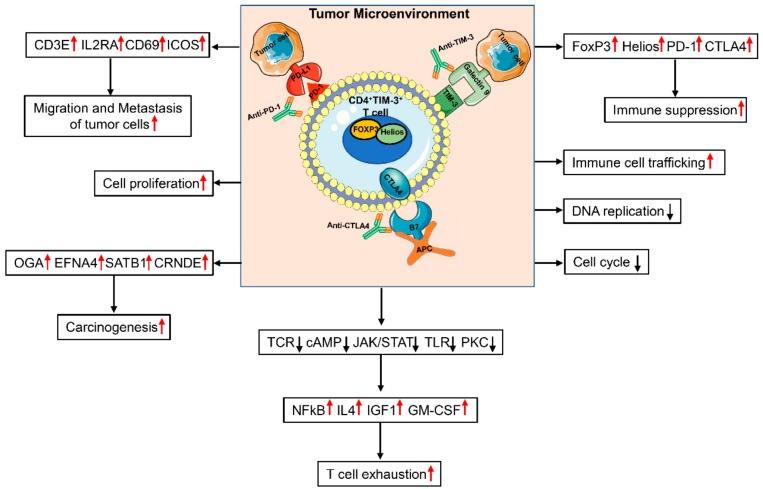
T cell immunoglobulin mucin-3 (TIM-3) is an immune checkpoint identified as one of the key players in regulating T-cell responses. Studies have shown that TIM-3 is upregulated in the tumor microenvironment (TME). However, the precise role of TIM-3 in colorectal cancer (CRC) TME is yet to be elucidated. We performed phenotypic and molecular characterization of TIM-3+ T cells in the TME and circulation of CRC patients by analyzing tumor tissues (TT, TILs), normal tissues (NT, NILs), and peripheral blood mononuclear cells (PBMC). TIM-3 was upregulated on both CD4+ and CD3+CD4- (CD8+) TILs. CD4+TIM-3+ TILs expressed higher levels of T regulatory cell (Tregs)-signature genes, including FoxP3 and Helios, compared with their TIM-3- counterparts. Transcriptomic and ingenuity pathway analyses showed that TIM-3 potentially activates inflammatory and tumor metastatic pathways. Moreover, NF-κB-mediated transcription factors were upregulated in CD4+TIM-3+ TILs, which could favor proliferation/invasion and induce inflammatory and T-cell exhaustion pathways. In addition, we found that CD4+TIM-3+ TILs potentially support tumor invasion and metastasis, compared with conventional CD4+CD25+ Tregs in the CRC TME. However, functional studies are warranted to support these findings. In conclusion, this study discloses some of the functional pathways of TIM-3+ TILs, which could improve their targeting in more specific therapeutic approaches in CRC patients.
Keywords: T cell immunoglobulin mucin-3; colorectal cancer; exhausted T cells; metastasis; tumor microenvironment.
Conflict of interest statement
The authors declare no conflicts of interest.
Figures


Similar articles
-
Immune Checkpoints in Circulating and Tumor-Infiltrating CD4+ T Cell Subsets in Colorectal Cancer Patients.Front Immunol. 2019 Dec 17;10:2936. doi: 10.3389/fimmu.2019.02936. eCollection 2019. Front Immunol. 2019. PMID: 31921188 Free PMC article. Clinical Trial.
-
Circulating and Tumor-Infiltrating Immune Checkpoint-Expressing CD8+ Treg/T Cell Subsets and Their Associations with Disease-Free Survival in Colorectal Cancer Patients.Cancers (Basel). 2022 Jun 29;14(13):3194. doi: 10.3390/cancers14133194. Cancers (Basel). 2022. PMID: 35804964 Free PMC article.
-
Correlations between Circulating and Tumor-Infiltrating CD4+ T Cell Subsets with Immune Checkpoints in Colorectal Cancer.Vaccines (Basel). 2022 Mar 30;10(4):538. doi: 10.3390/vaccines10040538. Vaccines (Basel). 2022. PMID: 35455287 Free PMC article.
-
The Role of Tregs in the Tumor Microenvironment.Biomedicines. 2025 May 11;13(5):1173. doi: 10.3390/biomedicines13051173. Biomedicines. 2025. PMID: 40427000 Free PMC article. Review.
-
Checkpoint molecules on infiltrating immune cells in colorectal tumor microenvironment.Front Med (Lausanne). 2022 Aug 22;9:955599. doi: 10.3389/fmed.2022.955599. eCollection 2022. Front Med (Lausanne). 2022. PMID: 36072957 Free PMC article. Review.
Cited by
-
CD4 T-Cell Exhaustion: Does It Exist and What Are Its Roles in Cancer?Clin Cancer Res. 2021 Nov 1;27(21):5742-5752. doi: 10.1158/1078-0432.CCR-21-0206. Epub 2021 Jun 14. Clin Cancer Res. 2021. PMID: 34127507 Free PMC article. Review.
-
Advances in vaccine development for cancer prevention and treatment in Lynch Syndrome.Mol Aspects Med. 2023 Oct;93:101204. doi: 10.1016/j.mam.2023.101204. Epub 2023 Jul 19. Mol Aspects Med. 2023. PMID: 37478804 Free PMC article. Review.
-
Emerging Role of Immunotherapy for Colorectal Cancer with Liver Metastasis.Onco Targets Ther. 2020 Nov 13;13:11645-11658. doi: 10.2147/OTT.S271955. eCollection 2020. Onco Targets Ther. 2020. PMID: 33223838 Free PMC article. Review.
-
Value Research of NLR, PLR, and RDW in Prognostic Assessment of Patients with Colorectal Cancer.J Healthc Eng. 2022 Apr 16;2022:7971415. doi: 10.1155/2022/7971415. eCollection 2022. J Healthc Eng. 2022. PMID: 35469225 Free PMC article.
-
Transcriptomic Analyses of Myeloid-Derived Suppressor Cell Subsets in the Circulation of Colorectal Cancer Patients.Front Oncol. 2020 Sep 2;10:1530. doi: 10.3389/fonc.2020.01530. eCollection 2020. Front Oncol. 2020. PMID: 32984004 Free PMC article.
References
-
- Monney L., Sabatos C.A., Gaglia J.L., Ryu A., Waldner H., Chernova T., Manning S., Greenfield E.A., Coyle A.J., Sobel R.A., et al. Th1-specific cell surface protein Tim-3 regulates macrophage activation and severity of an autoimmune disease. Nature. 2002;415:536–541. doi: 10.1038/415536a. - DOI - PubMed
Grants and funding
LinkOut - more resources
Full Text Sources
Research Materials
