. 2020 Feb 6;21(3):1092.
doi: 10.3390/ijms21031092.

Displaced Myonuclei in Cancer Cachexia Suggest Altered Innervation

Affiliations

Displaced Myonuclei in Cancer Cachexia Suggest Altered Innervation

Nissrine Daou et al. Int J Mol Sci. .

Abstract

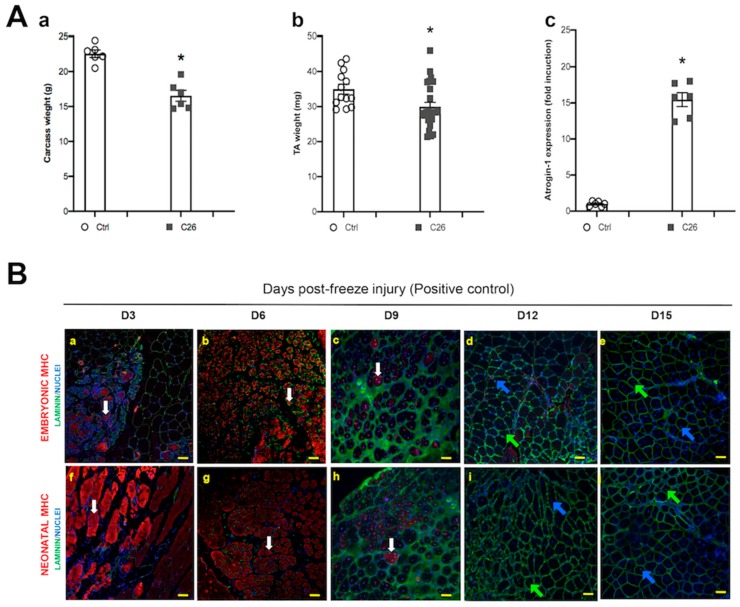
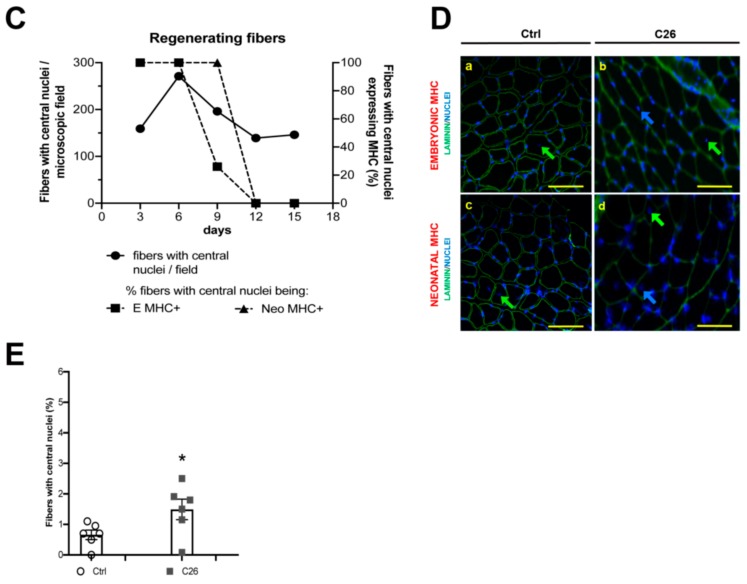
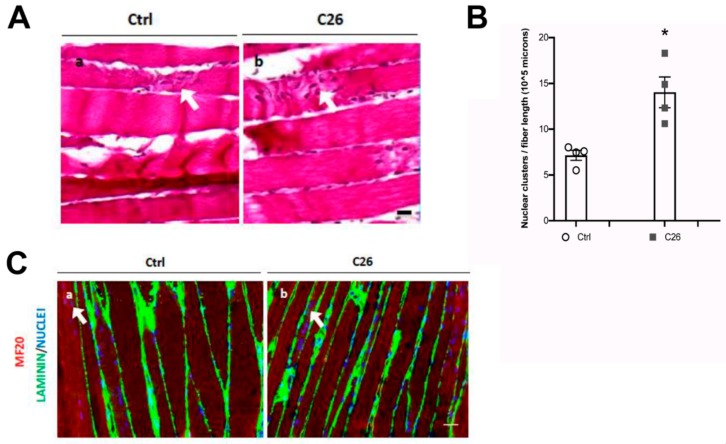
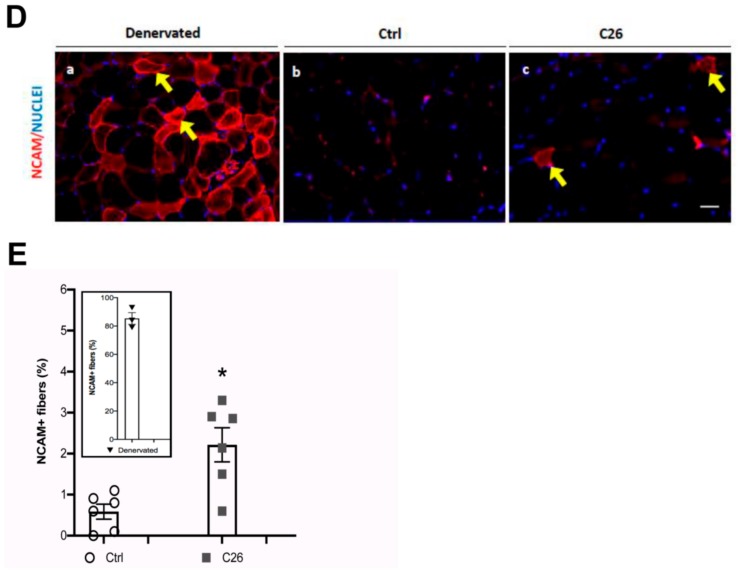
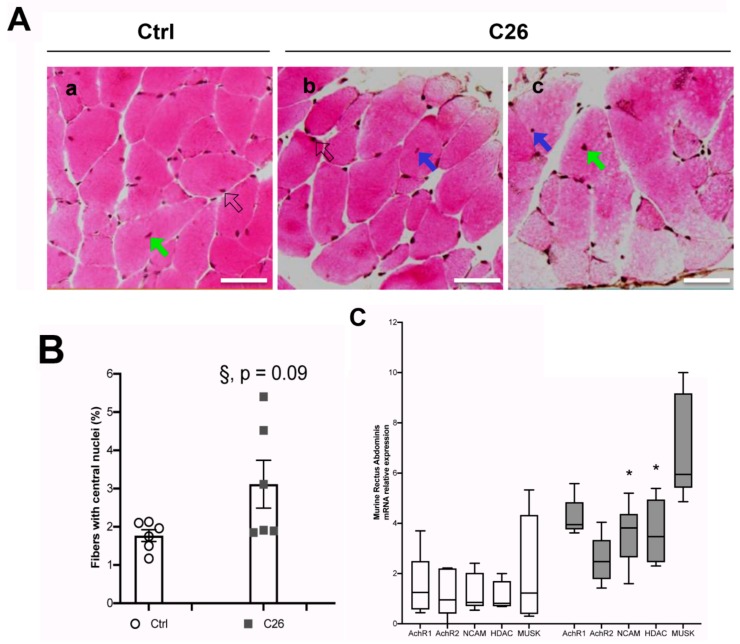
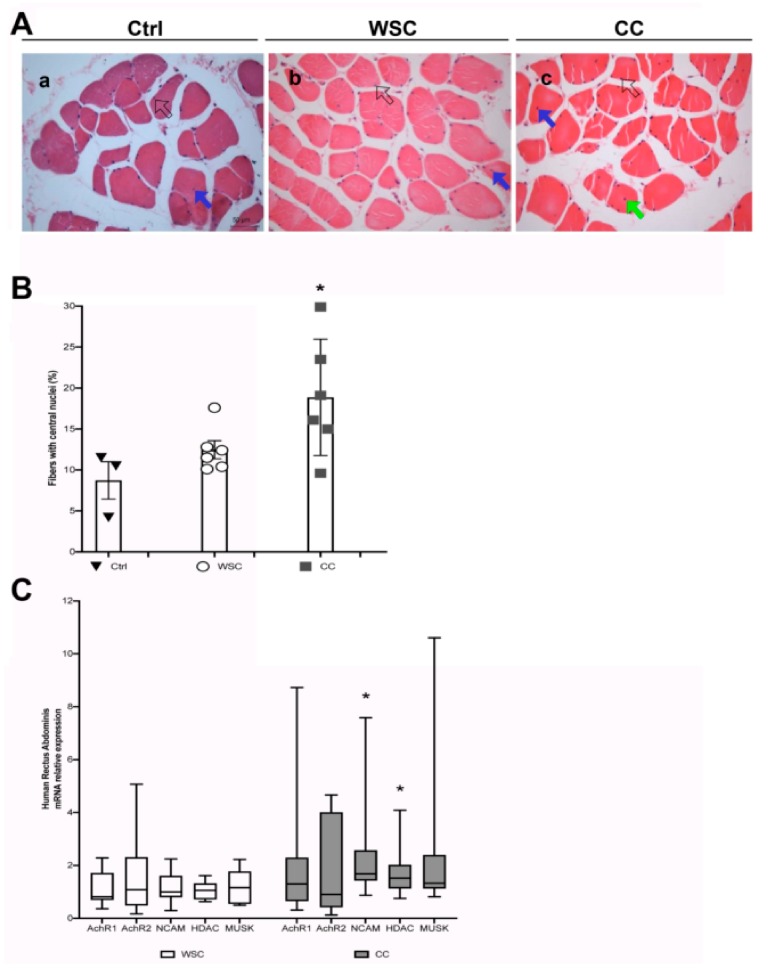
An idiopathic myopathy characterized by central nuclei in muscle fibers, a hallmark of muscle regeneration, has been observed in cancer patients. In cancer cachexia skeletal muscle is incapable of regeneration, consequently, this observation remains unaccounted for. In C26-tumor bearing, cachectic mice, we observed muscle fibers with central nuclei in the absence of molecular markers of bona fide regeneration. These clustered, non-peripheral nuclei were present in NCAM-expressing muscle fibers. Since NCAM expression is upregulated in denervated myofibers, we searched for additional makers of denervation, including AchRs, MUSK, and HDAC. This last one being also consistently upregulated in cachectic muscles, correlated with an increase of central myonuclei. This held true in the musculature of patients suffering from gastrointestinal cancer, where a progressive increase in the number of central myonuclei was observed in weight stable and in cachectic patients, compared to healthy subjects. Based on all of the above, the presence of central myonuclei in cancer patients and animal models of cachexia is consistent with motor neuron loss or NMJ perturbation and could underlie a previously neglected phenomenon of denervation, rather than representing myofiber damage and regeneration in cachexia. Similarly to aging, denervation-dependent myofiber atrophy could contribute to muscle wasting in cancer cachexia.

Keywords: Central nuclei; altered innervation; c26-colon carcinoma; cancer cachexia; muscle regeneration; striated muscles.


Conflict of interest statement

The authors declare no conflict of interest.

Figures

Figure 1
Figure 1
Myofibers with central myonuclei do not express bona fide early regeneration markers in the tibialis of cachectic mice. (A) Carcass (i.e. net body weight, minus tutor weight) (a) and tibialis anterior (TA) muscle (b) weight in control (Ctrl) and in tumor-bearing (C26) mice, showing a significant decrease of body and muscle mass in cachexia. Muscle wasting is due to protein dismantling, as shown by the muscle-specific Ub-ligase Atrogin-1 upregulation in cachexia (c). For carcass weight (a) and Atrogin-1 (c) n = 6 for each group; for TA weight n = 12 and n = 25, for Ctrl and C26, respectively; * p < 0.05, by Student’s t test. (B) Photomicrographs of TA muscle at 3, 6, 9, 12 and 15 days (D3 to D15) following freeze injury, immunostained for embryonic (ae) or neonatal (fj) MHC (red); nuclei are counterstained by Hoechst (blue), while laminin immunostaining (green) highlights muscle fibers. Embryonic MHC+ and MHC- fibers with central myonuclei are indicated by white arrows (a,b,c,f,g,h) or blue and green arrows (d,e,i,j), respectively. (C) Quantification of muscle fibers showing central myonuclei and expressing embryonic MHC. These fibers stop expressing the regeneration markers at D9. (D) Photomicrographs of TA muscle immunostained for embryonic (a and b) or neonatal (c and d) MHC (red) and laminin (green), in control (a, c) and C26-tumor bearing (b, d) mice; nuclei are counterstained by Hoechst (blue). Fibers with central myonuclei, negative for either type of MHC, are indicated by blue or green arrows (in the first case the nucleus is just displaced from its subsarcolemmal position, while in the second case it is closer to the center of the fiber). Scale bar is 50 μm. (E) Quantification of the fibers with central myonuclei observed in D.
Figure 1
Figure 1
Myofibers with central myonuclei do not express bona fide early regeneration markers in the tibialis of cachectic mice. (A) Carcass (i.e. net body weight, minus tutor weight) (a) and tibialis anterior (TA) muscle (b) weight in control (Ctrl) and in tumor-bearing (C26) mice, showing a significant decrease of body and muscle mass in cachexia. Muscle wasting is due to protein dismantling, as shown by the muscle-specific Ub-ligase Atrogin-1 upregulation in cachexia (c). For carcass weight (a) and Atrogin-1 (c) n = 6 for each group; for TA weight n = 12 and n = 25, for Ctrl and C26, respectively; * p < 0.05, by Student’s t test. (B) Photomicrographs of TA muscle at 3, 6, 9, 12 and 15 days (D3 to D15) following freeze injury, immunostained for embryonic (ae) or neonatal (fj) MHC (red); nuclei are counterstained by Hoechst (blue), while laminin immunostaining (green) highlights muscle fibers. Embryonic MHC+ and MHC- fibers with central myonuclei are indicated by white arrows (a,b,c,f,g,h) or blue and green arrows (d,e,i,j), respectively. (C) Quantification of muscle fibers showing central myonuclei and expressing embryonic MHC. These fibers stop expressing the regeneration markers at D9. (D) Photomicrographs of TA muscle immunostained for embryonic (a and b) or neonatal (c and d) MHC (red) and laminin (green), in control (a, c) and C26-tumor bearing (b, d) mice; nuclei are counterstained by Hoechst (blue). Fibers with central myonuclei, negative for either type of MHC, are indicated by blue or green arrows (in the first case the nucleus is just displaced from its subsarcolemmal position, while in the second case it is closer to the center of the fiber). Scale bar is 50 μm. (E) Quantification of the fibers with central myonuclei observed in D.
Figure 2
Figure 2
Central myonuclei are clumped in atrophic myofibers and their presence is associated to N-CAM upregulation in the tibialis of cachectic mice. (A) Photomicrographs of H&E-stained longitudinal sections of TA muscle, showing clumps of nuclei (arrows) in both healthy (a, Ctrl) and in cachectic (b, C26) muscles; however, in the latter, the frequency of clumps is significantly increased, as shown in the corresponding quantification (B); n = 6 for each group, * p < 0.05 by Student test. (C) Immunofluorescence analysis for MHC (red), laminin (green) and nuclei (blue) showing the occurrence of nuclear clumps (arrow) within the myofibers and not in the interstitial space, in longitudinal sections of the TA muscle. (D) Immunofluorescence analysis for N-CAM (red), nuclei are counterstained by Hoechst (blue) on transversal section of TA muscle. Fibers expressing high levels of N-CAM (arrows) are numerous in denervated muscles (a, positive control), rare in controls (b) and significantly higher in cachectic muscles (c). NCAM is also detectable in satellite cells, which are distinguishable as dots. Quantification of the percentage of N-CAM+ fibers is shown in (E), for control (Ctrl), cachectic (C26) and denervated (inset) muscles. Data are presented as mean +/- SEM, n = 6 for each group. Scale bar is 10 μm in panel A, 25 μm in panel C and D.
Figure 2
Figure 2
Central myonuclei are clumped in atrophic myofibers and their presence is associated to N-CAM upregulation in the tibialis of cachectic mice. (A) Photomicrographs of H&E-stained longitudinal sections of TA muscle, showing clumps of nuclei (arrows) in both healthy (a, Ctrl) and in cachectic (b, C26) muscles; however, in the latter, the frequency of clumps is significantly increased, as shown in the corresponding quantification (B); n = 6 for each group, * p < 0.05 by Student test. (C) Immunofluorescence analysis for MHC (red), laminin (green) and nuclei (blue) showing the occurrence of nuclear clumps (arrow) within the myofibers and not in the interstitial space, in longitudinal sections of the TA muscle. (D) Immunofluorescence analysis for N-CAM (red), nuclei are counterstained by Hoechst (blue) on transversal section of TA muscle. Fibers expressing high levels of N-CAM (arrows) are numerous in denervated muscles (a, positive control), rare in controls (b) and significantly higher in cachectic muscles (c). NCAM is also detectable in satellite cells, which are distinguishable as dots. Quantification of the percentage of N-CAM+ fibers is shown in (E), for control (Ctrl), cachectic (C26) and denervated (inset) muscles. Data are presented as mean +/- SEM, n = 6 for each group. Scale bar is 10 μm in panel A, 25 μm in panel C and D.
Figure 3
Figure 3
An increased number of central nuclei in the murine Rectus Abdominis (RA) fibers is associated with cachexia and denervation markers. (A) Representative images showing H&E staining of cross sections from the RA of control (a, Ctrl) and C26-tumor bearing (C26) mice; for the latter, two panels from different regions of the muscle are shown (b and c). Central nuclei are indicated by blue or green arrows (in the first case the nucleus is just displaced from its subsarcolemmal position, while in the second case it is closer to the center of the fiber); peripheral (i.e. normal) myonuclei are indicated by open arrows. Scale bar is 50 μm. (B) Percentage of fibers with central nuclei in control (Ctrl) and C26 mice. The Student’s t test showed a quasi-significant difference (§, p = 0.09) between Ctrl and C26. (C) Q-PCR analysis on muscle from the RA of Ctrl and C26 mice for denervation markers as indicated. Data are presented as box-and-whisker plot, showing the median +/- 10–90 percentile range, and analyzed by using Wilcoxon-Mann-Whitney test; * p < 0.05; n = 6 for each group.
Figure 4
Figure 4
An increased number of central nuclei in the human Rectus Abdominis fibers is associated with cachexia and denervation markers. (A) Representative images showing H&E staining of cross sections from the RA muscle of patients without cancer (a, Ctrl), Weight-Stable Cancer patients (b, WSC) and Cancer Cachexia patients (c, CC). Central nuclei are indicated by blue or green arrows (in the first case the nucleus is just displaced from the subsarcolemmal position, while in the second case it is closer to the center of the fiber); peripheral (i.e. normal) myonuclei are indicated by open arrows. Scale bar is 50 μm. (B) Percentage of fibers with central nuclei in muscle cross-sections of Ctrl, WSC and CC patients (a randomly chosen subset of the patients in Table 1). The three groups showed significant differences in the number of fibers with central myonuclei (F = 4.93; df = 2; p = 0.025 by ANOVA; * p < 0.05 by Tukey’s HSD test, used as a post-hoc test for CC vs Ctrl). Data are presented as mean +/- SEM, n = 3–6 for each group. (C) Q-PCR analysis on muscle from the RA of WSC (n = 10) and CC (n = 13) patients for denervation markers as indicated. Data are presented as box-and-whisker plot, showing the median +/- 10–90 percentile range, and analyzed by using Wilcoxon-Mann-Whitney test; * p < 0.05.

Similar articles

Cited by

References

    1. Tseng B.S., Kasper C.E., Edgerton V.R. Cytoplasm-to-myonucleus ratios and succinate dehydrogenase activities in adult rat slow and fast muscle fibers. Cell Tissue Res. 1994;275:39–49. doi: 10.1007/BF00305374. - DOI - PubMed
    1. Bruusgaard J.C., Liestol K., Ekmark M., Kollstad K., Gundersen K. Number and spatial distribution of nuclei in the muscle fibres of normal mice studied in vivo. J. Physiol. 2003;551:467–478. doi: 10.1113/jphysiol.2003.045328. - DOI - PMC - PubMed
    1. Schwartz L.M. Skeletal Muscles Do Not Undergo Apoptosis During Either Atrophy or Programmed Cell Death-Revisiting the Myonuclear Domain Hypothesis. Front. Physiol. 2018;9:1887. doi: 10.3389/fphys.2018.01887. - DOI - PMC - PubMed
    1. Spiro A.J., Shy G.M., Gonatas N.K. Myotubular myopathy. Persistence of fetal muscle in an adolescent boy. Arch. Neurol. 1966;14:1–14. doi: 10.1001/archneur.1966.00470070005001. - DOI - PubMed
    1. Mazzotti A.L., Coletti D. The Need for a Consensus on the Locution "Central Nuclei" in Striated Muscle Myopathies. Front. Physiol. 2016;7:577. doi: 10.3389/fphys.2016.00577. - DOI - PMC - PubMed