

Genome-wide association study (GWAS) reveals genetic loci of lead (Pb) tolerance during seedling establishment in rapeseed (Brassica napus L.)
- PMID: 32041524
- PMCID: PMC7011513
- DOI: 10.1186/s12864-020-6558-4
Genome-wide association study (GWAS) reveals genetic loci of lead (Pb) tolerance during seedling establishment in rapeseed (Brassica napus L.)
Abstract
Background: Lead (Pb) pollution in soil has become one of the major environmental threats to plant growth and human health. Safe utilization of Pb contaminated soil by phytoremediation require Pb-tolerant rapeseed (Brassica napus L.) accessions. However, breeding of new B. napus cultivars tolerance to Pb stress has been restricted by limited knowledge on molecular mechanisms involved in Pb tolerance. This work was carried out to identify genetic loci related to Pb tolerance during seedling establishment in rapeseed.
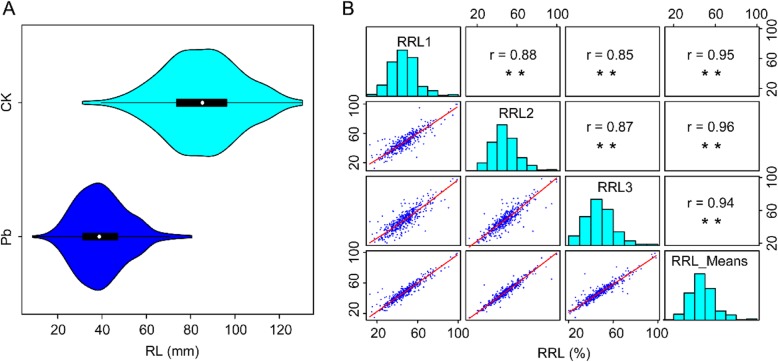
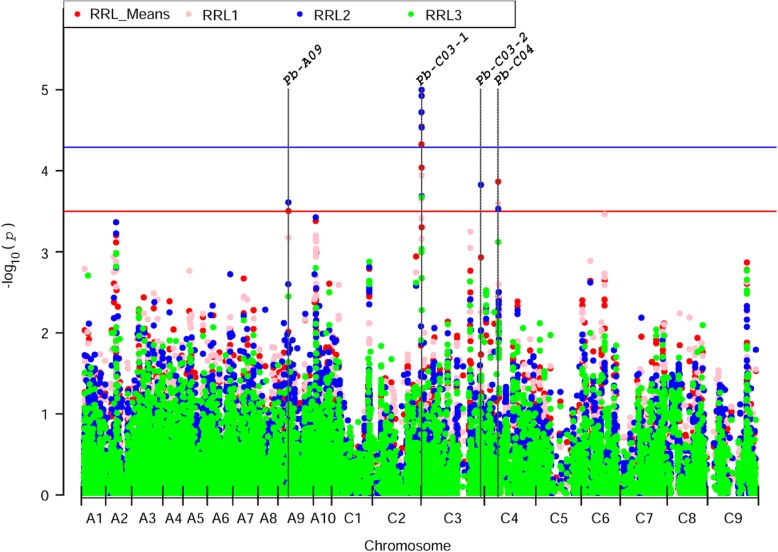
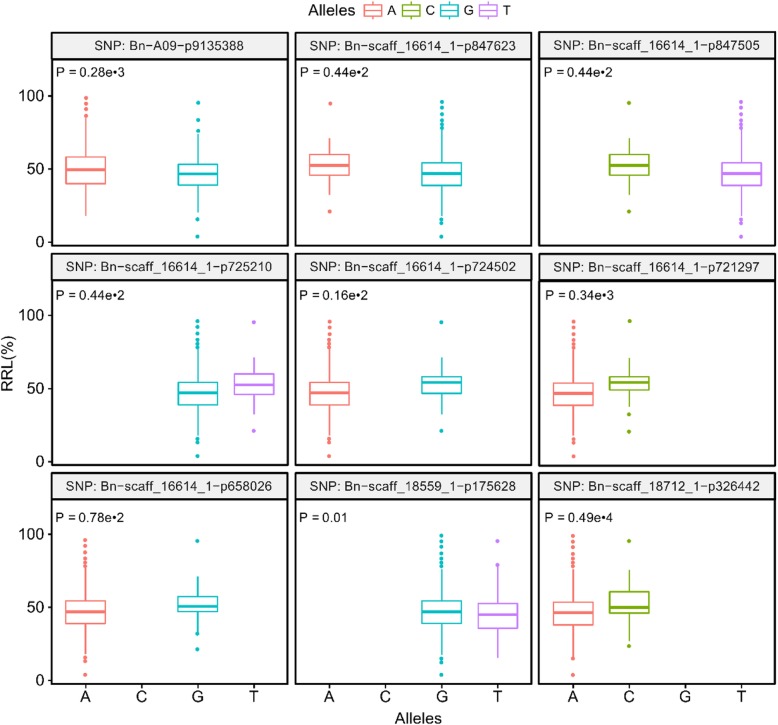
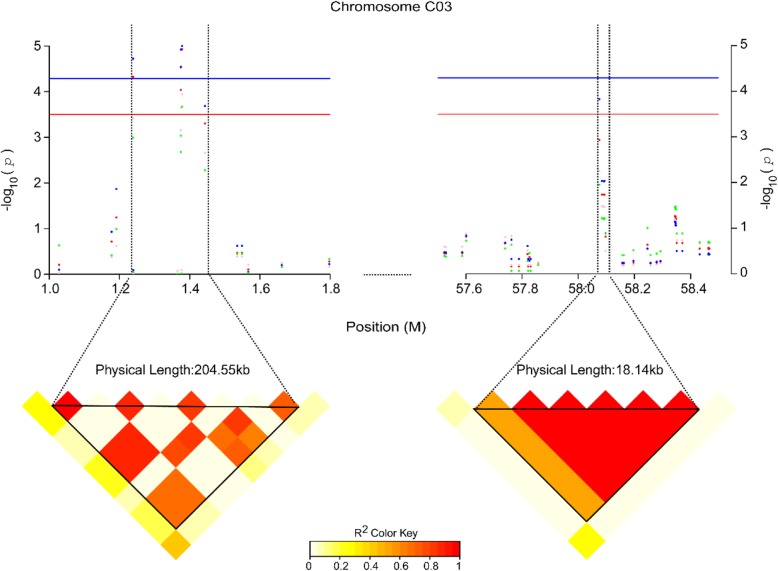
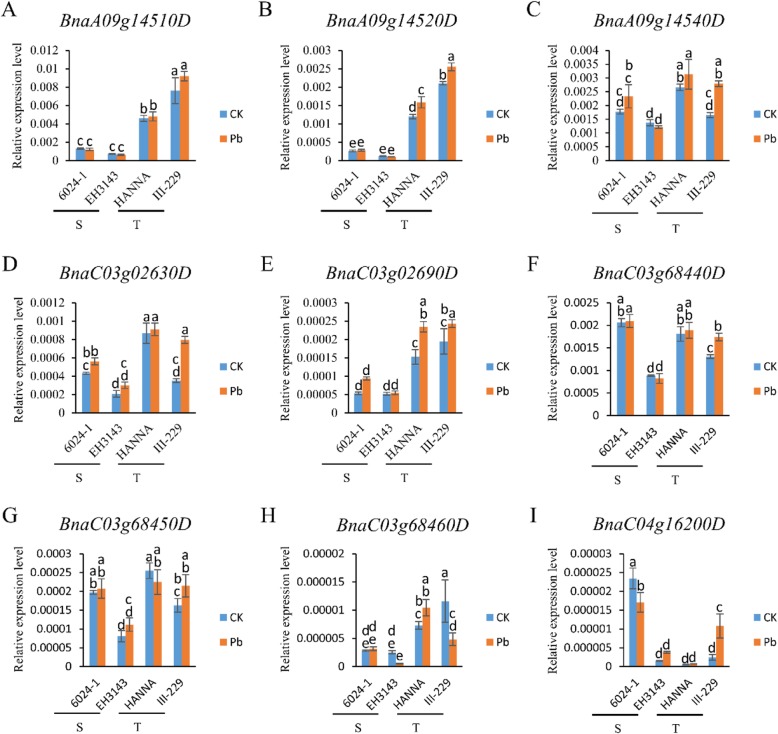
Results: Pb tolerance, which was assessed by quantifying radicle length (RL) under 0 or 100 mg/L Pb stress condition, shown an extensive variation in 472 worldwide-collected rapeseed accessions. Based on the criterion of relative RL > 80%, six Pb-tolerant genotypes were selected. Four quantitative trait loci (QTLs) associated with Pb tolerance were identified by Genome-wide association study. The expression level of nine promising candidate genes, including GSTUs, BCATs, UBP13, TBR and HIPP01, located in these four QTL regions, were significantly higher or induced by Pb in Pb-tolerant accessions in comparison to Pb-sensitive accessions.
Conclusion: To our knowledge, this is the first study on Pb-tolerant germplasms and genomic loci in B. napus. The findings can provide valuable genetic resources for the breeding of Pb-tolerant B. napus cultivars and understanding of Pb tolerance mechanism in Brassica species.
Keywords: GWAS; Lead (Pb) tolerance; Phytoremediation; Rapeseed; SNP markers.
Conflict of interest statement
The authors declare that they have no competing interests.
Figures
Similar articles
-
Identification of genetic variation for salt tolerance in Brassica napus using genome-wide association mapping.Mol Genet Genomics. 2021 Mar;296(2):391-408. doi: 10.1007/s00438-020-01749-8. Epub 2021 Jan 19. Mol Genet Genomics. 2021. PMID: 33464396
-
Physiological and molecular mechanism of cadmium (Cd) tolerance at initial growth stage in rapeseed (Brassica napus L.).Ecotoxicol Environ Saf. 2020 Jul 1;197:110613. doi: 10.1016/j.ecoenv.2020.110613. Epub 2020 Apr 15. Ecotoxicol Environ Saf. 2020. PMID: 32304923
-
Genome-Wide Association Study Reveals the Genetic Architecture Underlying Salt Tolerance-Related Traits in Rapeseed (Brassica napus L.).Front Plant Sci. 2017 Apr 26;8:593. doi: 10.3389/fpls.2017.00593. eCollection 2017. Front Plant Sci. 2017. PMID: 28491067 Free PMC article.
-
Advances and Challenges for QTL Analysis and GWAS in the Plant-Breeding of High-Yielding: A Focus on Rapeseed.Biomolecules. 2021 Oct 15;11(10):1516. doi: 10.3390/biom11101516. Biomolecules. 2021. PMID: 34680149 Free PMC article. Review.
-
Omics: The way forward to enhance abiotic stress tolerance in Brassica napus L.GM Crops Food. 2021 Jan 2;12(1):251-281. doi: 10.1080/21645698.2020.1859898. GM Crops Food. 2021. PMID: 33464960 Free PMC article. Review.
Cited by
-
Advances in "Omics" Approaches for Improving Toxic Metals/Metalloids Tolerance in Plants.Front Plant Sci. 2022 Jan 4;12:794373. doi: 10.3389/fpls.2021.794373. eCollection 2021. Front Plant Sci. 2022. PMID: 35058954 Free PMC article. Review.
-
Construction of a Quantitative Genomic Map, Identification and Expression Analysis of Candidate Genes for Agronomic and Disease-Related Traits in Brassica napus.Front Plant Sci. 2022 Mar 11;13:862363. doi: 10.3389/fpls.2022.862363. eCollection 2022. Front Plant Sci. 2022. PMID: 35360294 Free PMC article.
-
Genome-Wide Association Study Reveals Key Genes for Differential Lead Accumulation and Tolerance in Natural Arabidopsis thaliana Accessions.Front Plant Sci. 2021 Aug 6;12:689316. doi: 10.3389/fpls.2021.689316. eCollection 2021. Front Plant Sci. 2021. PMID: 34421943 Free PMC article.
-
Identification of the MYB gene family in Sorghum bicolor and functional analysis of SbMYBAS1 in response to salt stress.Plant Mol Biol. 2023 Nov;113(4-5):249-264. doi: 10.1007/s11103-023-01386-w. Epub 2023 Nov 14. Plant Mol Biol. 2023. PMID: 37964053
References
-
- Verkleij JAC, Golan-Goldhirsh A, Antosiewisz DM, Schwitzguébel J-P, Schröder P. Dualities in plant tolerance to pollutants and their uptake and translocation to the upper plant parts. Environ Exp Bot. 2009;67(1):10–22. doi: 10.1016/j.envexpbot.2009.05.009. - DOI
MeSH terms
Substances
Grants and funding
LinkOut - more resources
Full Text Sources
