. 2020 Feb 10;12(1):22.
doi: 10.1186/s13148-020-0815-x.

Epigenetic silencing of IGFBPL1 promotes esophageal cancer growth by activating PI3K-AKT signaling

Affiliations

Epigenetic silencing of IGFBPL1 promotes esophageal cancer growth by activating PI3K-AKT signaling

Yingge Liu et al. Clin Epigenetics. .

Abstract

Background: There are seven insulin-like growth factor binding proteins (IGFBPs) that bind insulin-like growth factors (IGFs). IGFBP like protein1 (IGFBPL1) is a new member of this family. The function and mechanism of IGFBPL1 in esophageal cancer remains to be elucidated.

Methods: Eight esophageal cancer cell lines, 114 cases of esophageal dysplasia, and 501 cases of primary esophageal cancer samples were examined in this study. Methylation-specific polymerase chain reaction (MSP), immunohistochemistry, Western blot, flow cytometry, RNA interference assay, and xenograft mouse models were employed.

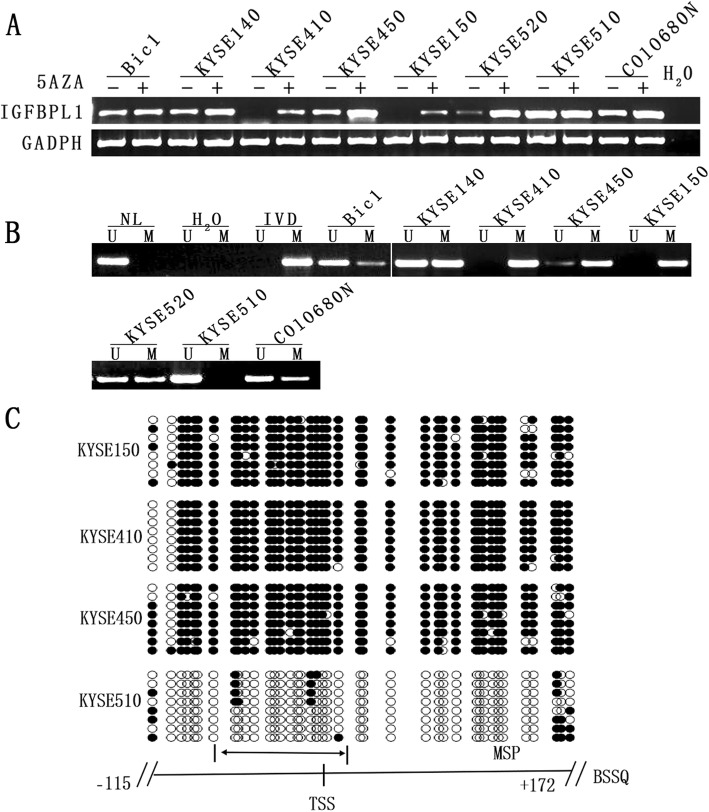
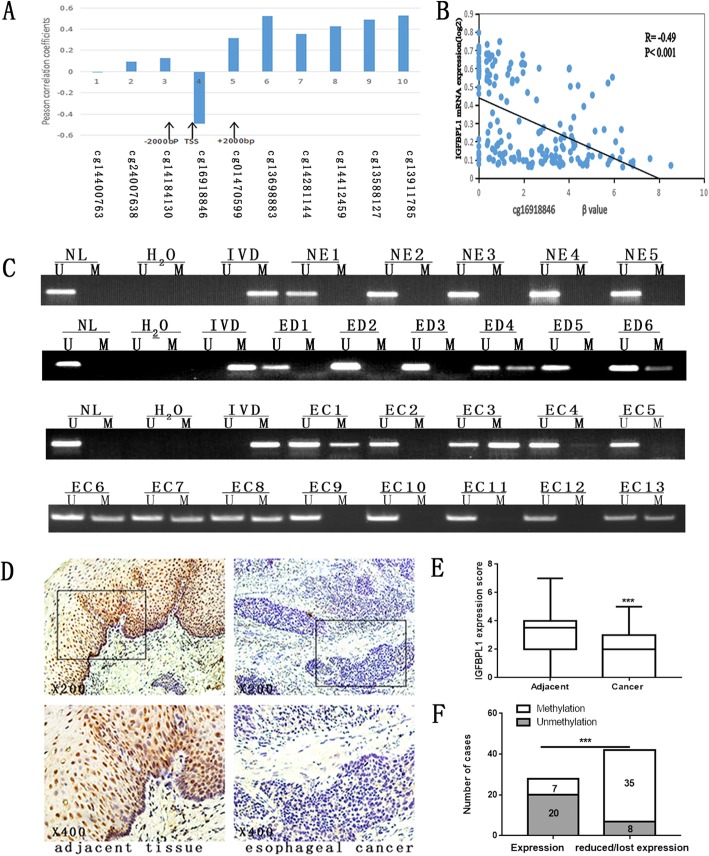
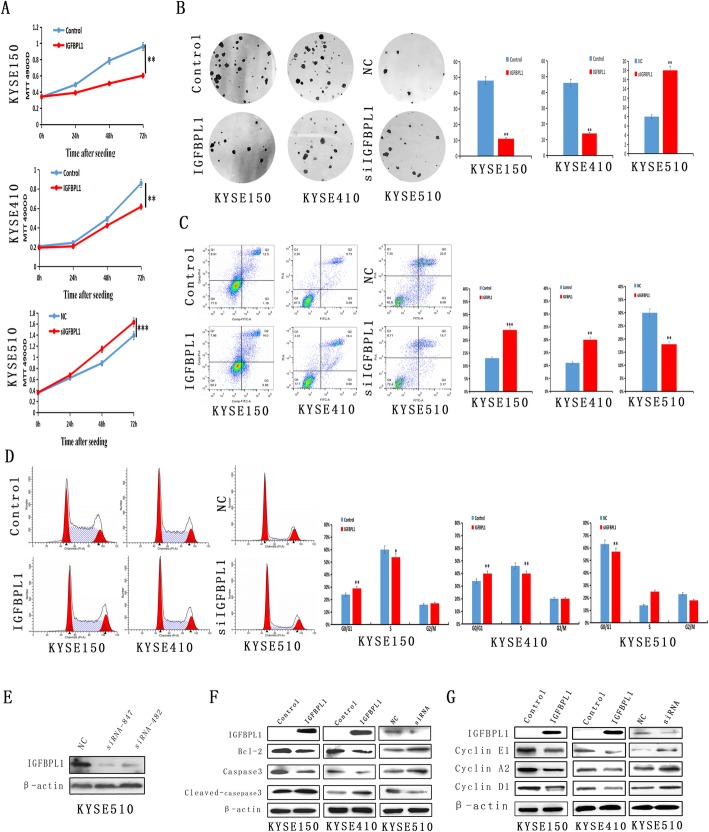
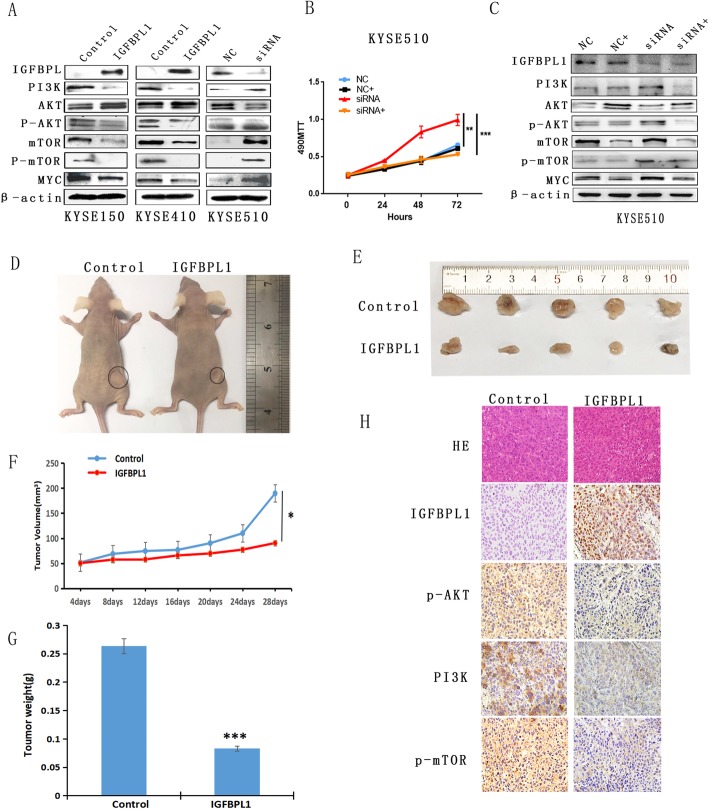
Results: The expression of IGFBPL1was lost and complete methylation was found in KYSE150 and KYSE410 cells. Reduced expression and partial methylation of IGFBPL1 was found in Bic1, KYSE140, KYSE450, KYSE520, and COLO680N cells. High expression and unmethylation was detected in KYSE510 cells. Restoration of IGFBPL1 expression was found in KYSE150 and KYSE410 cells and the expression of IGFBPL1 was increased in Bic1, KYSE140, KYSE450, KYSE520, and COLO680N cells, after 5-AZA-2'-deoxycytidine treatment. IGFBPL1 was methylated in 47.3% (53/114) of esophageal dysplasia and 49.1% (246/501) of human primary esophageal squamous cell carcinoma (ESCC). Methylation of IGFBPL1 was significantly associated with TNM stage (p = 0.012), and tumor size (p = 0.009). IGFBPL1 inhibited esophageal cancer cell clonal formation and proliferation and induced cell apoptosis and G1/S phase arrest. Further study found that IGFBPL1 is involved in PI3K-AKT signaling and IGFBPL1 suppressed human ESCC xenografts growth in mice.

Conclusion: IGFBPL1 suppresses esophageal cancer cell growth by inhibiting PI3K-AKT signaling in vitro and in vivo. IGFBPL1 is a novel tumor suppressor in human esophageal cancer.

Keywords: DNA methylation; Esophageal cancer; IGFBPL1; PI3K-AKT.


Conflict of interest statement

The authors declare that they have no competing interests.

Figures

Fig. 1
Fig. 1
IGFBPL1 expression and methylation status in esophageal cancer cells. a The expression of IGFBPL1 was detected by semi-quantitative RT-PCR. H2O, negative control; GAPDH, internal control. 5-AZA, 5-AZA-2′-deoxycytidine. “−” indicates the absence of 5-AZA; “+” indicated the presence of 5-AZA. b MSP results of IGFBPL1 in esophageal cancer cell lines. IVD, in vitro-methylated DNA (methylation control); NL, normal lymphocyte DNA (unmethylation control); H2O, double distilled water; U, unmethylated alleles; M, methylated alleles. c Bisulfite sequencing results of IGFBPL1 in KYSE150, KYSE410, KYSE450, and KYSE510 cells. Double-headed arrow indicates MSP PCR product size was 98 bp and bisulfite sequencing focused on a 287 bp region of the CpG island (from − 115 to + 172) around the IGFBPL1 transcription start site. Filled circles indicate methylated CpG sites. Open circles indicate unmethylated CpG sites; TSS: transcription start site
Fig. 2
Fig. 2
The expression and methylation status of IGFBPL1 in human esophageal dysplasia and ESCC. a Pearson correlation coefficient between IGFBPL1 methylation and expression of each CpG site. b Scatter plots showing the methylation status of the 4th (cg16918846) CpG sites, which are correlated with loss or reduced IGFBPL1 expression in 186 cases of ESCC tissue samples. ***p < 0.001. c Representative methylation results of IGFBPL1 in normal esophageal mucosa (NE), esophageal dysplasia (ED), and esophageal cancer (EC). The frequency of IGFBPL1 methylation was analyzed by chi-square test. d Representative IHC staining of IGFBPL1 in esophageal cancer (right panels) and adjacent tissue (left panels). Upper panels, × 200; lower panels, × 400. e The IGFBPL expression score is shown as a block diagram; the horizontal line represents the median score; the bottom and top of the box represent the 25th and 75th percentile, respectively; and the vertical bar chart indicates the scope of the data. There were significant differences in the expression of IGFBPL1 in adjacent tissues and cancer tissues in 70 cases of esophageal cancer. ***p < 0.001. f The expression of IGFBPL1 and DNA methylation status is shown as a bar diagram. Reduced or lost expression of IGFBPL1 was significantly associated with promoter region hypermethylation. ***p < 0.001
Fig. 3
Fig. 3
IGFBPL1 inhibits esophageal cancer cell proliferation and induces cell apoptosis and G1/S phase arrest. a The effect of IGFBPL1 on cell viability was examined by the MTT assay. The growth curves of IGFBPL1 re-expressed and unexpressed KYSE150 and KYSE410 cells, and KYSE510 cells before and after IGFBPL1 gene knockdown, were analyzed. Each experiment was repeated three times. **p < 0.01, ***p < 0.001. b Colony formation assays showed that the number of clones decreased after the expression of IGFBPL1 was restored in KYSE150 and KYSE410 cells, while the number of clones of KYSE510 cells increased after IGFBPL1 knockdown. Each experiment was repeated three times. **p < 0.01, ***p < 0.001. c Flow cytometry results showed that over-expression of IGFBPL1 in KYSE150 and KYSE410 cells induced apoptosis, whereas apoptosis decreased after knockdown of IGFBPL1 in KYSE510 cells. Each experiment was repeated three times. **p < 0.01, ***p < 0.001. d Cell cycle distribution of KYSE150 and KYSE410 cells that had no IGFBPL1 expression or re-expression of IGFBPL1 and KYSE510 before and after knockdown of IGFBPL1. Each experiment was repeated three times. **p < 0.0 1, ***p < 0.001. e IGFBPL1 in KYSE510 cells was knocked down by siRNA. IGFBPL1 expression was examined by Western blot. NC, siRNA for IGFBPL1 negative control; siRNA847 and siRNA482, siRNA for IGFBPL1. f Western blots showed that IGFBPL1 has an effect on the expression levels of caspase-3 and Bcl-2 in KYSE150, KYSE410, and KYSE510 cells. Control, control vector; IGFBPL1, IGFBPL1 expression vector; β-actin, internal control; NC, siRNA negative control; siRNA, siIGFBPL1. g Western blots validated the effect of IGFBPL1 on the protein expression levels of cyclin E1, cyclin A2, and cyclin D1. Control, control vector; IGFBPL1, IGFBPL1 expressing vector; β-actin, internal control; NC, siRNA negative control; siRNA, siIGFBPL1
Fig. 4
Fig. 4
IGFBPL1 inhibits the PI3K-AKT signaling pathway and suppresses human ESCC cell xenograft growth in mice. a Western blots showed that IGFBPL1 has an effect on the expression levels of PI3K, AKT, p-AKT, mTOR, p-mTOR, and MYC in KYSE150, KYSE410, and KYSE510 cells. Control, control vector; IGFBPL1, IGFBPL1 expression vector; β-actin, internal control; NC, siRNA negative control; siRNA, siIGFBPL1. b Growth curves represent cell viability evaluated by MTT assay in the control group, control plus NVP-BEZ235(100 nM) treatment group, siIGFBPL1 group, and siIGFBPL1 plus NVP-BEZ235 treatment group in KYSE510 cells. NC, control group; NC+, control plus NVP-BEZ235 treatment group; siRNA, siIGFBPL1; siRNA+, siIGFBPL1 plus NVP-BEZ235 treatment group. **p < 0.0 1, ***p < 0.001. c Western blots showed that IGFBPL1 has an effect on the expression levels of PI3K, AKT, p-AKT, mTOR, p-mTOR, and MYC in KYSE510 cells before and after NVP-BEZ235 treatment. NC, control group; NC+, control plus NVP-BEZ235 treatment group; siRNA, siIGFBPL1; siRNA+, siIGFBPL1 plus NVP-BEZ235 treatment group. d, e Represents tumors from KYSE150 cell xenografts in which IGFBPL1 is not expressed and IGFBPL1 is over-expressed. f Tumor growth curves of unexpressed IGFBPL1 and IGFBPL1 overexpressing KYSE150 cells. *p < 0.05. g Tumor weight at 28th day after inoculation of unexpressed IGFBPL1 and IGFBPL1 overexpressing KYSE150 cells in nude mice. Bars indicate mean of five mice. ***p < 0.001. h Images of hematoxylin and eosin staining show tumors from IGFBPL1 unexpressed and IGFBPL1 re-expressed KYSE150 xenograft mice. IHC staining reveals the expression levels of IGFBPL1, p-AKT, PI3K, and p-mTOR in IGFBPL1 unexpressed and IGFBPL1 re-expressed KYSE150 cell xenografts. Magnification, × 400

Similar articles

Cited by

References

    1. Fitzmaurice C, Dicker D, Pain A, Hamavid H, Moradi-Lakeh M, MacIntyre MF, Allen C, Hansen G, Woodbrook R, Wolfe C, et al. The global burden of Cancer 2013. JAMA Oncology. 2015;1(4):505–527. doi: 10.1001/jamaoncol.2015.0735. - DOI - PMC - PubMed
    1. Huang FL, Yu SJ. Esophageal cancer: risk factors, genetic association, and treatment. Asian J Surg. 2018;41(3):210–215. doi: 10.1016/j.asjsur.2016.10.005. - DOI - PubMed
    1. Pennathur A, Gibson MK, Jobe BA, Luketich JD. Oesophageal carcinoma. Lancet. 2013;381(9864):400–412. doi: 10.1016/S0140-6736(12)60643-6. - DOI - PubMed
    1. Brock MV, Gou M, Akiyama Y, Muller A, Wu TT, Montgomery E, Deasel M, Germonpre P, Rubinson L, Heitmiller RF, et al. Prognostic importance of promoter hypermethylation of multiple genes in esophageal adenocarcinoma. Clin Cancer Res. 2003;9(8):2912–2919. - PubMed
    1. Zhang HZ, Jin GF, Shen HB. Epidemiologic differences in esophageal cancer between Asian and Western populations. Chin J Cancer. 2012;31(6):281–286. doi: 10.5732/cjc.011.10390. - DOI - PMC - PubMed

Publication types

MeSH terms