. 2020 Feb 11:9:e52546.
doi: 10.7554/eLife.52546.

Imaging plant germline differentiation within Arabidopsis flowers by light sheet microscopy

Affiliations

Imaging plant germline differentiation within Arabidopsis flowers by light sheet microscopy

Sona Valuchova et al. Elife. .

Abstract

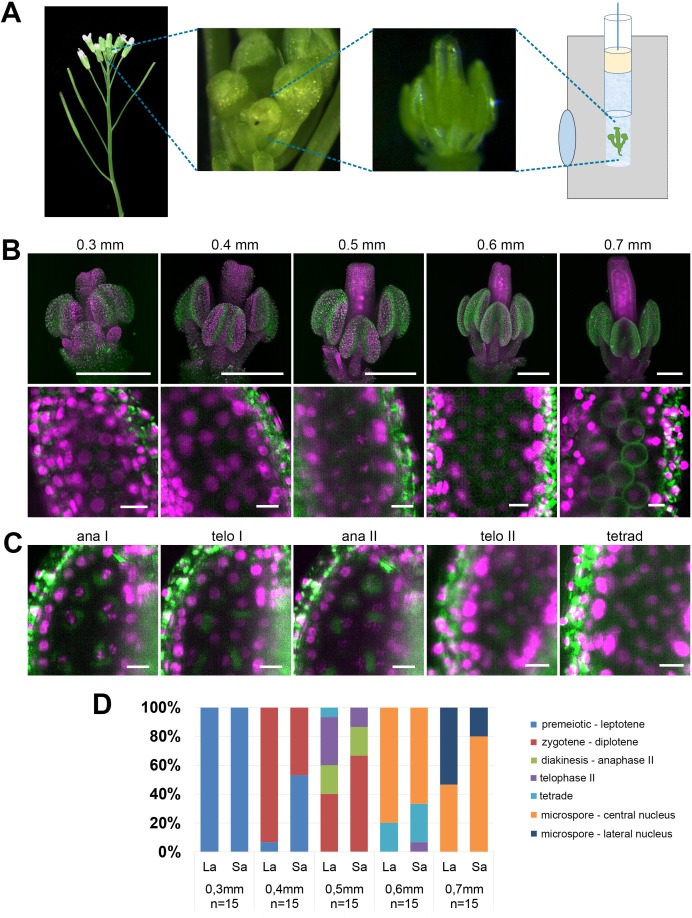
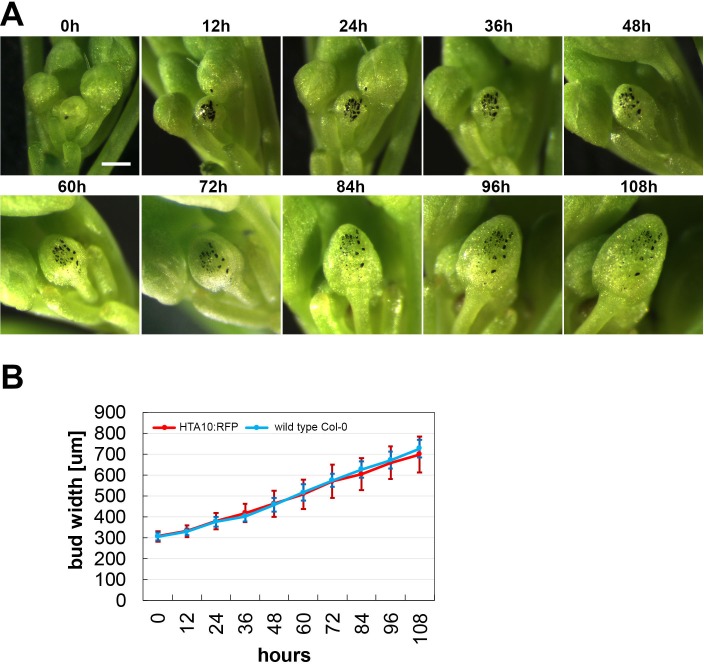
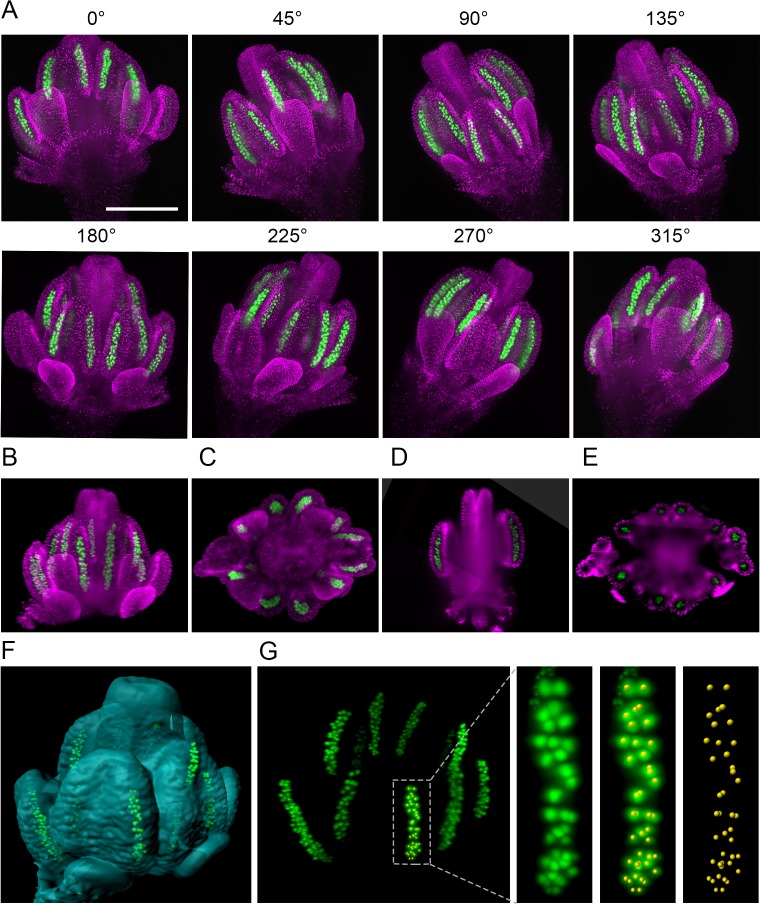
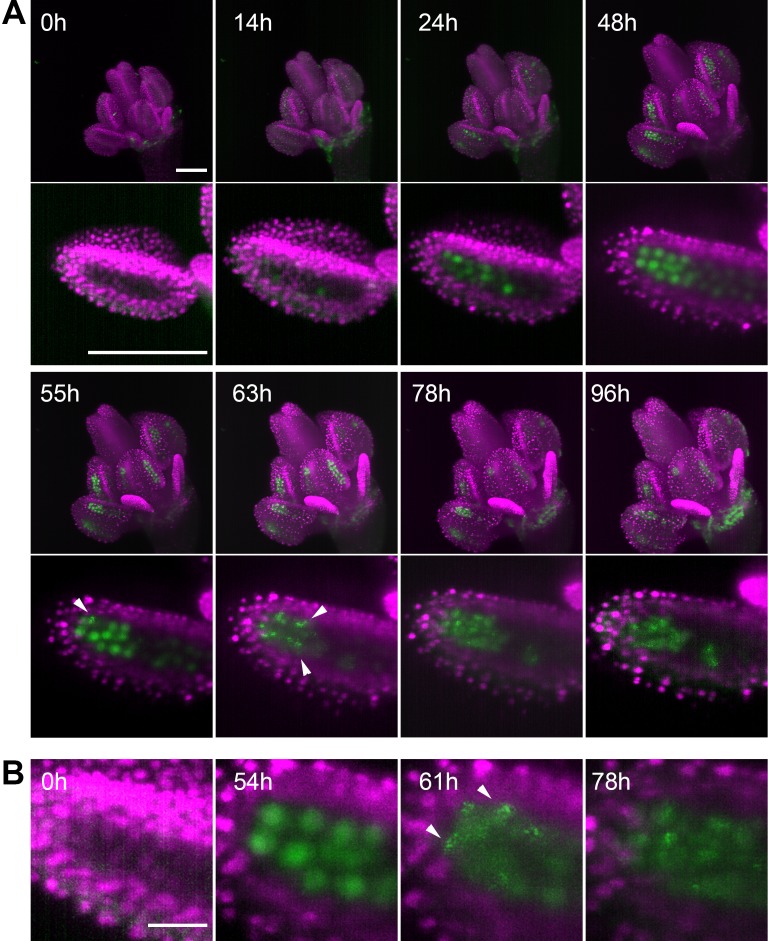
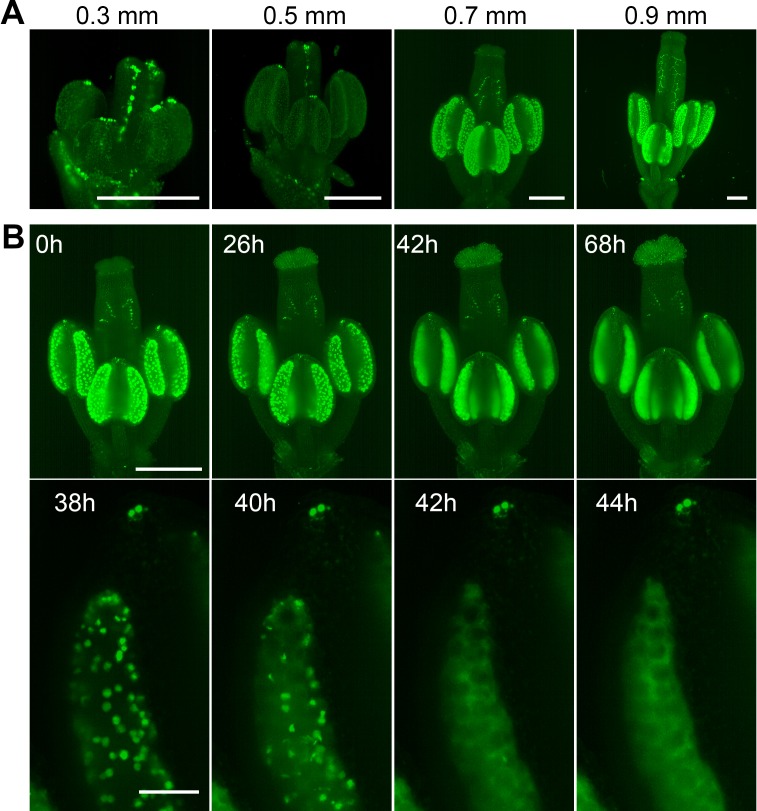
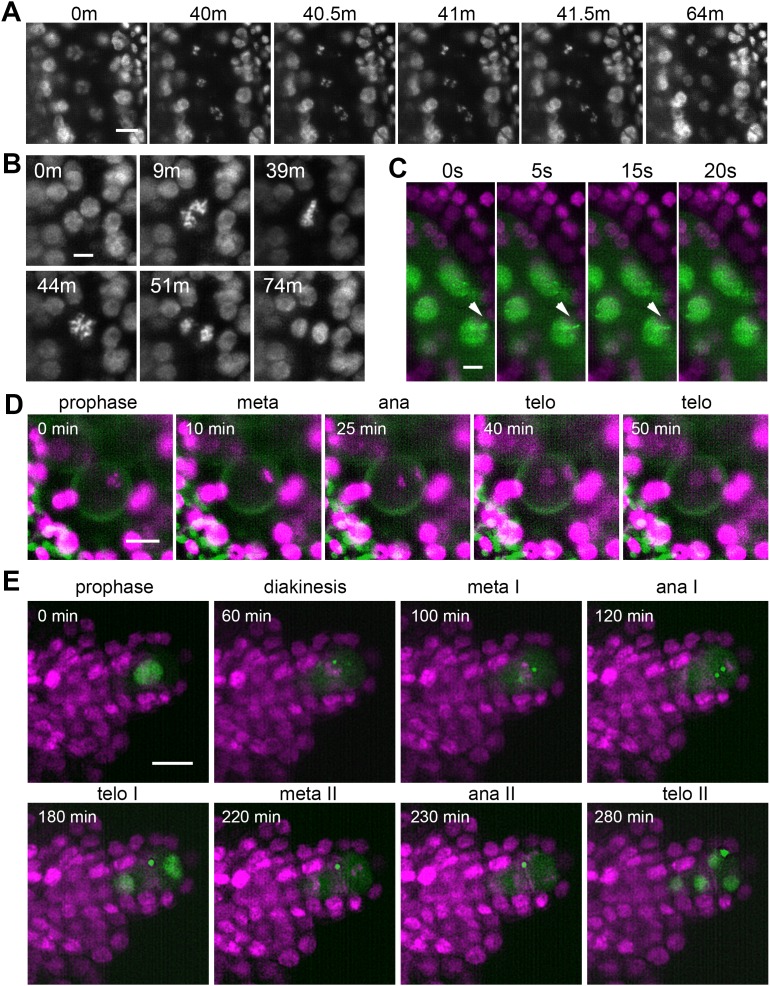
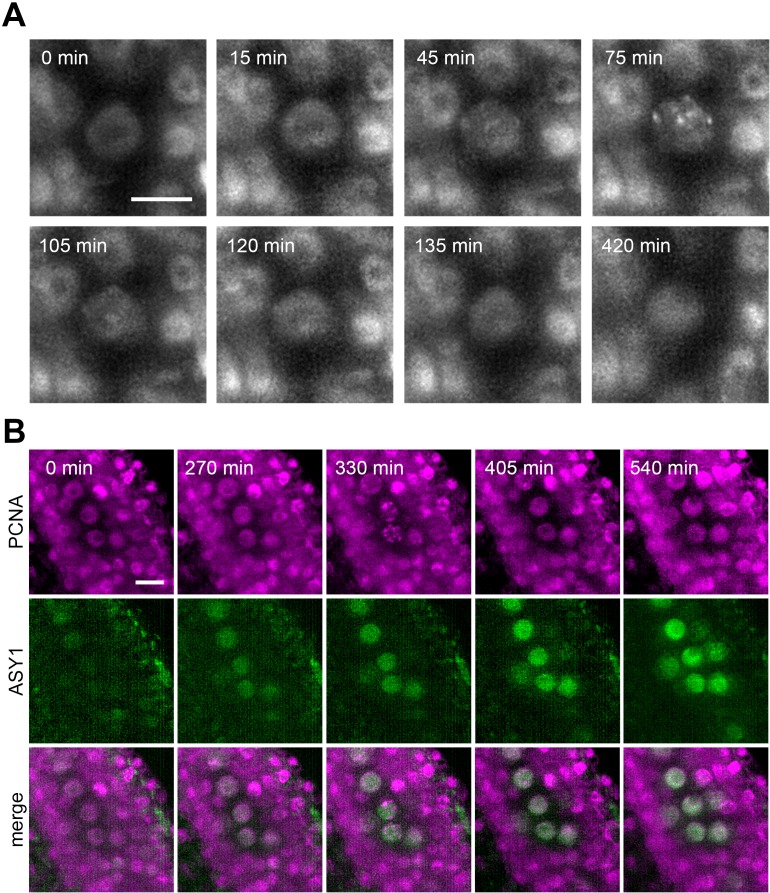
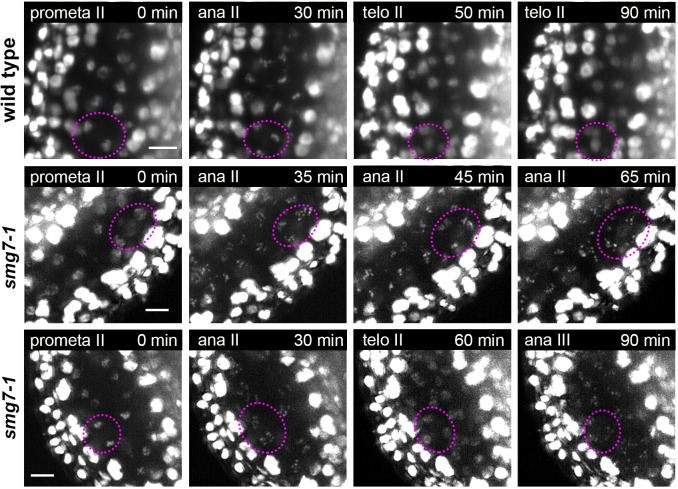
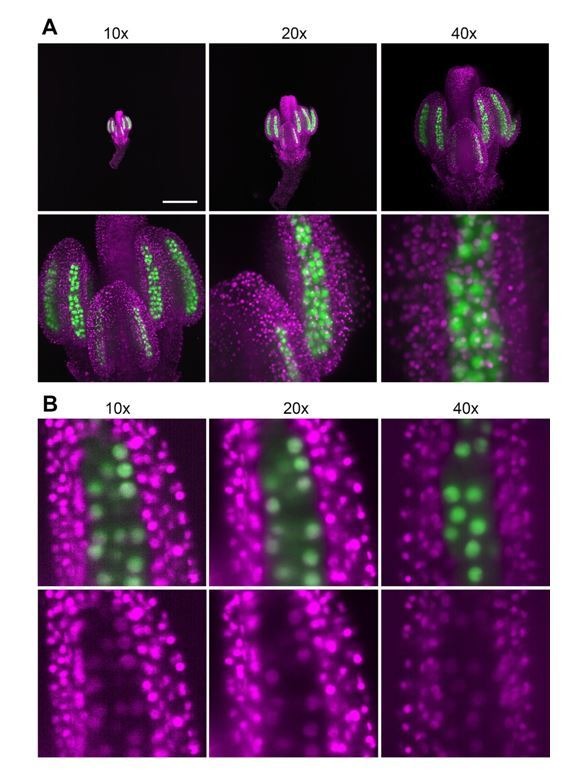
In higher plants, germline differentiation occurs during a relatively short period within developing flowers. Understanding of the mechanisms that govern germline differentiation lags behind other plant developmental processes. This is largely because the germline is restricted to relatively few cells buried deep within floral tissues, which makes them difficult to study. To overcome this limitation, we have developed a methodology for live imaging of the germ cell lineage within floral organs of Arabidopsis using light sheet fluorescence microscopy. We have established reporter lines, cultivation conditions, and imaging protocols for high-resolution microscopy of developing flowers continuously for up to several days. We used multiview imagining to reconstruct a three-dimensional model of a flower at subcellular resolution. We demonstrate the power of this approach by capturing male and female meiosis, asymmetric pollen division, movement of meiotic chromosomes, and unusual restitution mitosis in tapetum cells. This method will enable new avenues of research into plant sexual reproduction.

Keywords: A. thaliana; SPIM; cell biology; flower; germline; light sheet microscopy; live cell imaging; meiosis; plant biology.


Conflict of interest statement

SV, PM, JP, JK, MK, PB, SH, PT, KR No competing interests declared

Figures

Figure 1.
Figure 1.. Imaging Arabidopsis flower using LSFM.
(A) Workflow of sample preparation. (B) Maximum intensity projections (MIPs) of micrographs of HTA10:RFP flowers dissected from buds of the indicated sizes (upper panel, scale bar 200 µm). A detailed image of a single anther lobe with PMCs and microspores is shown in the lower panel (scale bar 10 µm). HTA10:RFP in magenta, 488 nm autofluorescence in green. (C) Examples of additional meiotic stages. Scale bar 10 µm. (D) Distribution of meiotic stages from premeiosis/leptotene to microspores with laterally located nuclei in floral buds of different sizes. One long anther (La) and one short anther (Sa) were analyzed from each floral bud. The frequency of different meiotic stages was estimated from 15 buds of the same width.
Figure 1—figure supplement 1.
Figure 1—figure supplement 1.. Growth dynamics of a floral bud.
(A) Time lapse images of a single floral bud (marked with black) growing on a wild type plant. Scale bar 300 µm. (B) Quantification of the growth rate of Arabidopsis floral buds. The width of continuously growing floral buds was recorded in 12 hr intervals. Error bars represent standard deviations of 10 buds on 10 independent plants. Only floral buds emerging from the main inflorescence bolt between the 10th to 20th position from the first flower were used in the analysis.
Figure 2.
Figure 2.. The 3D reconstruction of Arabidopsis flower from multiview imaging.
(A) MIPs of a 0.5 mm floral bud expressing ASY1:eYFP (green) and H2B:mRuby2 (magenta) viewed from eight different angles. Scale bar 200 µm. (B,C) Imaris MIP of 3D reconstructed flower. Longitudinal (D) and transversal (E) sections of the 3D reconstructed flower. (F) Surface rendered 3D model of the flower with indicated PMCs. (G) MIP of PMCs from the 3D model. Automated detection of PMCs using Imaris spot detection in one anther lobe is shown (41 PMCs were counted).
Figure 3.
Figure 3.. Time lapse imaging of a growing flower.
(A) MIPs of a flower (upper panel) expressing ASY1:eYFP (green) and H2B:mRuby2 (magenta) and one of its anther lobes (bottom panel) at indicated time points (scale bar 100 µm). (B) Detailed view of the distribution of ASY1 signal in developing PMCs. Scale bar 20 µm. Arrowheads indicate ASY1 speckles.
Figure 3—figure supplement 1.
Figure 3—figure supplement 1.. Development of a floral bud in the closed capillary.
(A) A 0.3 mm floral bud from the HTA10:RFP reporter line was embedded in media with low melting point agarose within the closed FEP/capillary system and imaged at time point 0 (MIP, upper panel; lower panel: detail of one anther). The bud was imaged again after 96 hr of cultivation in the dark at 21°C. Scale bars 100 µm. (B) A 0.3 mm bud from the HTA10:RFP reporter line was placed into the closed FEP/capillary system and imaged continuously every 1 hr. Time points 0 hr, 60 hr (onset of first meiotic division) and 96 hr were selected to compare developmental progression under regular laser illumination (MIP upper panel; lower panel: detail of one anther). Scale bars 100 µm. (C) Gantt chart depicting the developmental progression of anthers cultivated in closed capillaries. C 01–04 are four independent flowers grown outside of the microscope and imaged only at the beginning and the end of the experiment. Colors of rectangles indicate the most prominent stage of pollen development in individual anther lobes. The experiment was started with eight individual lobes (indicated by numbers 1–8), but not all of them could be scored due to technical reasons at the end of the experiment. Anther lobes that could not be scored at 96 hr are in white. S01, 03, and 04 depict the development of continuously imaged floral buds. S01 is a bud from the HTA10:RFP line, S03 and S04 from the H2B:mRuby2 ASY1:YFP line. Abbreviations: premeio. – a premeiotic stage; lepto. – leptotene, dia. – diakinesis, micro. cent. – microspore with a centrally localized nucleus. Data interpretation: In this experiment we cultivated floral buds in the closed capillary for 96 hr. Within this time, PMCs developed from the premeiotic stage to tetrads and microscpores with centrally localized nuclei. Staging of floral buds showed that tetrads and microspores with the centrally localized nuclei are prevalent in 0.6 mm floral buds grown on plants (Figure 1D). The growth dynamics experiment in Figure 1—figure supplement 1B shows that on plant, floral bud grows from the size of 0.3 mm to 0.6 mm approximately 84 hr. Thus, floral buds grown on plants and in the capillary reach the same developmental stage after 84 hr and 96 hr, respectively, indicating that cultivation in capillary leads to only a slight delay in anther development. Furthermore, there is no major difference in the development of floral buds that are continuously imaged (S01, S03, and S04) and the controls grown in capillaries outside the microscope (C01-04). Thus, phototoxicity is negligible during continuous imaging.
Figure 4.
Figure 4.. Spatiotemporal distribution of auxin response in flower.
(A) MIPs of DR5::N7-Venus signal of four different flower buds of different sizes. Scale bar 200 µm. (B) Time lapse imaging of a flower at developmental stage 12 expressing DR5::N7-Venus in 2 hr intervals (upper panel). Scale bar 300 µm. Lower panel: detail of a loculus showing release of the nuclear content into the cytoplasm between 40 and 42 hr. Scale bar 50 µm. Non-linear transformation by gamma was used to enhance the outline of the flower.
Figure 5.
Figure 5.. Time lapse imaging of subcellular processes within the flower.
(A) Chromosome segregation in meiosis I from diakinesis (0 m) to telophase I (64 m) visualized with the HTA10:RFP marker. Images were taken every 30 s, scale bar 10 µm. (B) Restitution mitosis in tapetum cells. Images were taken every 60 s, scale bar 5 µm. (C) Rapid chromosome movements in zygotene. Chromatin axes are visualized with ASY1:eYFP (green), somatic nuclei with H2B:mRuby2 (magenta). Arrowhead points to a chromatin axis that moves within the indicated interval. Images were taken every 5 s, scale bar 5 µm. (D) Asymmetric pollen mitosis I. Chromatin is visualized with HTA10:RFP (magenta), 488 nm autofluorescence highlights the pollen wall (green). Images were taken every 5 min, scale bar 10 µm. (E) Female meiosis. MMC is marked with ASY1:eYFP (green), chromatin with HTA10:RFP (magenta). Images were taken every 10 min, scale bar 10 µm.
Figure 6.
Figure 6.. Protein localization in meiotic S-phase.
(A) Time lapse imaging of PCNA:TagRFP during meiotic S-phase. Nuclear speckles are visible between 45 to 120 min. Images were taken every 15 min, scale bar 10 µm. (B) Time lapse imaging of PCNA:TagRFP (magenta) and ASY1:eYFP (green) in PMCs. Timeframe ranges from the first appearance of ASY1 signal prior to S-phase (0 min) to late leptotene/zygotene (540 min). Images were taken every 15 min, scale bar 10 µm.
Figure 7.
Figure 7.. Time lapse imaging of meiosis II in smg7-1 mutants.
Time point 0 min corresponds to prometaphase II when chromosomes start condensing. Middle panel depicts PMCs in smg7-1 PMCs arrested in aberrant anaphase II. Lower panel shows smg7-1 PMCs that undergo brief telophase II before re-condensing again. Chromosomes were marked with HTA10:RFP. Images were taken every 5 min, scale bar 10 µm. Chromosomes within one PMC are indicated by dotted ovals.
Author response image 1.
Author response image 1.. Comparison of different objectives and zooming options.
(A) Field of view when using objectives without zoom (0.36 zoom, upper panel) and with maximal zoom (2.5 zoom, lower panel). ASY1:YFP HTA10:RFP flowers were used in the experiment. (B) Comparison of resolution on 80x80um ROI between the objectives with the maximal zoom. ASY1:GFP merged with HTA10:RFP in upper panel, HTA10:RFP only is shown in lower panel.

Comment in

Similar articles

Cited by

References

    1. Armstrong SJ, Caryl AP, Jones GH, Franklin FC. Asy1, a protein required for meiotic chromosome Synapsis, localizes to axis-associated chromatin in Arabidopsis and Brassica. Journal of Cell Science. 2002;115:3645–3655. doi: 10.1242/jcs.00048. - DOI - PubMed
    1. Armstrong SJ, Franklin FCH, Jones GH. A meiotic time-course for Arabidopsis thaliana. Sexual Plant Reproduction. 2003;16:141–149. doi: 10.1007/s00497-003-0186-4. - DOI
    1. Bassel GW, Smith RS. Quantifying morphogenesis in plants in 4D. Current Opinion in Plant Biology. 2016;29:87–94. doi: 10.1016/j.pbi.2015.11.005. - DOI - PubMed
    1. Blitzblau HG, Chan CS, Hochwagen A, Bell SP. Separation of DNA replication from the assembly of break-competent meiotic chromosomes. PLOS Genetics. 2012;8:e1002643. doi: 10.1371/journal.pgen.1002643. - DOI - PMC - PubMed
    1. Capitao C, Shukla N, Wandrolova A, Mittelsten Scheid O, Riha K. Functional characterization of SMG7 paralogs in Arabidopsis thaliana. Frontiers in Plant Science. 2018;9:1602. doi: 10.3389/fpls.2018.01602. - DOI - PMC - PubMed

Publication types