. 2020 Feb 11:9:e51507.
doi: 10.7554/eLife.51507.

Longitudinal trajectories, correlations and mortality associations of nine biological ages across 20-years follow-up

Affiliations

Longitudinal trajectories, correlations and mortality associations of nine biological ages across 20-years follow-up

Xia Li et al. Elife. .

Abstract

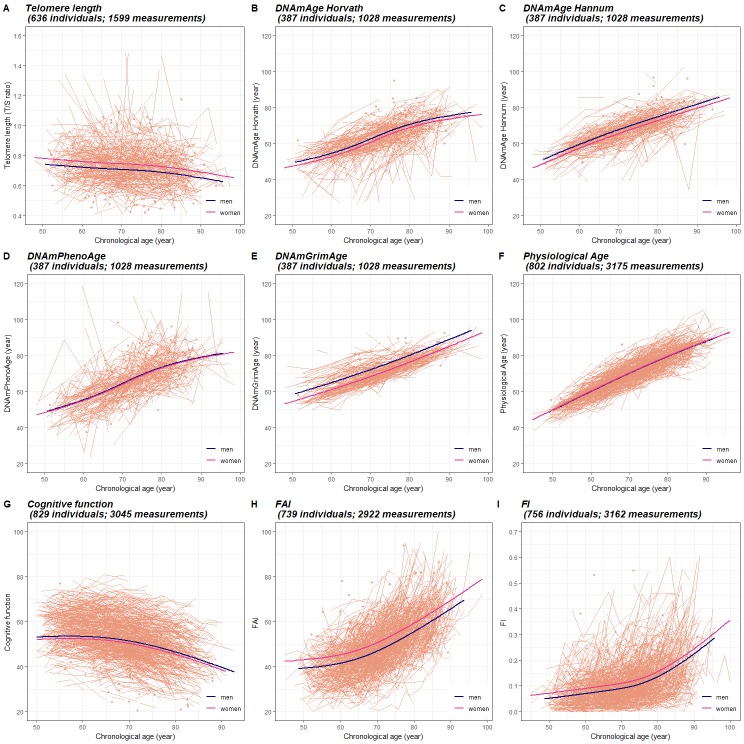
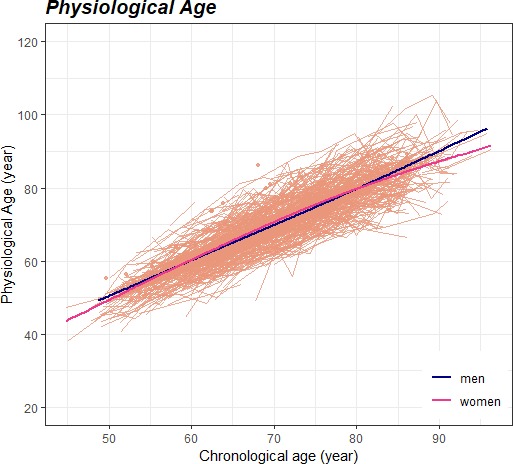
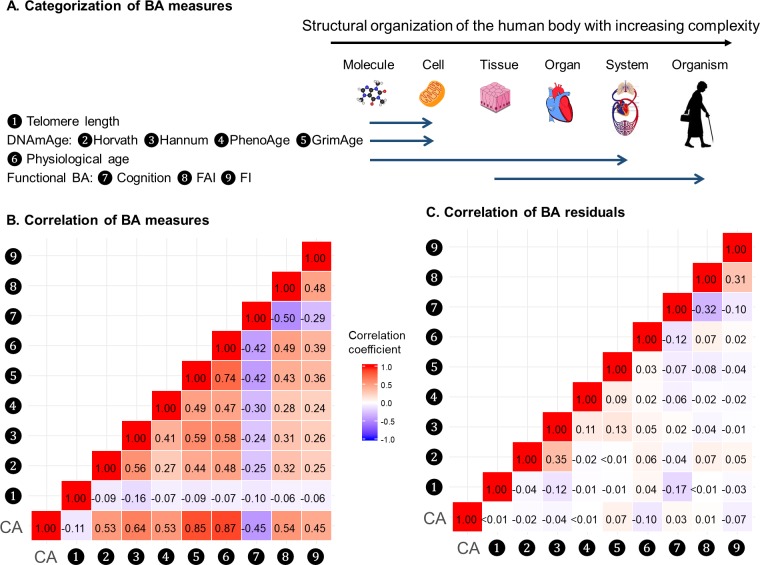
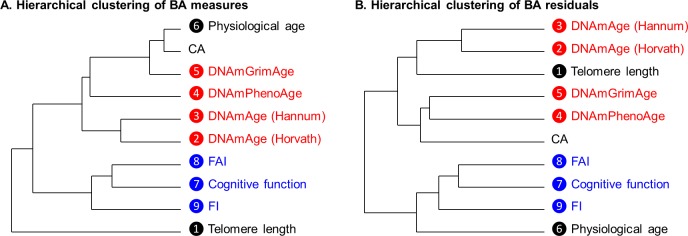
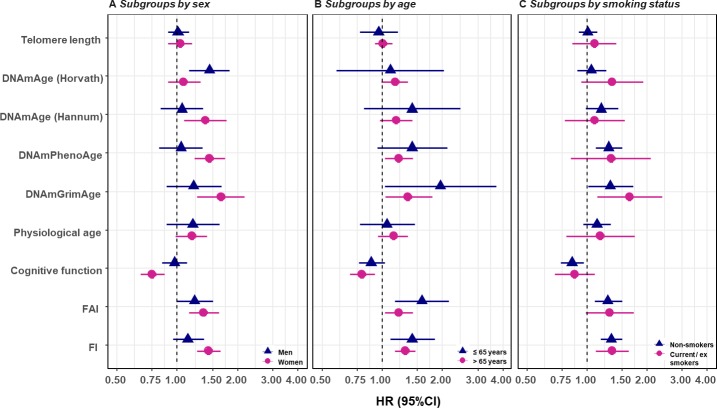
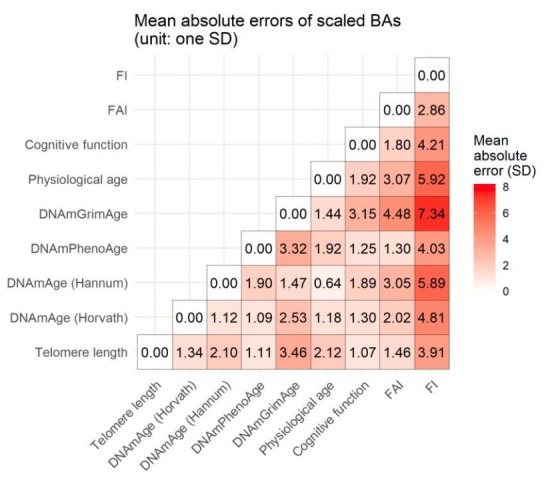
Biological age measurements (BAs) assess aging-related physiological change and predict health risks among individuals of the same chronological age (CA). Multiple BAs have been proposed and are well studied individually but not jointly. We included 845 individuals and 3973 repeated measurements from a Swedish population-based cohort and examined longitudinal trajectories, correlations, and mortality associations of nine BAs across 20 years follow-up. We found the longitudinal growth of functional BAs accelerated around age 70; average levels of BA curves differed by sex across the age span (50-90 years). All BAs were correlated to varying degrees; correlations were mostly explained by CA. Individually, all BAs except for telomere length were associated with mortality risk independently of CA. The largest effects were seen for methylation age estimators (GrimAge) and the frailty index (FI). In joint models, two methylation age estimators (Horvath and GrimAge) and FI remained predictive, suggesting they are complementary in predicting mortality.

Keywords: aging; biological age; correlation; epidemiology; global health; human; longitudinal trajectory; mortality.

Plain language summary

Everyone ages, but how aging affects health varies from person to person. This means that how old someone seems or feels does not always match the number of years they have been alive; in other words, someone’s “biological age” can often differ from their “chronological age”. Scientists are now looking at the physiological changes related to aging to better predict who is at the greatest risk of age-related health problems. Several measurements of biological age have been put forward to capture information about various age-related changes. For example, some measurements look at changes to DNA molecules, while others measure signs of frailty, or deterioration in cognitive or physical abilities. However, to date, most studies into measures of biological age have looked at them individually and less is known about how these physiological changes interact, which is likely to be important. Now, Li et al. have looked at data on nine different measures of biological age in a group of 845 Swedish adults, aged between 50 and 90, that was collected several times over a follow-up period of about 20 years. The dataset also gave details of the individuals’ birth year, sex, height, weight, smoking status, and education. The year of death was also collected from national registers for all individual in the group who had since died. Li et al. found that all nine biological age measures could be used to explain the risk of individuals in the group dying during the follow-up period. In other words, when comparing individuals with the same chronological age in the group under study, the person with a higher biological age measure was more likely to die earlier. The analysis also revealed that biological aging appears to accelerate as individuals approach 70 years old, and that there are noticeable differences in the aging process between men and women. Lastly, when combining all nine biological age measures, some of them worked better than others. Measurements of methylation groups added to DNA (known as DNA methylation age) and frailty (the frailty index) led to improved predictions for an individual’s risk of death. Ultimately, if future studies confirm these results for measures from single individuals, DNA methylation and the frailty index may be used to help identify people who may benefit the most from interventions to prevent age-related health conditions.


Conflict of interest statement

XL, AP, YW, PM, CR, DF, NP, JJ, SH No competing interests declared

Figures

Figure 1.
Figure 1.. Longitudinal trajectories of BAs in 845 individuals (3973 measurements) with information on at least one BA.
A total of 3973 repeated measurements assessed from 845 individuals were included to estimate the longitudinal trajectories of BAs. For each BA estimation, the numbers of available individuals and measurements varied and were specified in the heading of each panel. Longitudinal changes in BAs were modeled as functions of CA (as a natural spline with three degrees of freedom) and sex, with random effects at the individual and twin-pair levels (mixed models). Both individual-level BAs and population BA means over CA in men and women are presented in Panel (A-I). BA measurements were presented as orange dots, lines or broken lines when one, two, or more than two measurements were assessed for a given individual. Average changes of BAs with age in the study population were indicated by smooth lines (blue for men and pink for women). The longitudinal growth of the three functional BAs (cognitive function, FAI, and FI) show an accelerated rate of change around the age of 70 (Panel J-I), whereas the other BAs exhibit relatively linear trajecotries over the age span (Panel A-F). BA, biological age; DNAmAge, DNA methylation age estimator; FAI, functional aging index; FI, frailty index.
Figure 1—figure supplement 1.
Figure 1—figure supplement 1.. Longitudinal trajectory of physiological age with sex interaction term introduced to the mixed model.
A total of 3175 repeated measurements assessed from 802 individuals were included to estimate the longitudinal trajectory of physiological age. Longitudinal changes in BAs were modeled as functions of CA (as a natural spline with three degrees of freedom), sex, and a multiplicative interaction term of CA and sex, with random effects at the individual and twin-pair levels (mixed models). Both individual-level BA and population BA means over CA in men and women are presented. Measurements of physiological age were presented as orange dots, lines or broken lines when one, two, or more than two measurements were assessed for a given individual. Average changes of BA with age in the study population were indicated by smooth lines (blue for men and pink for women). The shape of the physiological age curve differed between men and women (p<0.001 for sex interaction). However, the difference was mainly observed at the end of the CA spectrum (i.e., before the age of 50 and after the age of 85).
Figure 2.
Figure 2.. Correlations of BAs in 288 individuals (612 complete measurements).
A total of 612 complete measurements assessed from 288 individuals were included to estimate the correlations of BAs. BAs were broadly categorized into four groups according to the main biological structural levels where the BA measurements were implemented (Panel A). We estimated the repeated-measure correlation coefficients between BAs and between BA residuals and illustrated the correlation coefficients in heat maps (Panel B-C). Red and blue tiles represented positive and negative correlations, respectively; color density indicated the magnitude of correlation coefficients. All BAs were correlated to varying degrees (Panel B). After regressing out CA from BAs, most of the original correlations were attenuated (Panel C). BA, biological age; DNAmAge, DNA methylation age estimator; FAI, functional aging index; FI, frailty index; CA, chronological age.
Figure 2—figure supplement 1.
Figure 2—figure supplement 1.. Hierarchical clustering of BA in 288 individuals (612 complete measurements).
A total of 612 complete measurements assessed from 288 individuals were included. We transformed correlation coefficients into Euclidean distances and then performed hierarchical cluster analysis, illustrated in the dendrograms. Four types of DNAmAges and three types of functional BAs were presented in the color of red and blue, respectively. The same types of BAs, that is methylation BAs and functional BAs, tended to be more closely related. GrimAge and PhenoAge, however, were somewhat separated from the other two DNAmAges, especially using BA residuals.
Figure 3.
Figure 3.. Survival analyses of baseline BAs with the risk of all-cause mortality in subgroups classified by sex, baseline smoking status, and baseline age (one-BA models).
A total of 845 individuals were included to estimate the mortality associations of BAs in subgroups. The numbers of individuals in each subgroups were specified in the Supplementary file 1G–I. We used Cox regression models to estimate the change in mortality risk associated with a one-SD increment of the respective BA at baseline assessment (one-BA models). All models controlled for sex, educational attainment, smoking status, and BMI, stratified by participants’ birth year, and accounted for left truncation and right censoring. Attained age was used as the time-scale and thus age was inherently adjusted for. BA-mortality associations by were illustrated in the forest plot (Panel A-C), in which points and horizontal lines denoted HRs (95%CIs) and point shapes and colors represented subgroups. The associations of BAs with mortality risk were generally stronger in women (except for Horvath DNAmAge and physiological age), more pronounced in the younger individuals (except for Horvath DNAmAge, physiological age and cognitive function), and a bit stronger in current or ex- smokers (for Horvath DNAmAge and DNAmGrimAge). BA, biological age; DNAmAge, DNA methylation age estimator; FAI, functional aging index; FI, frailty index; CA, chronological age; HRs (95%CIs), hazard Ratio (95% Confidence Interval).
Author response image 1.
Author response image 1.. Mean absolute errors of BA pairs.

Comment in

Similar articles

Cited by

References

    1. Bakdash JZ, Marusich LR. Repeated measures correlation. Frontiers in Psychology. 2017;8:456. doi: 10.3389/fpsyg.2017.00456. - DOI - PMC - PubMed
    1. Bartley MM, Geda YE, Christianson TJ, Pankratz VS, Roberts RO, Petersen RC. Frailty and mortality outcomes in cognitively normal older people: sex differences in a Population-Based study. Journal of the American Geriatrics Society. 2016;64:132–137. doi: 10.1111/jgs.13821. - DOI - PMC - PubMed
    1. Belsky DW, Moffitt TE, Cohen AA, Corcoran DL, Levine ME, Prinz JA, Schaefer J, Sugden K, Williams B, Poulton R, Caspi A. Eleven telomere, epigenetic clock and Biomarker-Composite Quantifications of Biological Aging: Do They Measure the Same Thing? American Journal of Epidemiology. 2018;187:1220–1230. doi: 10.1093/aje/kwx346. - DOI - PMC - PubMed
    1. Berglund K, Reynolds CA, Ploner A, Gerritsen L, Hovatta I, Pedersen NL, Hägg S. Longitudinal decline of leukocyte telomere length in old age and the association with sex and genetic risk. Aging. 2016;8:1398–1415. doi: 10.18632/aging.100995. - DOI - PMC - PubMed
    1. Finkel D, Sternäng O, Jylhävä J, Bai G, Pedersen NL. Functional aging index complements frailty in prediction of entry into care and mortality. The Journals of Gerontology: Series A. 2019;74:1980–1986. doi: 10.1093/gerona/glz155. - DOI - PMC - PubMed

Publication types