

doi: 10.1534/g3.119.400864.
LongQC: A Quality Control Tool for Third Generation Sequencing Long Read Data
Affiliations
- PMID: 32041730
- PMCID: PMC7144081
- DOI: 10.1534/g3.119.400864
Item in Clipboard
LongQC: A Quality Control Tool for Third Generation Sequencing Long Read Data
G3 (Bethesda).
.
Erratum in
-
CORRIGENDUM.G3 (Bethesda). 2020 Nov 5;10(11):4295. doi: 10.1534/g3.120.401778. G3 (Bethesda). 2020. PMID: 33154025 Free PMC article. No abstract available.
Abstract
We propose LongQC as an easy and automated quality control tool for genomic datasets generated by third generation sequencing (TGS) technologies such as Oxford Nanopore technologies (ONT) and SMRT sequencing from Pacific Bioscience (PacBio). Key statistics were optimized for long read data, and LongQC covers all major TGS platforms. LongQC processes and visualizes those statistics automatically and quickly.
Keywords: Long read; Oxford Nanopore; PacBio; Quality control; third generation sequencers.
Copyright © 2020 Fukasawa et al.
Figures
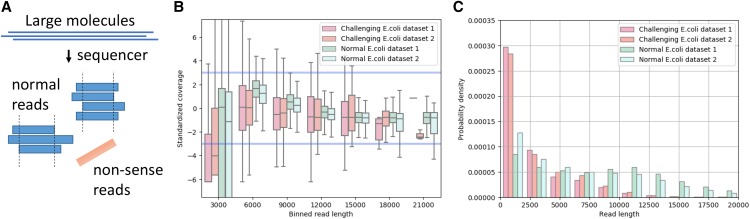
Schematic diagram of non-sense reads and example plots for E.coli genome. (A) Blue rectangles represent normal read derived from large molecules such as genomic DNA and orange rectangle shows non-sense read. Non-sense reads have no coverage due to randomness or an even higher error rate. (B) whisker plots for standardized per-read coverage in two challenging and two normal datasets. Standardized per-read coverage is centered by mean of per-read coverage values and divided by standard deviation of per-read coverage values. Blue lines represent 3 standard deviations. (C) read length histograms for the same datasets.
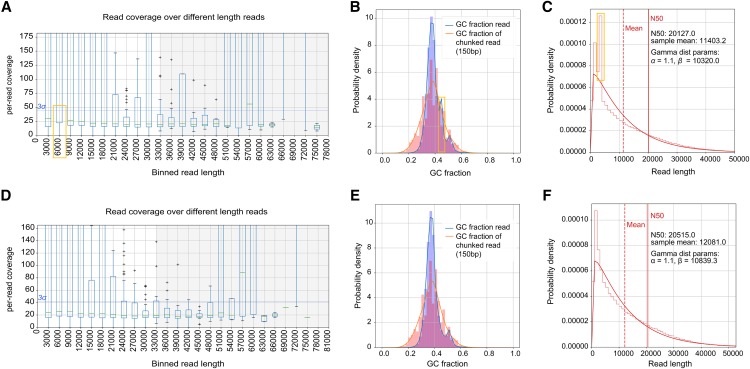
Effects of E. coli filter on ONT A. thaliana dataset. Top panels were generated from the original dataset and bottom panels show plots after E. coli read removal. (A, D) Distribution of per-read coverage. (B, E) GC content distributions. (C, F) Length distributions. Yellow boxes highlighted the spikes that disappeared after E. coli read removal.
References
Publication types
MeSH terms
LinkOut - more resources
Full Text Sources
Other Literature Sources