. 2020 Mar 5;7(2):ENEURO.0420-19.2020.
doi: 10.1523/ENEURO.0420-19.2020. Print 2020 Mar/Apr.

Corticotropin-Releasing Factor Receptor-1 Neurons in the Lateral Amygdala Display Selective Sensitivity to Acute and Chronic Ethanol Exposure

Affiliations

Corticotropin-Releasing Factor Receptor-1 Neurons in the Lateral Amygdala Display Selective Sensitivity to Acute and Chronic Ethanol Exposure

Abigail E Agoglia et al. eNeuro. .

Abstract

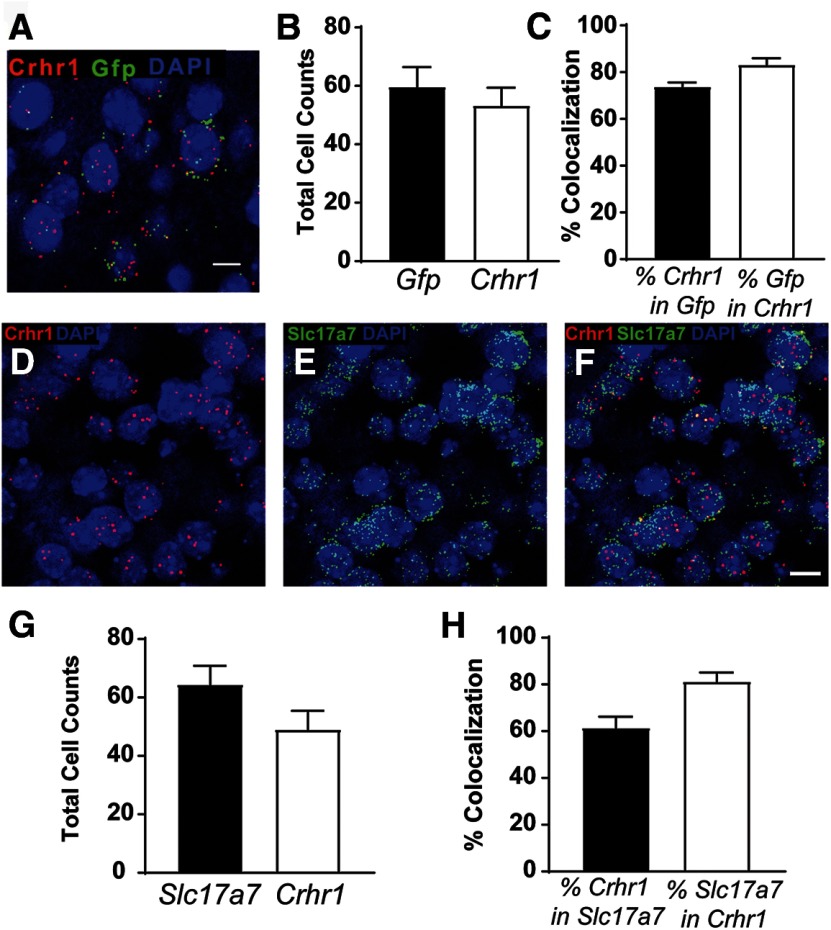
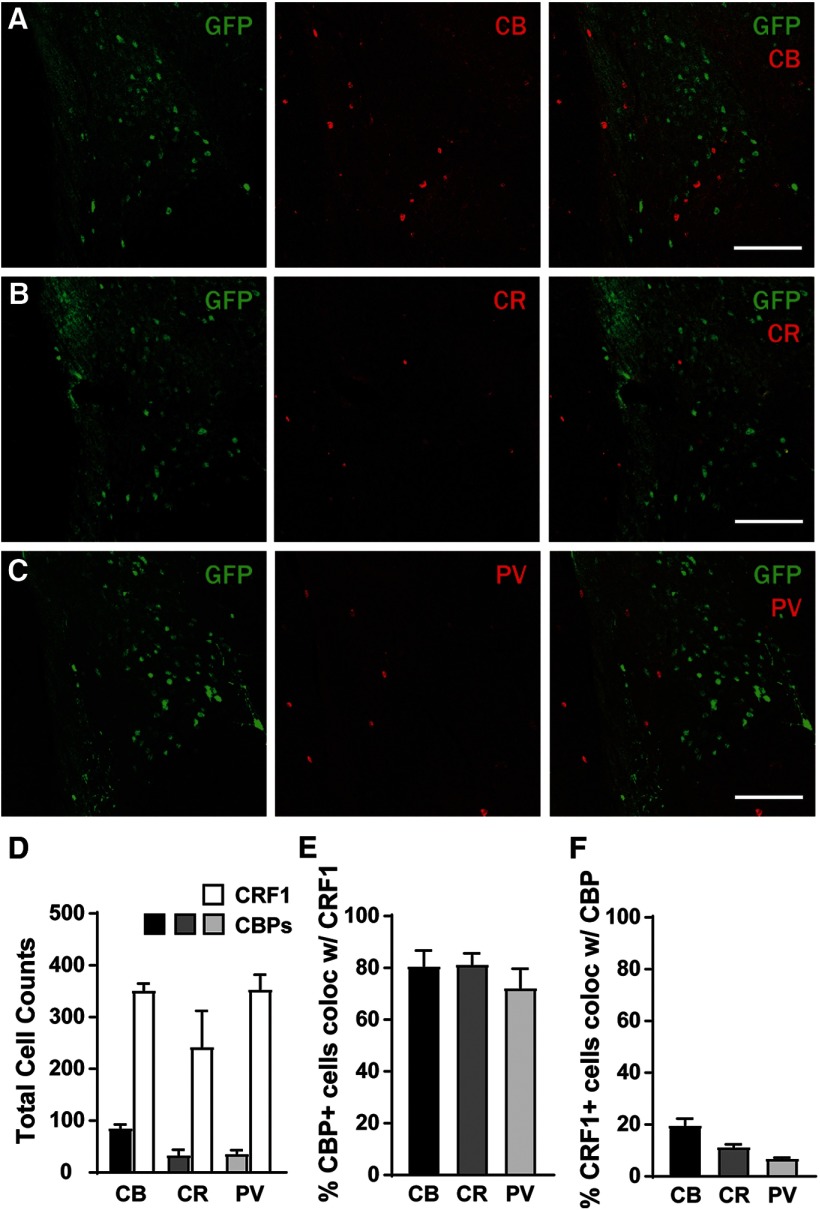
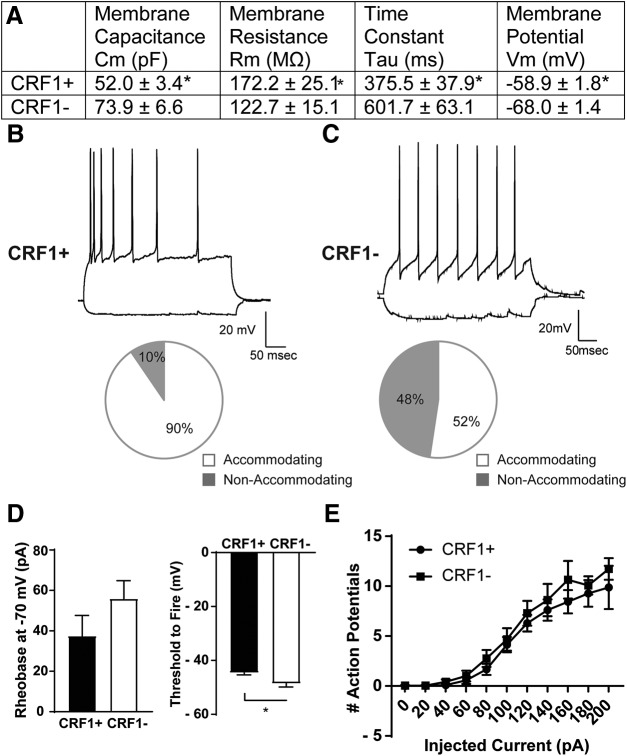
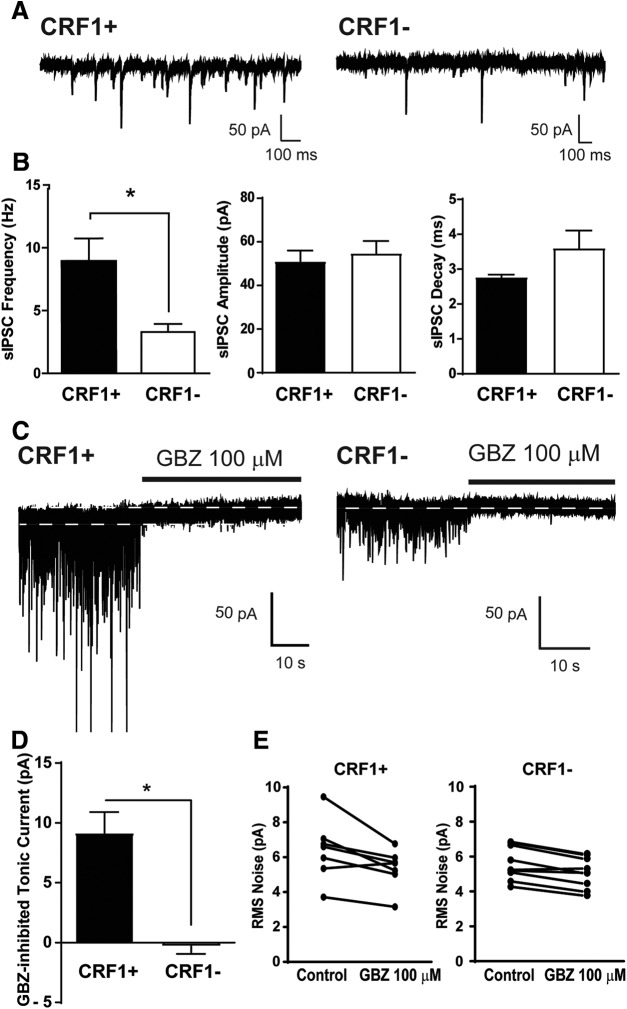
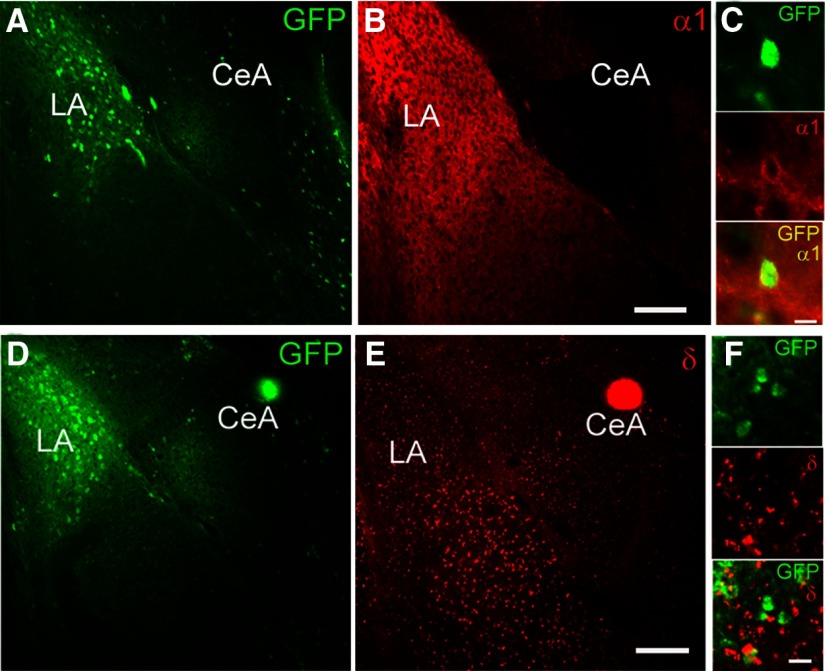
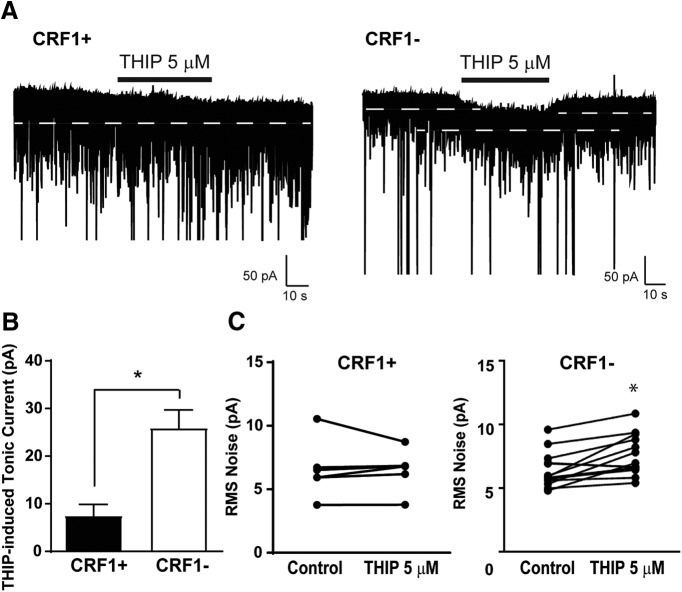
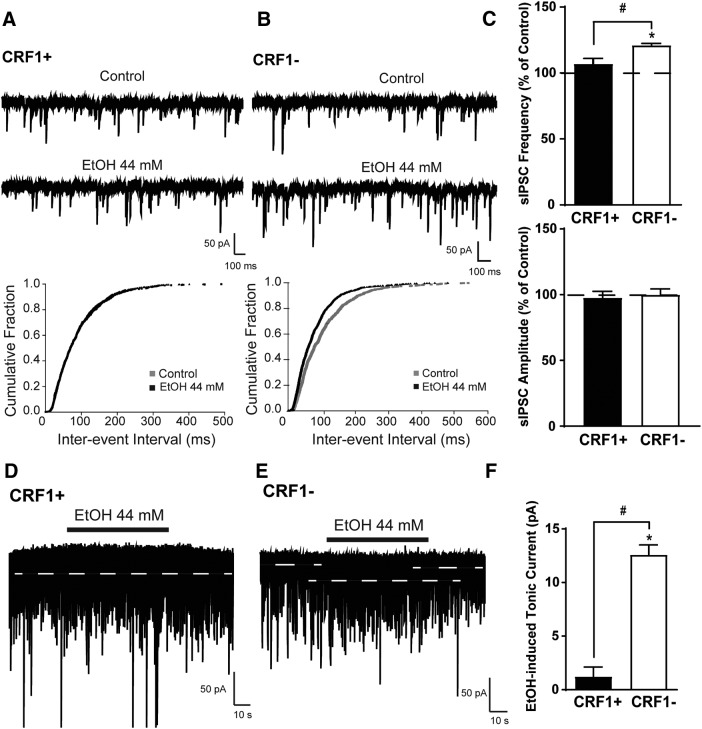
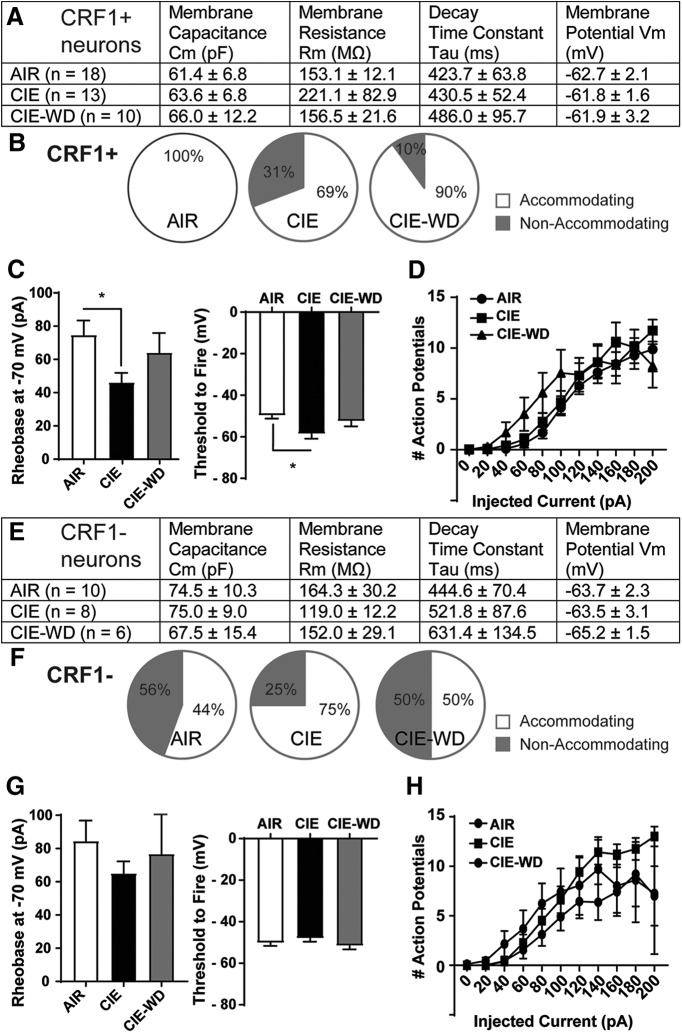
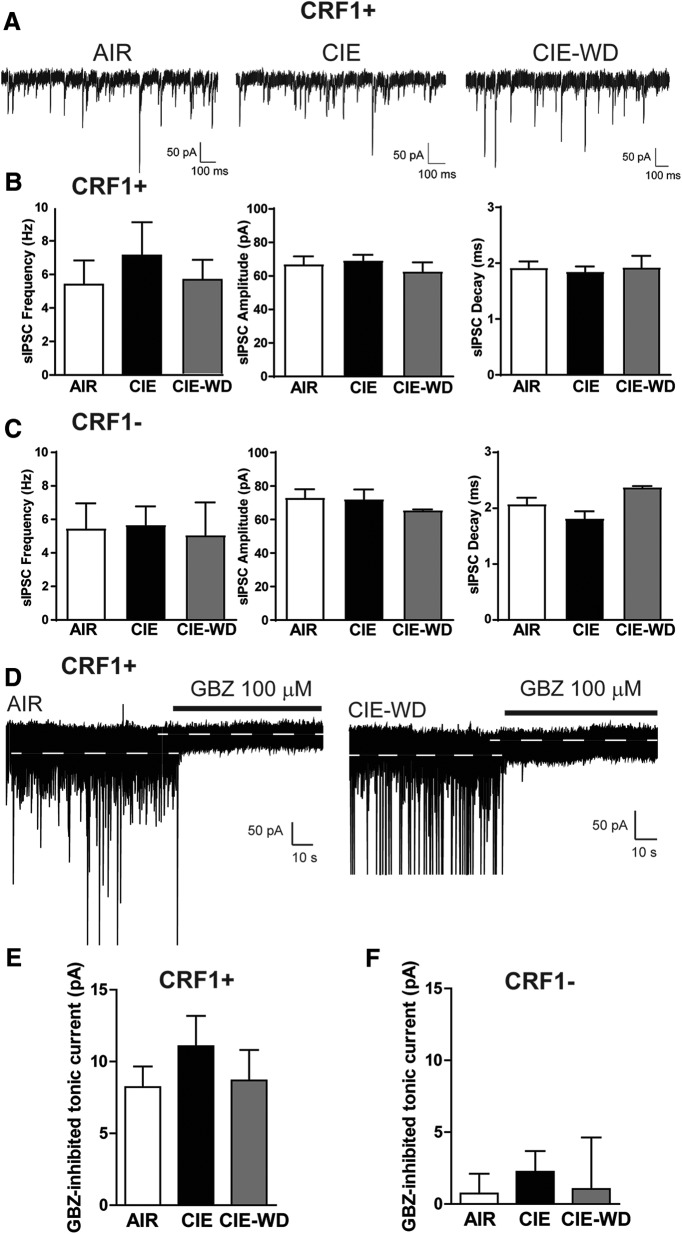
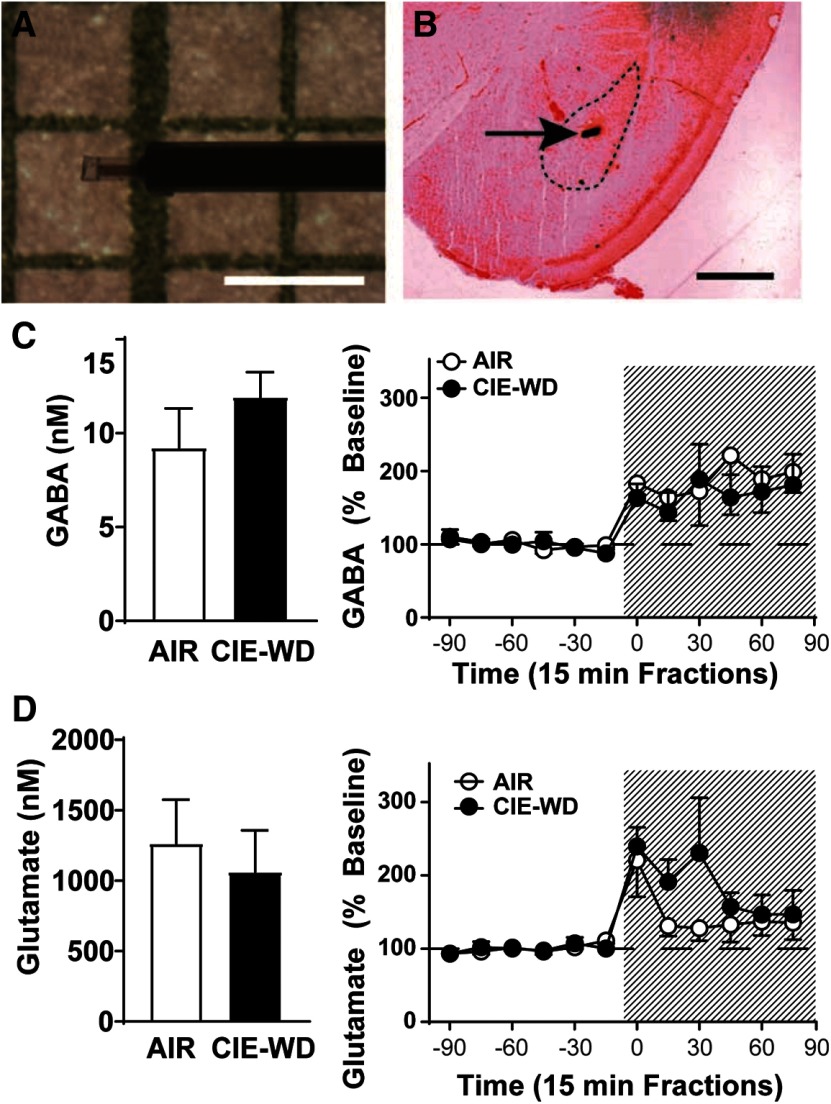
The lateral amygdala (LA) serves as the point of entry for sensory information within the amygdala complex, a structure that plays a critical role in emotional processes and has been implicated in alcohol use disorders. Within the amygdala, the corticotropin-releasing factor (CRF) system has been shown to mediate some of the effects of both stress and ethanol, but the effects of ethanol on specific CRF1 receptor circuits in the amygdala have not been fully established. We used male CRF1:GFP reporter mice to characterize CRF1-expressing (CRF1+) and nonexpressing (CRF1-) LA neurons and investigate the effects of acute and chronic ethanol exposure on these populations. The CRF1+ population was found to be composed predominantly of glutamatergic projection neurons with a minority subpopulation of interneurons. CRF1+ neurons exhibited a tonic conductance that was insensitive to acute ethanol. CRF1- neurons did not display a basal tonic conductance, but the application of acute ethanol induced a δ GABAA receptor subunit-dependent tonic conductance and enhanced phasic GABA release onto these cells. Chronic ethanol increased CRF1+ neuronal excitability but did not significantly alter phasic or tonic GABA signaling in either CRF1+ or CRF1- cells. Chronic ethanol and withdrawal also did not alter basal extracellular GABA or glutamate transmitter levels in the LA/BLA and did not alter the sensitivity of GABA or glutamate to acute ethanol-induced increases in transmitter release. Together, these results provide the first characterization of the CRF1+ population of LA neurons and suggest mechanisms for differential acute ethanol sensitivity within this region.

Keywords: CRF; CRF1 receptor; GABA; alcohol; basolateral amygdala; lateral amygdala.


Figures

Figure 1.
Figure 1.
Glutamate transporter expression in CRF1 lateral amygdala neurons. A, Representative merged image showing Crhr1, Gfp, and DAPI in the LA. Scale bar, 10 μm. B, Summary of the total number of Gfp+ and Crhr1+ nuclei in the ROI (1024 × 1024; 40×) in the LA of 11 images from 3 mice. C, Graph of the percentage of nuclei coexpressing Crhr1 in Gfp+ nuclei (black bar), and the percentage of nuclei coexpressing Gfp in Crhr1+ nuclei (white bar). D–F, Representative images in the LA are shown for Crhr1 and DAPI (D); Slc17a7 and DAPI (E); and the merged imaged of Crhr1, Slc17a7, and DAPI (F; Crhr1 =red fluorescence, Slc17a7 =green fluorescence, and DAPI = blue fluorescence). Scale bar, 10 μm. G, Summary of the total number of Crhr1+ and Slc17a7+ nuclei in the ROI (1024 × 1024; 40×) in the LA of 10 images from 3 CRF1:GFP mice. H, Graph of the percent of nuclei coexpressing Crhr1 in Slc17a7+ nuclei (black bar) and nuclei coexpressing Slc17a7 in Crhr1+ (white bar).
Figure 2.
Figure 2.
Calcium binding protein expression in CRF1+ and CRF1 lateral amygdala neurons. A, Photomicrograph (10×) of GFP expression (green fluorescence, left), calbindin expression (red fluorescence, center), and merge (right). Scale bar, 100 μm. B, Photomicrograph (10×) of GFP expression (green fluorescence, left), calretinin expression (red fluorescence, center), and merge (right). Scale bar, 100 μm. C, Photomicrograph (10×) of GFP expression (green fluorescence, left), parvalbumin expression (red fluorescence, middle), and merge (right). Scale bar, 100 μm. D, Summary of total cells expressing CRF1 (GFP) and CBPs, n = 16 sections from 4 mice. E, Percentage of CBP+ cells that coexpress CRF1. F, Percentage of CRF1+ cells that coexpress CBPs.
Figure 3.
Figure 3.
Membrane characteristics and excitability of CRF1+ and CRF1 lateral amygdala neurons. A, Summary of membrane characteristics of CRF1+ (n = 28) and CRF1 (n = 28) LA cells. B, Representative current-clamp recording of LA CRF1+ neuron action potentials elicited by 100 pA current injection (top) and the relative proportion of CRF1+ LA neurons displaying spike accommodation with current injection (bottom). C, Representative current-clamp recording of LA CRF1 neuron action potentials elicited by 100 pA current injection (top) and the relative proportion of CRF1 LA neurons displaying spike accommodation with current injection (bottom). D, Summary of rheobase at −70 mV (left) and the threshold to fire (right) of CRF1+ and CRF1 LA neurons. *p <0.05 by unpaired t test comparing CRF1+ to CRF1 cells. E, Summary of action potentials by current injection in CRF1+ and CRF1 LA neurons.
Figure 4.
Figure 4.
Phasic and tonic inhibitory transmission in CRF1 lateral amygdala neurons. A, Representative voltage-clamp recording of a CRF1+ cell (left) and a CRF1 cell (right). B, Summary of sIPSC frequency (left), amplitude (center), and decay (right) of CRF1+ and CRF1 cells. *p <0.05 by unpaired t test comparing CRF1+ to CRF1− cells. C, Representative voltage-clamp recording of a CRF1+ cell (left) and a CRF1 cell (right) during GBZ superfusion (100 μm). White dashed line indicates level of holding current before and after GBZ superfusion. D, Summary of the tonic current revealed by gabazine. *p <0.05 by unpaired t test comparing CRF1+ to CRF1 cells. E, Summary of the change in rms noise induced by gabazine superfusion in CRF1+ (left) and CRF1 (right) cells.
Figure 5.
Figure 5.
GABAA subunit expression in CRF1+ and CRF1 lateral amygdala neurons. A, Photomicrograph (10×) of GFP expression (green fluorescence) in LA. B, Photomicrograph (10×) of α1 GABAA receptor subunit expression (red fluorescence) in LA. Scale bar, 100 μm. C, Photomicrograph (60×) of GFP expression (top), α1 expression (center), and merge (bottom) in LA highlighting a single cell exhibiting coexpression of GFP and α1. Scale bar, 10 μm. D, Photomicrograph (10×) of GFP expression (green fluorescence) in LA. E, Photomicrograph (10×) of δ GABAA receptor subunit expression (red fluorescence) in LA. Scale bar, 100 μm. F, Photomicrograph (60×) of GFP expression (top), δ expression (center), and merge (bottom) in LA. Scale bar, 10 μm.
Figure 6.
Figure 6.
Contribution of δ subunit-containing GABAA receptors to tonic conductance in CRF1+ and CRF1 lateral amygdala neurons. A, Representative voltage-clamp recording of a CRF1+ (left) and CRF1 (right) cell during superfusion of the δ subunit-preferring GABAA agonist THIP (5 μm). White dashed line indicates level of holding current before and after THIP superfusion. B, Summary of the tonic current induced by THIP in CRF1+ and CRF1 cells; *p <0.05 by unpaired t test comparing CRF1+ to CRF1− cells. C, Summary of the change in rms noise induced by THIP superfusion in CRF1+ (left) and CRF1 (right) cells. *p < 0.05 by paired t test comparing differences between control and THIP 5 μm
Figure 7.
Figure 7.
Effects of acute ethanol exposure on phasic and tonic inhibitory transmission in CRF1+ and CRF1 lateral amygdala neurons. A, Representative voltage-clamp recording (top) and cumulative probability histogram of interevent interval (bottom) of a CRF1+ cell during superfusion of EtOH (44 mm). B, Representative voltage-clamp recording (top) and cumulative probability histogram of interevent interval (bottom) of a CRF1 cell during superfusion of EtOH (44 mm). C, Summary of the change in sIPSC frequency (top) and amplitude (bottom) following ethanol superfusion compared with baseline in CRF1+ and CRF1 cells. *p <0.05 by one-sample t test comparing differences from baseline within cell type; #p <0.05 by unpaired t test comparing CRF1+ to CRF1 cells. D, Representative voltage-clamp recording of a CRF1+ cell during superfusion of EtOH (44 mm). White dashed line indicates the level of holding current before and after EtOH superfusion. E, Representative voltage-clamp recording of a CRF1 cell during superfusion of EtOH (44 mm). White dashed line indicates the level of holding current before and after EtOH superfusion. F, Summary of the tonic current induced by ethanol in CRF1+ and CRF1 cells. *p <0.05 by one-sample t test comparing differences from baseline within cell type; #p <0.05 by unpaired t test comparing CRF1+ to CRF1 cells.
Figure 8.
Figure 8.
Effects of chronic ethanol vapor on membrane characteristics and excitability in CRF1+ and CRF1 lateral amygdala neurons. A, Summary of membrane characteristics of CRF1+ LA neurons from AIR, CIE, and CIE-WD mice. B, Relative proportion of CRF1+ neurons exhibiting spike accommodation from AIR (left), CIE (center), and CIE-WD (right) mice. C, Summary of rheobase at −70 mV (left) and the threshold to fire (right) of CRF1+ neurons from AIR, CIE, and CIE-WD mice. *p <0.05 by unpaired t test comparing CRF1+ neurons from AIR mice to CRF1+ neurons from CIE mice. D, Summary of action potentials by current injection in CRF1+ neurons from AIR, CIE, and CIE-WD mice. E, Summary of membrane characteristics of CRF1 LA neurons from AIR, CIE, and CIE-WD mice. F, Relative proportion of CRF1 neurons exhibiting spike accommodation from AIR (left), CIE (middle), and CIE-WD (right) mice. G, Summary of rheobase at −70 mV (left) and the threshold to fire (right) of CRF1 neurons from AIR, CIE, and CIE-WD mice. H, Summary of action potentials by current injection in CRF1 neurons from AIR, CIE, and CIE-WD mice.
Figure 9.
Figure 9.
Effects of chronic ethanol vapor on phasic and tonic inhibitory transmission in CRF1+ and CRF1 lateral amygdala neurons. A, Representative voltage-clamp recordings of CRF1+ neurons from AIR (left), CIE (center), and CIE-WD (right) mice. B, Summary of sIPSC frequency (left), amplitude (middle), and decay (right) in CRF1+ neurons from AIR, CIE, and CIE-WD mice. C, Summary of sIPSC frequency (left), amplitude (center), and decay (right) in CRF1 neurons from AIR, CIE, and CIE-WD mice. D, Representative voltage-clamp recording of CRF1+ cells from AIR (left) and CIE-WD (right) mice during GBZ superfusion (100 μm). White dashed line indicates the level of holding current before and after GBZ superfusion. E, Summary of tonic current revealed by gabazine superfusion in CRF1+ cells. F, Summary of tonic current revealed by gabazine superfusion in CRF1 cells.
Figure 10.
Figure 10.
Effects of chronic ethanol vapor and withdrawal on exogenous GABA and glutamate concentration and sensitivity to acute ethanol in lateral amygdala/basolateral amygdala. A, Representative microdialysis probe (0.5 mm). Scale bar, 1 mm. B, Histologic verification of probe site. Dashed lines indicate LA/BLA. Scale bar, 1 mm. C, Baseline dialysate concentrations of GABA (nm, left) and percent change in GABAergic transmission over time and following reverse dialysis of ehthanol (1 M, shaded area; right) in the LA/BLA of AIR and CIE-WD mice (n = 4–7). D, Baseline dialysate concentrations of glutamate (nm, left) and percent change in glutamatergic transmission over time and following reverse dialysis of ehthanol (1 M, shaded area; right) in the LA/BLA of AIR and CIE-WD mice (n = 4–7).

Similar articles

Cited by

References

    1. Agoglia AE, Herman MA (2018) The center of the emotional universe: alcohol, stress, and CRF1 amygdala circuitry. Alcohol 72:61–73. 10.1016/j.alcohol.2018.03.009 - DOI - PMC - PubMed
    1. Alexander NJ, Rau AR, Jimenez VA, Daunais JB, Grant KA, McCool BA (2018) SNARE complex-associated proteins in the lateral amygdala of Macaca mulatta following long-term ethanol drinking. Alcohol Clin Exp Res 42:1661–1673. 10.1111/acer.13821 - DOI - PMC - PubMed
    1. Baur R, Kaur KH, Sigel E (2009) Structure of alpha6 beta3 delta GABA(A) receptors and their lack of ethanol sensitivity. J Neurochem 111:1172–1181. 10.1111/j.1471-4159.2009.06387.x - DOI - PubMed
    1. Belelli D, Harrison NL, Maguire J, Macdonald RL, Walker MC, Cope DW (2009) Extrasynaptic GABAA receptors: form, pharmacology, and function. J Neurosci 29:12757–12763. 10.1523/JNEUROSCI.3340-09.2009 - DOI - PMC - PubMed
    1. Borghese CM, Harris RA (2007) Studies of ethanol actions on recombinant delta-containing gamma-aminobutyric acid type A receptors yield contradictory results. Alcohol 41:155–162. 10.1016/j.alcohol.2007.03.006 - DOI - PMC - PubMed

Publication types

Substances