

Porphyromonas gingivalis Cell Wall Components Induce Programmed Death Ligand 1 (PD-L1) Expression on Human Oral Carcinoma Cells by a Receptor-Interacting Protein Kinase 2 (RIP2)-Dependent Mechanism
- PMID: 32041789
- PMCID: PMC7171240
- DOI: 10.1128/IAI.00051-20
Porphyromonas gingivalis Cell Wall Components Induce Programmed Death Ligand 1 (PD-L1) Expression on Human Oral Carcinoma Cells by a Receptor-Interacting Protein Kinase 2 (RIP2)-Dependent Mechanism
Abstract
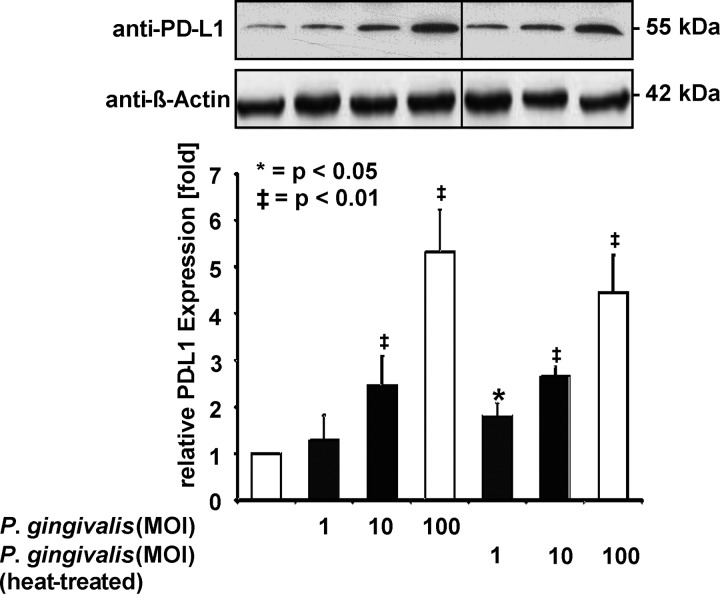
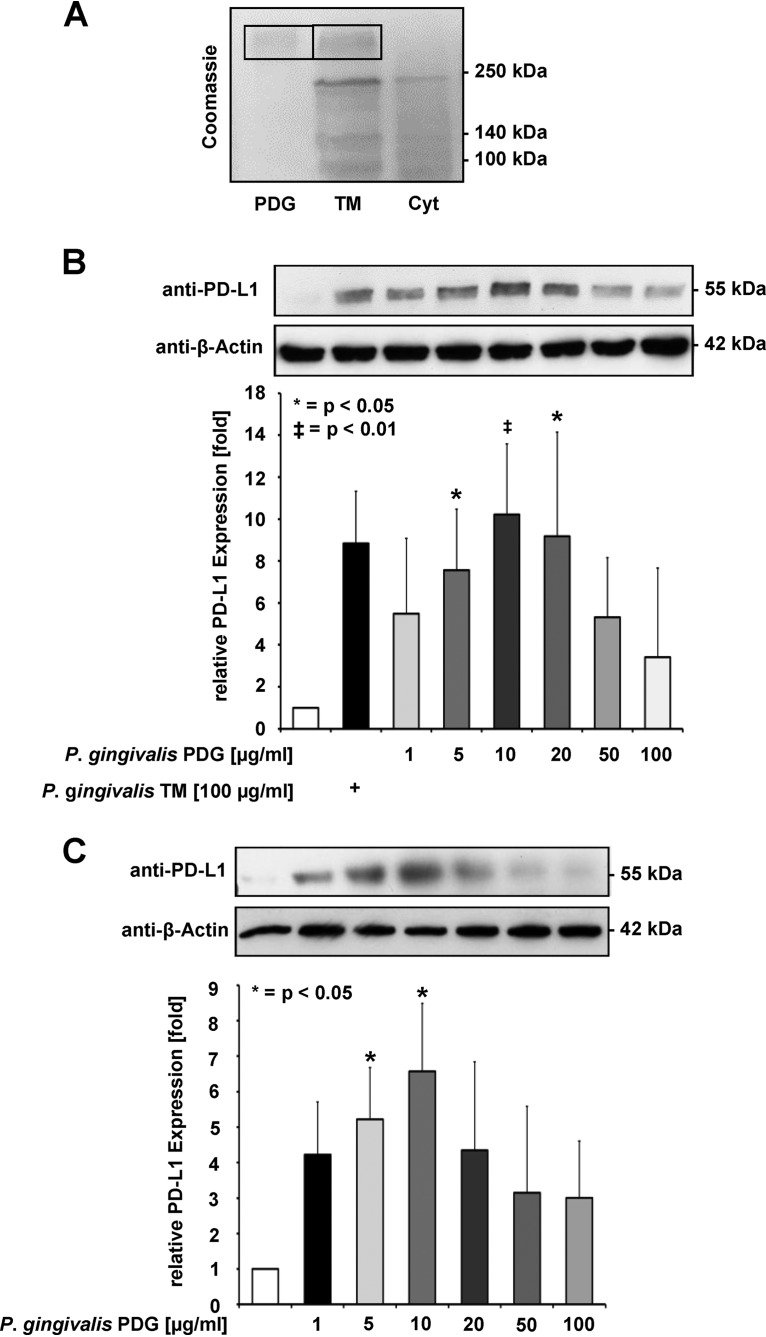
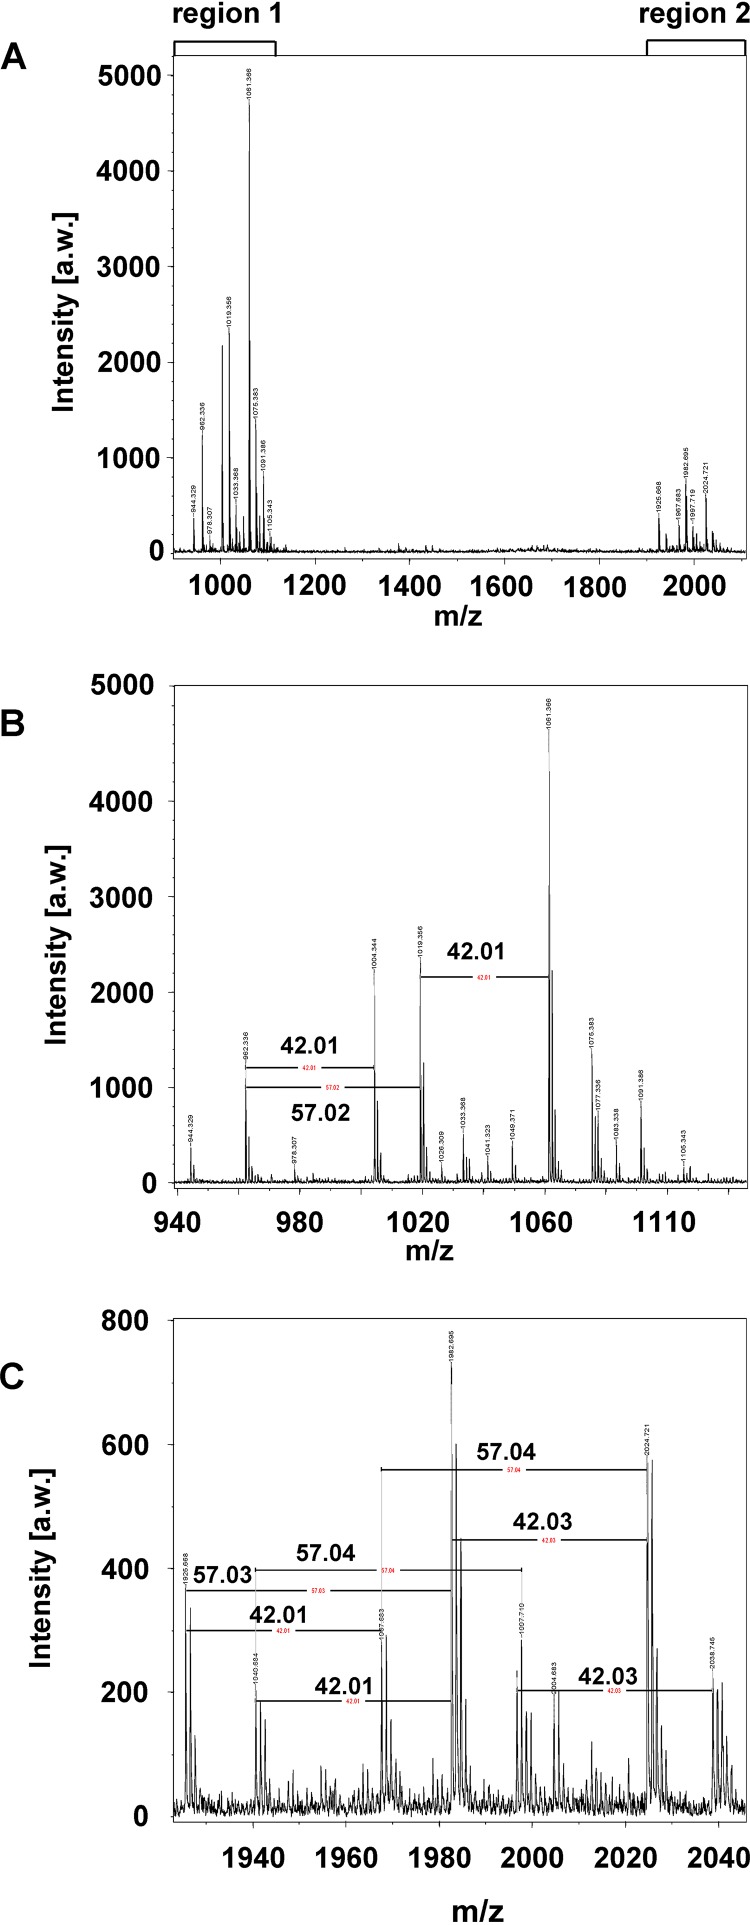
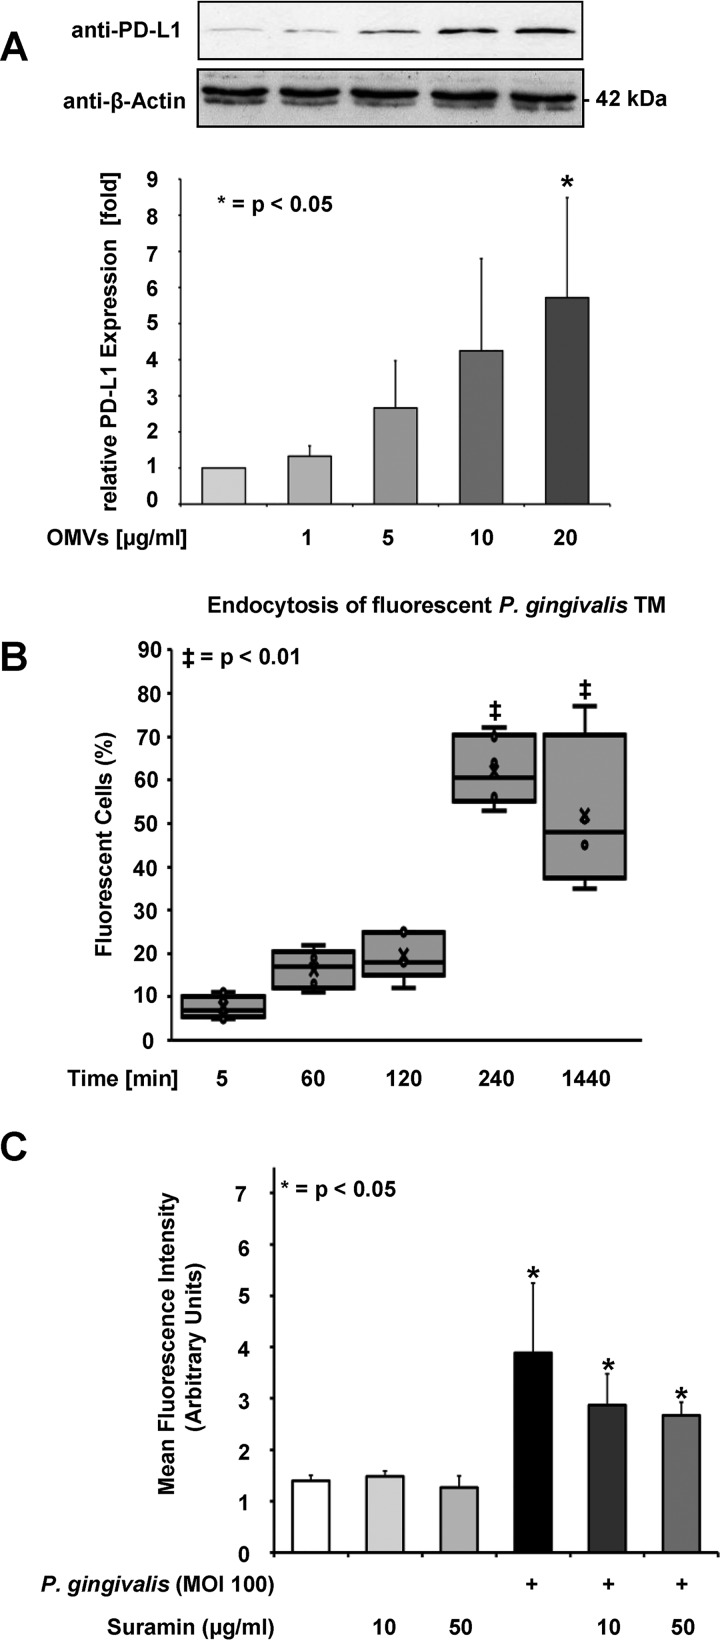
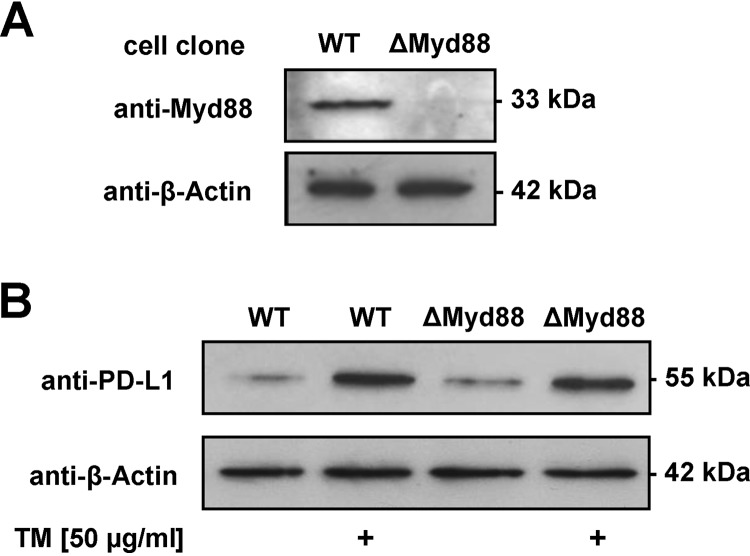
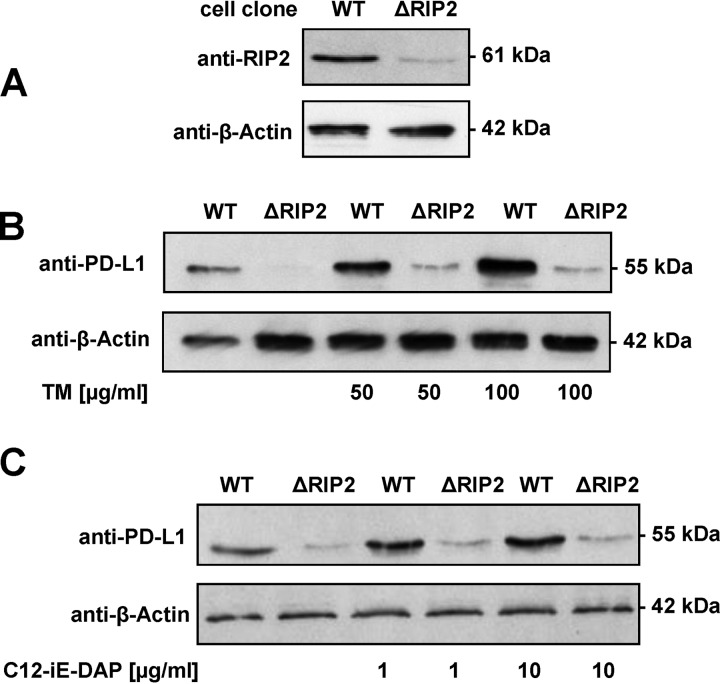
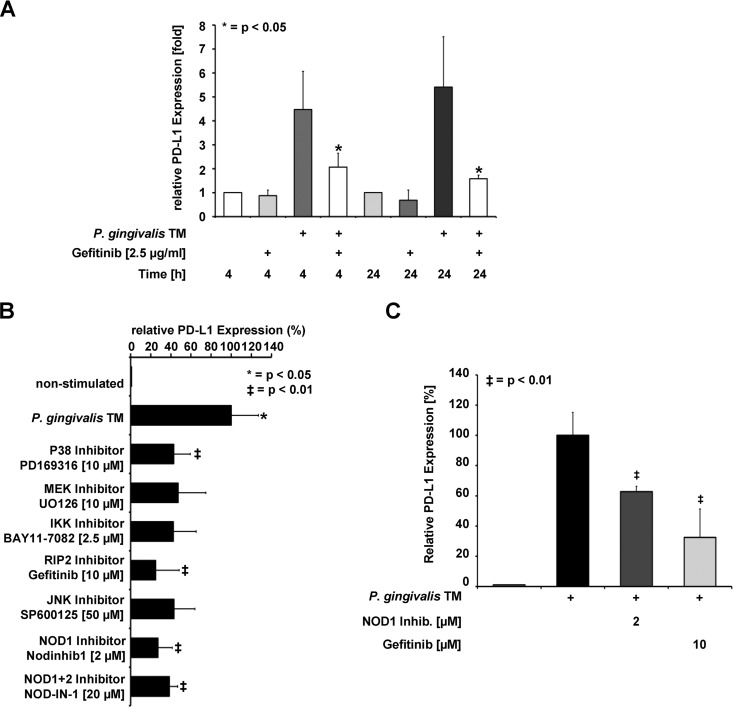
Programmed death-ligand 1 (PD-L1/B7-H1) serves as a cosignaling molecule in cell-mediated immune responses and contributes to chronicity of inflammation and the escape of tumor cells from immunosurveillance. Here, we investigated the molecular mechanisms leading to PD-L1 upregulation in human oral carcinoma cells and in primary human gingival keratinocytes in response to infection with Porphyromonas gingivalis (P. gingivalis), a keystone pathogen for the development of periodontitis. The bacterial cell wall component peptidoglycan uses bacterial outer membrane vesicles to be taken up by cells. Internalized peptidoglycan triggers cytosolic receptors to induce PD-L1 expression in a myeloid differentiation primary response 88 (Myd88)-independent and receptor-interacting serine/threonine-protein kinase 2 (RIP2)-dependent fashion. Interference with the kinase activity of RIP2 or mitogen-activated protein (MAP) kinases interferes with inducible PD-L1 expression.
Keywords: B7-H1; PD-L1; Porphyromonas gingivalis; immune evasion; immune suppression; signaling pathway.
Copyright © 2020 American Society for Microbiology.
Figures
Similar articles
-
Induction of B7-H1 receptor by bacterial cells fractions of Porphyromonas gingivalis on human oral epithelial cells: B7-H1 induction by Porphyromonas gingivalis fractions.Immunobiology. 2017 Feb;222(2):137-147. doi: 10.1016/j.imbio.2016.10.011. Epub 2016 Oct 17. Immunobiology. 2017. PMID: 28164807
-
Porphyromonas gingivalis induced up-regulation of PD-L1 in colon carcinoma cells.Mol Oral Microbiol. 2021 Jun;36(3):172-181. doi: 10.1111/omi.12332. Mol Oral Microbiol. 2021. PMID: 33715305
-
B7-H1 and B7-DC receptors of oral squamous carcinoma cells are upregulated by Porphyromonas gingivalis.Immunobiology. 2011 Dec;216(12):1302-10. doi: 10.1016/j.imbio.2011.05.005. Epub 2011 Jun 12. Immunobiology. 2011. PMID: 21723642
-
PD-1/PD-L1 pathway: A double-edged sword in periodontitis.Biomed Pharmacother. 2023 Mar;159:114215. doi: 10.1016/j.biopha.2023.114215. Epub 2023 Jan 9. Biomed Pharmacother. 2023. PMID: 36630848 Review.
-
Pathogenic strategies of the oral anaerobe, Porphyromonas gingivalis.Trends Microbiol. 1995 Feb;3(2):45-51. doi: 10.1016/s0966-842x(00)88874-5. Trends Microbiol. 1995. PMID: 7728384 Review.
Cited by
-
P. gingivalis Infection Upregulates PD-L1 Expression on Dendritic Cells, Suppresses CD8+ T-cell Responses, and Aggravates Oral Cancer.Cancer Immunol Res. 2023 Mar 1;11(3):290-305. doi: 10.1158/2326-6066.CIR-22-0541. Cancer Immunol Res. 2023. PMID: 36633576 Free PMC article.
-
The Microbiome in Pancreatic Cancer-Implications for Diagnosis and Precision Bacteriophage Therapy for This Low Survival Disease.Front Cell Infect Microbiol. 2022 May 19;12:871293. doi: 10.3389/fcimb.2022.871293. eCollection 2022. Front Cell Infect Microbiol. 2022. PMID: 35663462 Free PMC article. Review.
-
RIPK2: a promising target for cancer treatment.Front Pharmacol. 2023 May 30;14:1192970. doi: 10.3389/fphar.2023.1192970. eCollection 2023. Front Pharmacol. 2023. PMID: 37324457 Free PMC article. Review.
-
Periodontal pathogens and cancer development.Periodontol 2000. 2024 Oct;96(1):112-149. doi: 10.1111/prd.12590. Epub 2024 Jul 4. Periodontol 2000. 2024. PMID: 38965193 Free PMC article. Review.
-
Role of PD-L1 in Gut Mucosa Tolerance and Chronic Inflammation.Int J Mol Sci. 2020 Dec 1;21(23):9165. doi: 10.3390/ijms21239165. Int J Mol Sci. 2020. PMID: 33271941 Free PMC article. Review.
References
-
- Freeman GJ, Long AJ, Iwai Y, Bourque K, Chernova T, Nishimura H, Fitz LJ, Malenkovich N, Okazaki T, Byrne MC, Horton HF, Fouser L, Carter L, Ling V, Bowman MR, Carreno BM, Collins M, Wood CR, Honjo T. 2000. Engagement of the PD-1 immunoinhibitory receptor by a novel B7 family member leads to negative regulation of lymphocyte activation. J Exp Med 192:1027–1034. doi:10.1084/jem.192.7.1027. - DOI - PMC - PubMed
-
- Wang S, Chen L. 2004. T lymphocyte co-signaling pathways of the B7-CD28 family. Cell Mol Immunol 1:37–42. - PubMed
Publication types
MeSH terms
Substances
LinkOut - more resources
Full Text Sources
Medical
Molecular Biology Databases
Research Materials
