. 2020 Apr;69(4):614-623.
doi: 10.2337/db19-0764. Epub 2020 Feb 10.

L-Cell Differentiation Is Induced by Bile Acids Through GPBAR1 and Paracrine GLP-1 and Serotonin Signaling

Affiliations

L-Cell Differentiation Is Induced by Bile Acids Through GPBAR1 and Paracrine GLP-1 and Serotonin Signaling

Mari Lilith Lund et al. Diabetes. 2020 Apr.

Abstract

Glucagon-like peptide 1 (GLP-1) mimetics are effective drugs for treatment of type 2 diabetes, and there is consequently extensive interest in increasing endogenous GLP-1 secretion and L-cell abundance. Here we identify G-protein-coupled bile acid receptor 1 (GPBAR1) as a selective regulator of intestinal L-cell differentiation. Lithocholic acid and the synthetic GPBAR1 agonist, L3740, selectively increased L-cell density in mouse and human intestinal organoids and elevated GLP-1 secretory capacity. L3740 induced expression of Gcg and transcription factors Ngn3 and NeuroD1 L3740 also increased the L-cell number and GLP-1 levels and improved glucose tolerance in vivo. Further mechanistic examination revealed that the effect of L3740 on L cells required intact GLP-1 receptor and serotonin 5-hydroxytryptamine receptor 4 (5-HT4) signaling. Importantly, serotonin signaling through 5-HT4 mimicked the effects of L3740, acting downstream of GLP-1. Thus, GPBAR1 agonists and other powerful GLP-1 secretagogues facilitate L-cell differentiation through a paracrine GLP-1-dependent and serotonin-mediated mechanism.


Figures

Figure 1
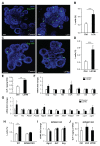
Figure 1. Activation of GPBAR1 by the bile acid LCA and a synthetic agonist increases L-cell number in organoids.
(A) Representative images of control and organoids treated with 20 μM LCA. L-cells are labeled by Gcg-YFP expression in this and following images unless otherwise indicated. Nuclei labeled by DAPI. Bar 50 μm. (B) L-cell numbers in control organoids (n = 70) and organoids treated with LCA (n = 78). In this and following figures data are mean ± SEM (unless otherwise indicated). * p < 0.05, ** p < 0.01, ** p < 0.001. (C) Representative images of control and L3740-treated organoids. Bar 50 μm. (D) L-cell numbers in control (n = 38) and L3740-treated organoids (n = 30). (E) GLP-1 secretion from L3740-treated organoids stimulated by 18 mM glucose and 2 mM L-glutamine. Data from 3 experiments performed with 5 replicas. (F) Gene expression of intestinal hormones in L3740-treated organoids (n = 4 - 10 in each series). (G) Gene expression of intestinal cell type markers and transcription factors directing L cell development. Lgr5 and CD133 – proliferating cells, ITF – goblet cells, Lyz1 – Paneth cells, I-Fabp – enterocytes; Ngn3, NeuroD1, Arx, Foxa1/2 – L-cell transcription factors (n = 4-10 experiments in each series). (H) L-cell numbers, identified by immunostaining, in control and GPBAR1KO and wild type mouse organoids after 48-h-treatment with L3740 (n = 21-25). (I) Expression of L-cell differentiation markers in control and L3740-treated GPBAR1 knockout organoids. n = 3 for each series. (G) GLP-1 release in response to LCA and L3740 in GPBAR1 knockout organoids. n = 5 for each series.
Figure 2
Figure 2. In-feed L3740 treatment increases oral glucose tolerance, GLP-1 secretion and L-cell number in mice.
(A) Plasma glucose excursion during an oral glucose tolerance test after 5 hour fasting and. L3740, black squares; control (vehicle), white squares. n = 10 for each series. (B) Area under the curve from data in panel A (AUC). (C) Plasma GLP-1 concentrations in control and L3740-treated mice and 10 minutes after glucose. n = 8 for each series. (B) L-cells (Gcg-YFP) in the ileum of control and L3740 treated mice. Nuclei labeled by DAPI. Bar 50 μm. (C) L-cell percentage in mouse ileum sections. n = 4 for each series. (D) Expression of Gcg and Ngn3 (n = 4 for each series).
Figure 3
Figure 3. GPBAR1 stimulation increases L-cell abundance in human organoids.
(A) L-cell numbers in control (n = 66) and L3740-treated human small intestine organoids (n = 44). (B) Representative images of control and L3740-treated human organoids. L-cells are labeled by GLP-1 immunostaining (white arrows), nuclei labeled by DAPI. Bar 50 μm. (C) A shift in the organoid distribution by the cell number after treatment with L3740. Percentages of organoids with various L-cell numbers are presented from data in panel A. p < 0.05 by Chi-Square contingency test. (D) Expression of NGN3, NEUROD1 (ND1) and GCG (n = 4 for each series, generated from 2 human organoid lines).
Figure 4
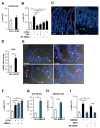
Figure 4. GPBAR1 induction of L-cell differentiation requires cross-talk with serotonin signaling.
(A) Effect of L3740 in GLP1RKO mouse organoids. n = 47 for control and n = 58 for L3740-treated series. (B) Effect of 5-HTR3 and 5-HTR4 inhibitor tropisetron (TRP) and 5-HTR4 inhibitor RS-39604 in organoids alone and in combination with L3740. (C) Htr4 and Htr3 in mouse ileum identified by in situ hybridization. Nucleus labeling by DAPI (blue). White arrows indicate positive Htr3 staining outside of the epithelial layer. Bar 50 μm. (D) L3740 increases Htr4 expression in organoids. n = 7 for control and n = 6 for L3740-treated series. (E) Co-expression of Htr4 and cell markers Lgr5, CD133, Math1 and Ngn3 in mouse ileal crypts identified by in situ hybridization. White arrows indicate positive Htr4 staining. Nuclei are labeled with DAPI (blue). Bar 20 μm. (F) Effect of 5-HT4R agonist BIMU 8 and L3740 on the L-cell number. n = 17-35 in panels A and B. (G) BIMU 8 increases L-cell number in GLP1R KO mouse organoids, while L3740 has no effect on the L-cells. n = 47 for control and n = 20 for L3740-treated series. (H) BIMU8 increases L-cell numbers in GPBAR1KO mouse organoids. n = 21 for control and n = 23 for L-3740-treated series. (I) FFAR1 agonist AM-1638 and GPR119 agonist AR53 have a similar effect on the number of L-cells, while addition of RS-39604 counteracts this effect, n = 33 – 42.

References

    1. Petersen N, Reimann F, van Es JH, van den Berg BM, Kroone C, Pais R, Jansen E, Clevers H, Gribble FM, de Koning EJ. Targeting development of incretin-producing cells increases insulin secretion. J Clin Invest. 2015;125(1):379–385. - PMC - PubMed
    1. Basak O, Beumer J, Wiebrands K, Seno H, van Oudenaarden A, Clevers H. Induced Quiescence of Lgr5+ Stem Cells in Intestinal Organoids Enables Differentiation of Hormone-Producing Enteroendocrine Cells. Cell Stem Cell. 2017;20(2):177–190. - PubMed
    1. Petersen N, Frimurer TM, Terndrup Pedersen M, Egerod KL, Wewer Albrechtsen NJ, Holst JJ, Grapin-Botton A, Jensen KB, Schwartz TW. Inhibiting RHOA Signaling in Mice Increases Glucose Tolerance and Numbers of Enteroendocrine and Other Secretory Cells in the Intestine. Gastroenterology. 2018;155(4):1164–1176.e2. - PubMed
    1. Gehart H, Clevers H. Tales from the crypt: new insights into intestinal stem cells. Nat Rev Gastroenterol Hepatol. 2018;16(1):19–34. - PubMed
    1. Jenny M, Uhl C, Roche C, Duluc I, Guillermin V, Guillemot F, Jensen J, Kedinger M, Gradwohl G. Neurogenin3 is differentially required for endocrine cell fate specification in the intestinal and gastric epithelium. EMBO J. 2002;21:6338–6347. - PMC - PubMed

Publication types

MeSH terms