. 2020 Mar 26;202(8):e00685-19.
doi: 10.1128/JB.00685-19. Print 2020 Mar 26.

Single-Cell Analysis Reveals that the Enterococcal Sex Pheromone Response Results in Expression of Full-Length Conjugation Operon Transcripts in All Induced Cells

Affiliations

Single-Cell Analysis Reveals that the Enterococcal Sex Pheromone Response Results in Expression of Full-Length Conjugation Operon Transcripts in All Induced Cells

Rebecca J B Erickson et al. J Bacteriol. .

Abstract

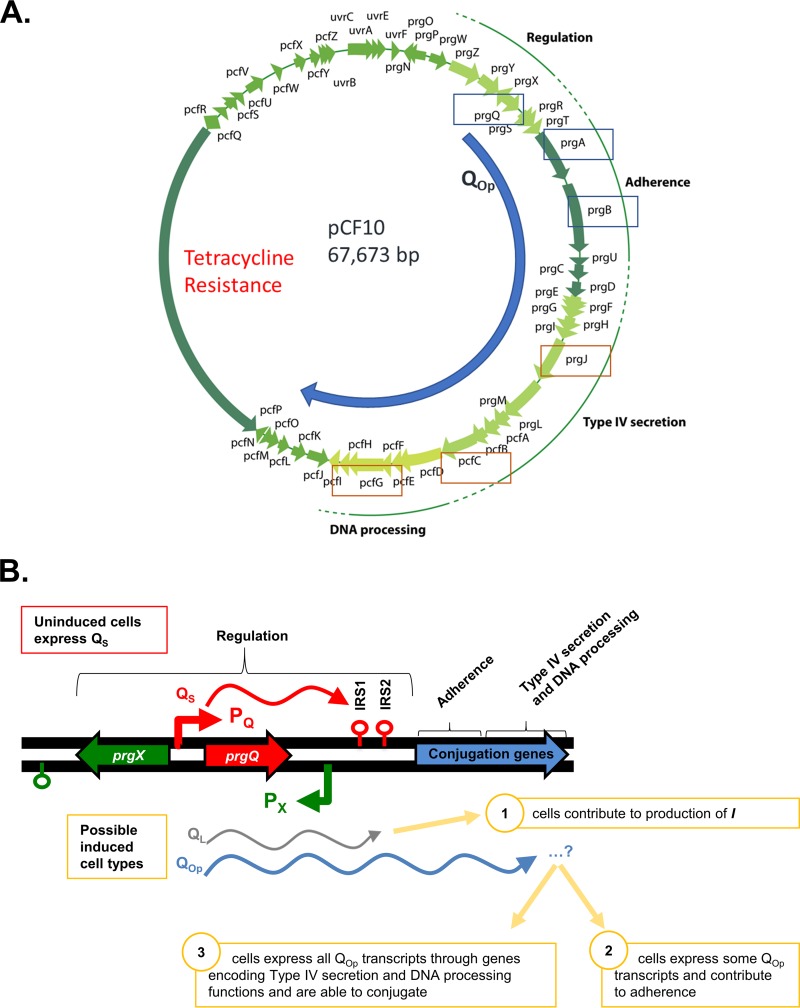
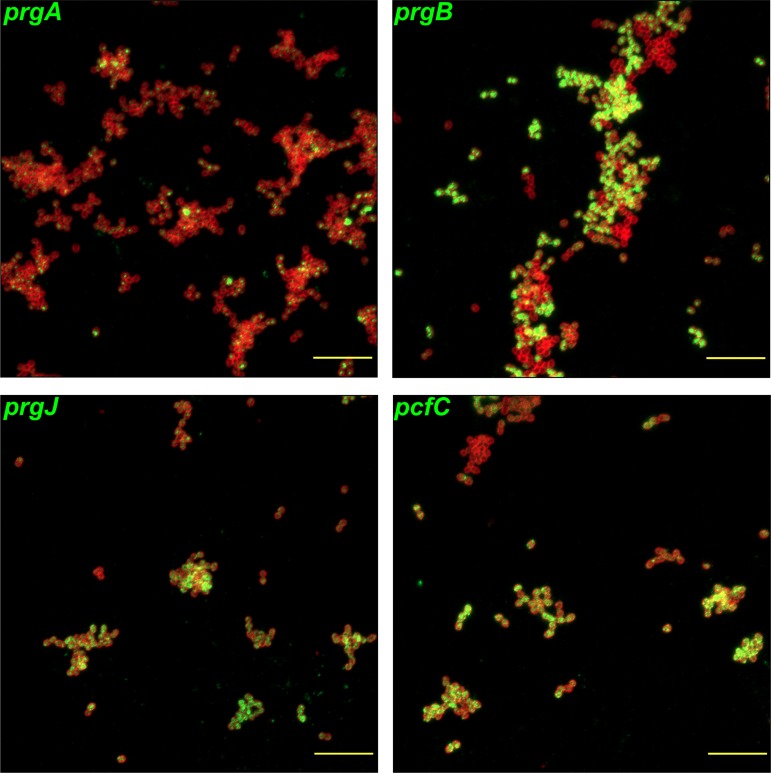
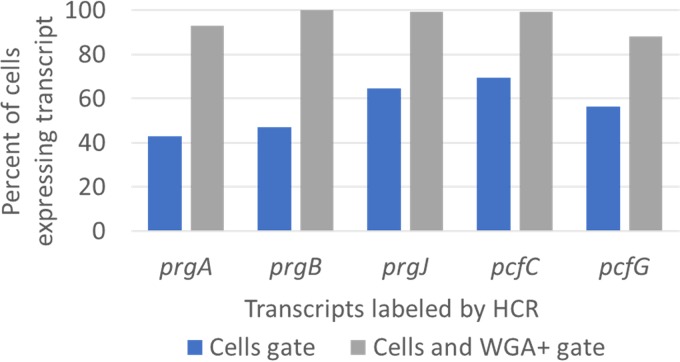
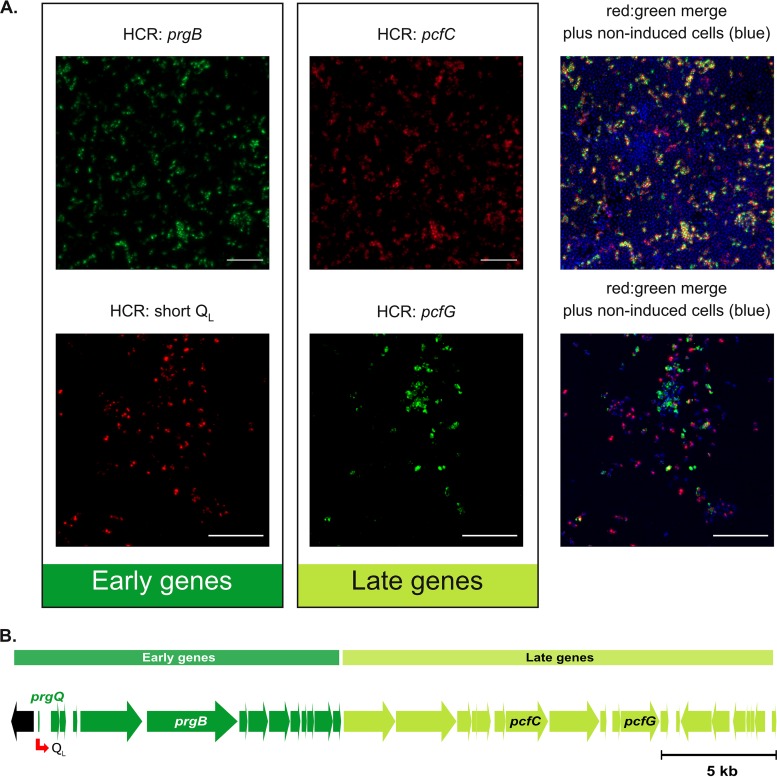
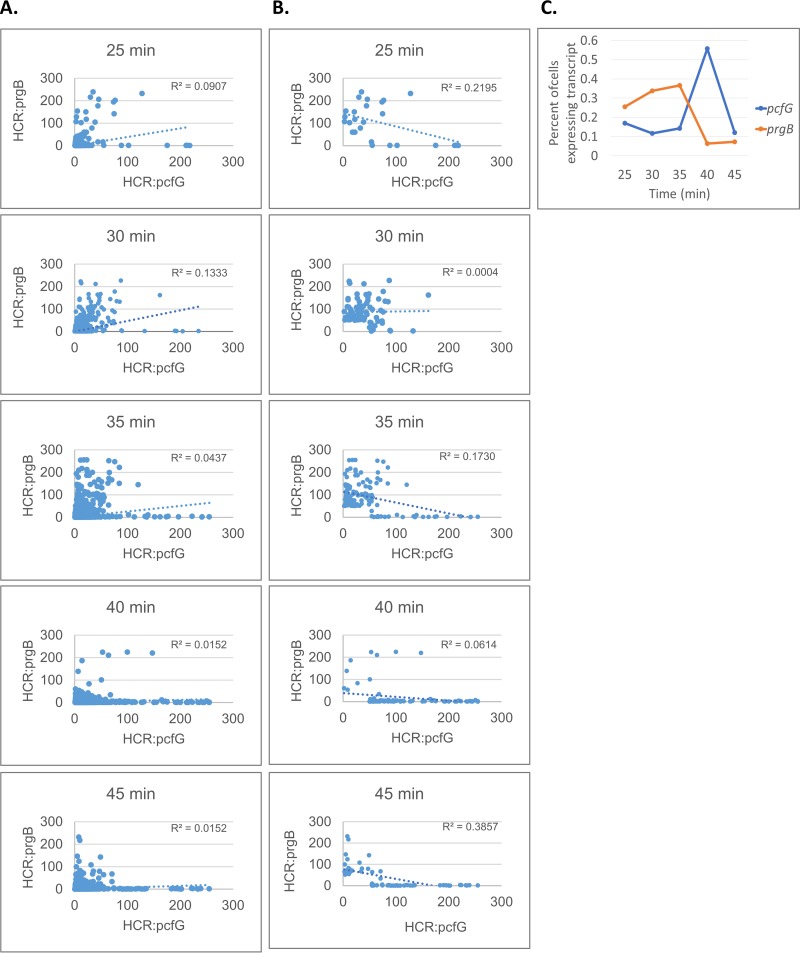
For high-frequency transfer of pCF10 between E. faecalis cells, induced expression of the pCF10 genes encoding conjugative machinery from the prgQ operon is required. This process is initiated by the cCF10 (C) inducer peptide produced by potential recipient cells. The expression timing of prgB, an "early" gene just downstream of the inducible promoter, has been studied extensively in single cells. However, several previous studies suggest that only 1 to 10% of donors induced for early prgQ gene expression actually transfer plasmids to recipients, even at a very high recipient population density. One possible explanation for this is that only a minority of pheromone-induced donors actually transcribe the entire prgQ operon. Such cells would not be able to functionally conjugate but might play another role in the group behavior of donors. Here, we sought to (i) simultaneously assess the presence of RNAs produced from the proximal (early induced transcripts [early Q]) and distal (late Q) portions of the prgQ operon in individual cells, (ii) investigate the prevalence of heterogeneity in induced transcript length, and (iii) evaluate the temporality of induced transcript expression. Using fluorescent in situ hybridization chain reaction (HCR) transcript labeling and single-cell microscopic analysis, we observed that most cells expressing early transcripts (QL, prgB, and prgA) also expressed late transcripts (prgJ, pcfC, and pcfG). These data support the conclusion that, after induction is initiated, transcription likely extends through the end of the conjugation machinery operon for most, if not all, induced cells.IMPORTANCE In Enterococcus faecalis, conjugative plasmids like pCF10 often carry antibiotic resistance genes. With antibiotic treatment, bacteria benefit from plasmid carriage; however, without antibiotic treatment, plasmid gene expression may have a fitness cost. Transfer of pCF10 is mediated by cell-to-cell signaling, which activates the expression of conjugation genes and leads to efficient plasmid transfer. Yet, not all donor cells in induced populations transfer the plasmid. We examined whether induced cells might not be able to functionally conjugate due to premature induced transcript termination. Single-cell analysis showed that most induced cells do, in fact, express all of the genes required for conjugation, suggesting that premature transcription termination within the prgQ operon does not account for failure of induced donor cell gene transfer.

Keywords: conjugation; hybridization chain reaction; plasmid transfer.


Figures

FIG 1
FIG 1
Maps of pCF10 and the pCF10 prgX-prgQ regulatory region. Transcripts shown are expressed from promoter PQ, with or without induction by C. (A) Map showing the extended QOp transcript and genes for which HCR transcript-labeling probes were designed. Early QOp transcripts (QL prgA, and prgB) for which HCR probes were designed are boxed in blue, and late QOp transcripts (prgJ, pcfC, and pcfG) for which HCR probes were designed are boxed in orange. (B) In the uninduced state, PQ is modestly active and produces QS transcripts (red), which terminate at IRS1. Upon induction, production of QL (gray) and QOp transcripts (blue) increases dramatically. QL transcripts have are identical to QS transcripts through IRS1 but terminate at IRS2; for this study, we used HCR probes to RNAs produced from the sequences between IRS1 and IRS2, since they are unique to induced cells. QOp transcripts (blue) continue through regions of pCF10 that encode genes required for conjugation. prgX transcripts are generated from the opposite strand and extend from promoter Px, terminating near the 3′ end of prgX (green lollipop). I, iCF10.
FIG 2
FIG 2
Time-lapse visualization of induction and conjugation via fluorescent reporter protein expression. (A) A dense culture of recipients (blue; Hoechst 33342) and donors (red; constitutive tdTomato expression; exposed to C for 5 min just before mixing) were combined (donor-recipient, 1:100) and sandwiched between an agarose pad and coverslip-bottomed petri dish. Donors express green fluorescent protein (GFP; green) when induced by C. The entire field was tracked every 30 min for 6 h beginning at t =+40 min using time-lapse laser-scanning confocal microscopy; t = +40 to t = +220 min shown here. Induction of a single tdTomato-positive cell (inset). After induction, the cell transcribes the GFP-coupled genes and begins to fluoresce green (arrows). Also, although numerous recipient cells surrounded induced donor cells, induction was not detected for many donors, even over extended time scales. Bars, 10 μm (white) and 2 μm (green, inset). While uncommon, there are rarely donor cells with bright GFP expression even at early (t < 40 min) time points (red circle). Notably, the green fluorescent intensity of these cells was typically static, even over long time periods. (B) Subsequent image analysis allows identification of potential donors (tdTomato positive throughout imaging period) and transconjugants (those cells that become tdTomato positive during imaging). This image shows donor cells that did not change position during the entire experiment. (C) To accurately differentiate potential transconjugants from artifactual signals (nonattached donor cells or autofluorescent debris transiently appearing in the imaging field), individual cells were tracked. White circles indicate cells tracked through all imaging time points during the first 90 min and thus categorized as initial donor cells. Note the rarity of transconjugants. Bar, 2 μm. (C, I) All tdTomato-positive cells observed through the 90-min time point (from panel B). (C, II) The binarized image shows all new red fluorescent signals identified as cells appearing in the field over the 90-min period. (C, III) Among the cells identified in panel C, II, two potential transconjugants met the requirements that potential transconjugants were spatially adjacent to an existing induced donor cell. Other excluded/untracked tdTomato-positive cells were likely secondary to minor deformation of the agarose substrate over time leading to shifts in included focal planes and/or transient, nonattached cells. Bar, 2 μm.
FIG 3
FIG 3
HCR labeling of induced genes suggest that induced early and late transcripts appear to be expressed in a similar fraction of cells. E. faecalis OG1RF/pCF10 was harvested for HCR labeling at 30 min after addition of 50 ng · ml−1 C. Induced prgA, prgB, prgJ, and pcfC transcripts were fluorescently labeled by HCR in separate paired samples. Red, cell envelopes labeled with Alexa Fluor 647-wheat germ agglutinin (AF647-WGA) conjugate highlighting the outlines of individual bacterial cells; green, HCR-labeled transcripts (Alexa Fluor 488). Bars, 10 μm.
FIG 4
FIG 4
Flow cytometry analysis of HCR labeling of induced genes supports the hypothesis that induced early and late transcripts are expressed in a similar percentage of cells. E. faecalis OG1RF/pCF10 was harvested for HCR labeling at 30 min after addition of 50 ng · ml−1 C. Induced prgA, prgB, prgJ, pcfC, and pcfG transcripts were fluorescently labeled by HCR in separate paired samples. Cells were also labeled with Alexa Fluor 647-wheat germ agglutinin (AF647-WGA) conjugate, which binds cell envelopes. Cells were gated by typical forward and side scatter (FSC and SSC) properties (“Cells gate”), and the percentages of cells with Alexa Fluor 488 HCR staining were quantified. Probable cells based on FSC and SSC properties were also further gated by AF647-WGA staining, and the percentages of cells with Alexa Fluor 488 HCR staining were requantified (“Cells and WGA+ gate”).
FIG 5
FIG 5
Induced E. faecalis cells that express early induced transcripts also express late induced transcripts. (A) E. faecalis OG1RF/pCF10 was harvested for HCR labeling at 30 min after addition of 2.5 ng · ml−1 C. Green and red, transcripts labeled by HCR with Alexa Fluor 488 and Alexa Fluor 647, respectively; blue, nucleic acids (primarily DNA) labeled with Hoechst 33342 highlight individual cells. (Top) Induced prgB (green, early gene) and pcfC (red, late gene) HCR-labeled transcripts. (Bottom) Induced pcfG (green, late gene) and QL (red, early gene) HCR-labeled transcripts. Bars, 10 μm. (B) Schematic showing the distances between the genes whose transcripts were probed using HCR. See Fig. 1 for a more complete map. Not shown is a control experiment in which an identically induced aliquot of donor cells was subjected to HCR analysis for both QL and pcfG expression but where the fluorophores used for detection were swapped; the fractions of positive cells for each transcript were not detectably different from those shown in the images in the lower part of panel A.
FIG 6
FIG 6
Analysis of HCR-labeled cells suggests that peak expression of early and late induced genes may be temporally distinct. E. faecalis cells carrying pCF10 were induced as described for Fig. 5 and harvested for HCR labeling at 25, 30, 35, 40, and 45 min after the addition of 2.5 ng · ml−1 C. Induced early (prgB) and late (pcfG) transcripts were fluorescently labeled by HCR and quantified by image analysis, as described above and in Materials and Methods. (A and B) Plotted values reflect relative intensity of the fluorescent HCR labeling in individual cells for each transcript. R2 values reflect the cells plotted on each graph. (A) All analyzed cells are plotted. (B) Only cells over the HCR intensity threshold of 50 for either labeled transcript are plotted. (C) Percentages of cells with HCR staining over the threshold were quantified and plotted for each time point. The total numbers of imaged cells analyzed for each time point are as follows: 7,061 (25 min), 23,114 (30 min), 28,646 (35 min), 15,759 (40 min), and 31,506 (45 min).

Similar articles

Cited by

References

    1. Dunny GM, Brown BL, Clewell DB. 1978. Induced cell aggregation and mating in Streptococcus faecalis: evidence for a bacterial sex pheromone. Proc Natl Acad Sci U S A 75:3479–3483. doi:10.1073/pnas.75.7.3479. - DOI - PMC - PubMed
    1. Dunny GM. 2013. Enterococcal sex pheromones: signaling, social behavior, and evolution. Annu Rev Genet 47:457–482. doi:10.1146/annurev-genet-111212-133449. - DOI - PubMed
    1. Bensing BA, Manias DA, Dunny GM. 1997. Pheromone cCF10 and plasmid pCF10-encoded regulatory molecules act post-transcriptionally to activate expression of downstream conjugation functions. Mol Microbiol 24:285–294. doi:10.1046/j.1365-2958.1997.3301710.x. - DOI - PubMed
    1. Chen Y, Bandyopadhyay A, Kozlowicz BK, Haemig HAH, Tai A, Hu W-S, Dunny GM. 2017. Mechanisms of peptide sex pheromone regulation of conjugation in Enterococcus faecalis. MicrobiologyOpen 6:e00492. doi:10.1002/mbo3.492. - DOI - PMC - PubMed
    1. Bandyopadhyay A. 2018. Systems analysis of pheromone signaling and antibiotic resistance transfer in Enterococcus faecalis. PhD thesis University of Minnesota, Minneapolis, MN.

Publication types

MeSH terms

LinkOut - more resources