. 2020 Apr 13;40(9):e00473-19.
doi: 10.1128/MCB.00473-19. Print 2020 Apr 13.

A Circular RNA from the MDM2 Locus Controls Cell Cycle Progression by Suppressing p53 Levels

Affiliations

A Circular RNA from the MDM2 Locus Controls Cell Cycle Progression by Suppressing p53 Levels

Ritu Chaudhary et al. Mol Cell Biol. .

Abstract

Circular RNAs (circRNAs) are a class of noncoding RNAs produced by a noncanonical form of alternative splicing called back-splicing. To investigate a potential role of circRNAs in the p53 pathway, we analyzed RNA sequencing (RNA-seq) data from colorectal cancer cell lines (HCT116, RKO, and SW48) that were untreated or treated with a DNA-damaging agent. Surprisingly, unlike the strong p53-dependent induction of hundreds of p53-induced mRNAs upon DNA damage, only a few circRNAs were upregulated from p53-induced genes. circ-MDM2, an annotated circRNA from the MDM2 locus, was one of the handful of circRNAs that originated from a p53-induced gene. Given the central role of MDM2 in suppressing p53 protein levels and p53 activity, we investigated the function of circ-MDM2 Knocking down circ-MDM2 with small interfering RNAs (siRNAs) that targeted circ-MDM2 did not alter MDM2 mRNA or MDM2 protein levels but resulted in increased basal p53 levels and growth defects in vitro and in vivo Consistent with these results, transcriptome profiling showed increased expression of several direct p53 targets, reduced retinoblastoma protein (Rb) phosphorylation, and defects in G1-S progression upon silencing circ-MDM2 Our results on the initial characterization of circ-MDM2 identify a new player from the MDM2 locus that suppresses p53 levels and cell cycle progression.

Keywords: CRC; DNA damage; MDM2; cell cycle; circRNA; circular RNA; p53.


Figures

FIG 1
FIG 1
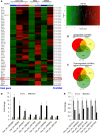
Genome-wide identification of DNA damage-inducible circRNAs from multiple CRC lines. (A) A heat map (left panel) is shown for the differentially expressed circRNAs identified by RNA-seq from HCT116, RKO, and SW48 cells untreated or treated with DOXO for 16 h. Upregulated genes are shown in red, and downregulated genes are shown in green. circ-MDM2 (hsa_circ_0027492) is shown in the red box. The scale for the heat map is shown in the upper right panel. (B and C) Venn diagram shows the number of all the circRNAs upregulated ≥2-fold and downregulated ≤2-fold after DOXO treatment of HCT116, RKO, and SW48 cells and the overlap between the three CRC cell lines. (D and E) qRT-PCR analysis from HCT116 cells untreated or treated with DOXO for 16 h. Error bars represent standard deviations from three independent experiments.
FIG 2
FIG 2
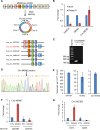
circ-MDM2 is upregulated in a p53-dependent manner in response to DNA damage. (A) The upper panel shows a pictorial representation of MDM2 pre-mRNA. Boxes represent annotated exons. circ-MDM2 as shown is formed by back-splicing of exon 8 to exon 4. In the lower panel, exons and introns in the MDM2 pre-mRNA corresponding to other circRNAs from the MDM2 locus are shown. (B) qRT-PCR analysis was performed for GAPDH mRNA, MDM2 mRNA, and circ-MDM2 from HCT116 cells, untreated or treated with RNase R. (C) The circ-MDM2 qRT-PCR product, with or without reverse transcriptase (RT), was visualized by electrophoresis by being run on an agarose gel. (D) Sequence of the circ-MDM2 junction amplified by qRT-PCR was determined by Sanger sequencing. The arrow indicates the junction. (E) Digital droplet PCR results showing the number of molecules per HCT116 cell for GAPDH, MDM2 mRNA, and circ-MDM2, as indicated. Graphs represent the average of three RNA samples from different passages. (F) qRT-PCR analysis from p53-WT and isogenic p53-KO HCT116 cells untreated or treated with DOXO for 16 h. (G) qRT-PCR analysis from HCT116 cells transfected with CTL siRNA or p53 siRNAs untreated or treated with DOXO for 16 h. Error bars represent standard deviations from three independent experiments.
FIG 3
FIG 3
circ-MDM2 is cytoplasmic and induced in multiple cell types in response to DNA damage. (A to C) qRT-PCR analysis from osteosarcoma U2OS cells, SJSA cells, and normal human diploid fibroblast BJ cells, as indicated, untreated or treated with DOXO for 16 h. (D to F) The relative abundance of MDM2 mRNA, circ-MDM2 RNA, and β-actin mRNA, as indicated, relative to that of GAPDH mRNA, as measured by qRT-PCR. (G) qRT-PCR analysis from nuclear and cytoplasmic fractions of HCT116 cells; the cytoplasmic GAPDH mRNA and the nuclear lncRNA MALAT1 were used as controls. Error bars represent standard deviations from independent experiments. #, P < 0.01; **, P < 0.005; ##, P < 0.001.
FIG 4
FIG 4
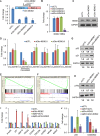
circ-MDM2 suppresses basal p53 levels. (A, top) Pictorial representation of three siRNAs targeting the circ-MDM2 junction. (Bottom) HCT116 cells were transfected with siCTL or circ-MDM2 siRNA for 48 h, and circ-MDM2 knockdown efficiency was evaluated by qRT-PCR. (B) HCT116 cells were transfected with siCTL or circ-MDM2 siRNA for 48 h, and the effect on MDM2 mRNA was determined by qRT-PCR. (C) Immunoblotting shows that siCirc-MDM2-I and -II do not alter MDM2 protein levels. GAPDH was used as a loading control. (D) qRT-PCR analysis from HCT116 cells transfected with CTL siRNA or circ-MDM2 siRNA to determine the effect on the levels of other circRNAs derived from the MDM2 locus. (E and F) Gene set enrichment analysis (GSEA) for the upregulated genes (E) and downregulated genes (F) in the microarrays from untreated HCT116 cells transfected with siCTL or circ-MDM2 siRNA. The normalized enrichment scores were 1.70 and −2.56 for the p53 pathway and E2F targets, respectively. The FDR q values were 0.010 and 0.000 for the p53 pathway and E2F targets, respectively. (G and H) Immunoblot analysis for p53, p21, phosphorylated Rb, and the loading control GAPDH, as indicated, was performed from HCT116 cells transfected with siCTL or circ-MDM2 siRNA. (I and J) qRT-PCR analysis from HCT116 cells transfected with siCTL, circ-MDM2 siRNA, p53 siRNA, or combinations of these siRNAs. Error bars represent standard deviations from three independent experiments.
FIG 5
FIG 5
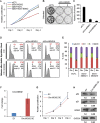
circ-MDM2 knockdown alters cell proliferation and cell cycle progression. (A) Cell proliferation assays at the indicated time points were performed from untreated HCT116 cells transfected with siCTL, circ-MDM2 siRNA, or p53 siRNA 24 h after the cells were seeded in 96-well plates. (B and C) HCT116 cells were transfected with siCTL or circ-MDM2 siRNA for 48 h; cells were then trypsinized and seeded, and colony formation assays were performed after 10 days. (D and E) HCT116 cells were transfected with siCTL or circ-MDM2 siRNA, and after 48 h double-thymidine block assays were performed. After an 8-h recovery, the effect on cell cycle was assessed by performing propidium iodide (PI) staining followed by flow cytometry analysis (FACS). (F) qRT-PCR from HCT116 cells stably overexpressing circ-MDM2 (OE) compared to that of empty vector (EV) shows upregulation of circ-MDM2 levels. GAPDH was used as a loading control. (G) Cell proliferation assays at the indicated time points were performed from HCT116 cells stably overexpressing circ-MDM2 24 h after the cells were seeded in 96-well plates. (H) Immunoblotting was performed for p53, p21, and MDM2 from circ-MDM2 OE cells or empty vector cells. GAPDH was used as a loading control. Error bars represent standard deviations from three independent experiments.
FIG 6
FIG 6
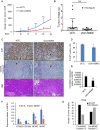
circ-MDM2 depletion results in reduced tumor growth in vivo. (A and B) HCT116 cells were transfected with siCTL or siCirc-MDM2, and after 48 h, cells were injected subcutaneously into the flanks of athymic nude mice (five mice for each group, two tumors per mouse). Average tumor volume and tumor mass are shown. (C) Immunohistochemical staining of the siCTL and siCirc-MDM2 tumors for the proliferation marker Ki67 and apoptosis marker cleaved caspase-3 and hematoxylin and eosin staining. Arrows indicate cells positive for Ki67 or cleaved caspase-3. (D) Quantitation of Ki67-positive cells is shown. Error bars represent standard deviations from three different tumor samples. (E and F) qRT-PCR was performed from tumors (n = 3) isolated from mice 24 days after injecting HCT116 cells transfected with siCTL or siCirc-MDM2. RNA levels were normalized to the level of GAPDH. (G) Correlation of circ-MDM2 occurrence and the p53 mutation status among TCGA COAD samples. *, P < 0.05; #, P < 0.01, **, P < 0.005.

Similar articles

Cited by

References

    1. Olivier M, Hollstein M, Hainaut P. 2010. TP53 mutations in human cancers: origins, consequences, and clinical use. Cold Spring Harb Perspect Biol 2:a001008. doi:10.1101/cshperspect.a001008. - DOI - PMC - PubMed
    1. Vogelstein B, Lane D, Levine AJ. 2000. Surfing the p53 network. Nature 408:307–310. doi:10.1038/35042675. - DOI - PubMed
    1. Donehower LA, Harvey M, Slagle BL, McArthur MJ, Montgomery CA Jr, Butel JS, Bradley A. 1992. Mice deficient for p53 are developmentally normal but susceptible to spontaneous tumours. Nature 356:215–221. doi:10.1038/356215a0. - DOI - PubMed
    1. Malkin D, Li FP, Strong LC, Fraumeni JF Jr, Nelson CE, Kim DH, Kassel J, Gryka MA, Bischoff FZ, Tainsky MA. 1990. Germ line p53 mutations in a familial syndrome of breast cancer, sarcomas, and other neoplasms. Science 250:1233–1238. doi:10.1126/science.1978757. - DOI - PubMed
    1. Zilfou JT, Lowe SW. 2009. Tumor suppressive functions of p53. Cold Spring Harb Perspect Biol 1:a001883. doi:10.1101/cshperspect.a001883. - DOI - PMC - PubMed

Publication types

MeSH terms