. 2020 Apr 1;80(7):1401-1413.
doi: 10.1158/0008-5472.CAN-19-3094. Epub 2020 Feb 10.

Dual Oxidase-Induced Sustained Generation of Hydrogen Peroxide Contributes to Pharmacologic Ascorbate-Induced Cytotoxicity

Affiliations

Dual Oxidase-Induced Sustained Generation of Hydrogen Peroxide Contributes to Pharmacologic Ascorbate-Induced Cytotoxicity

Adrienne R Gibson et al. Cancer Res. .

Abstract

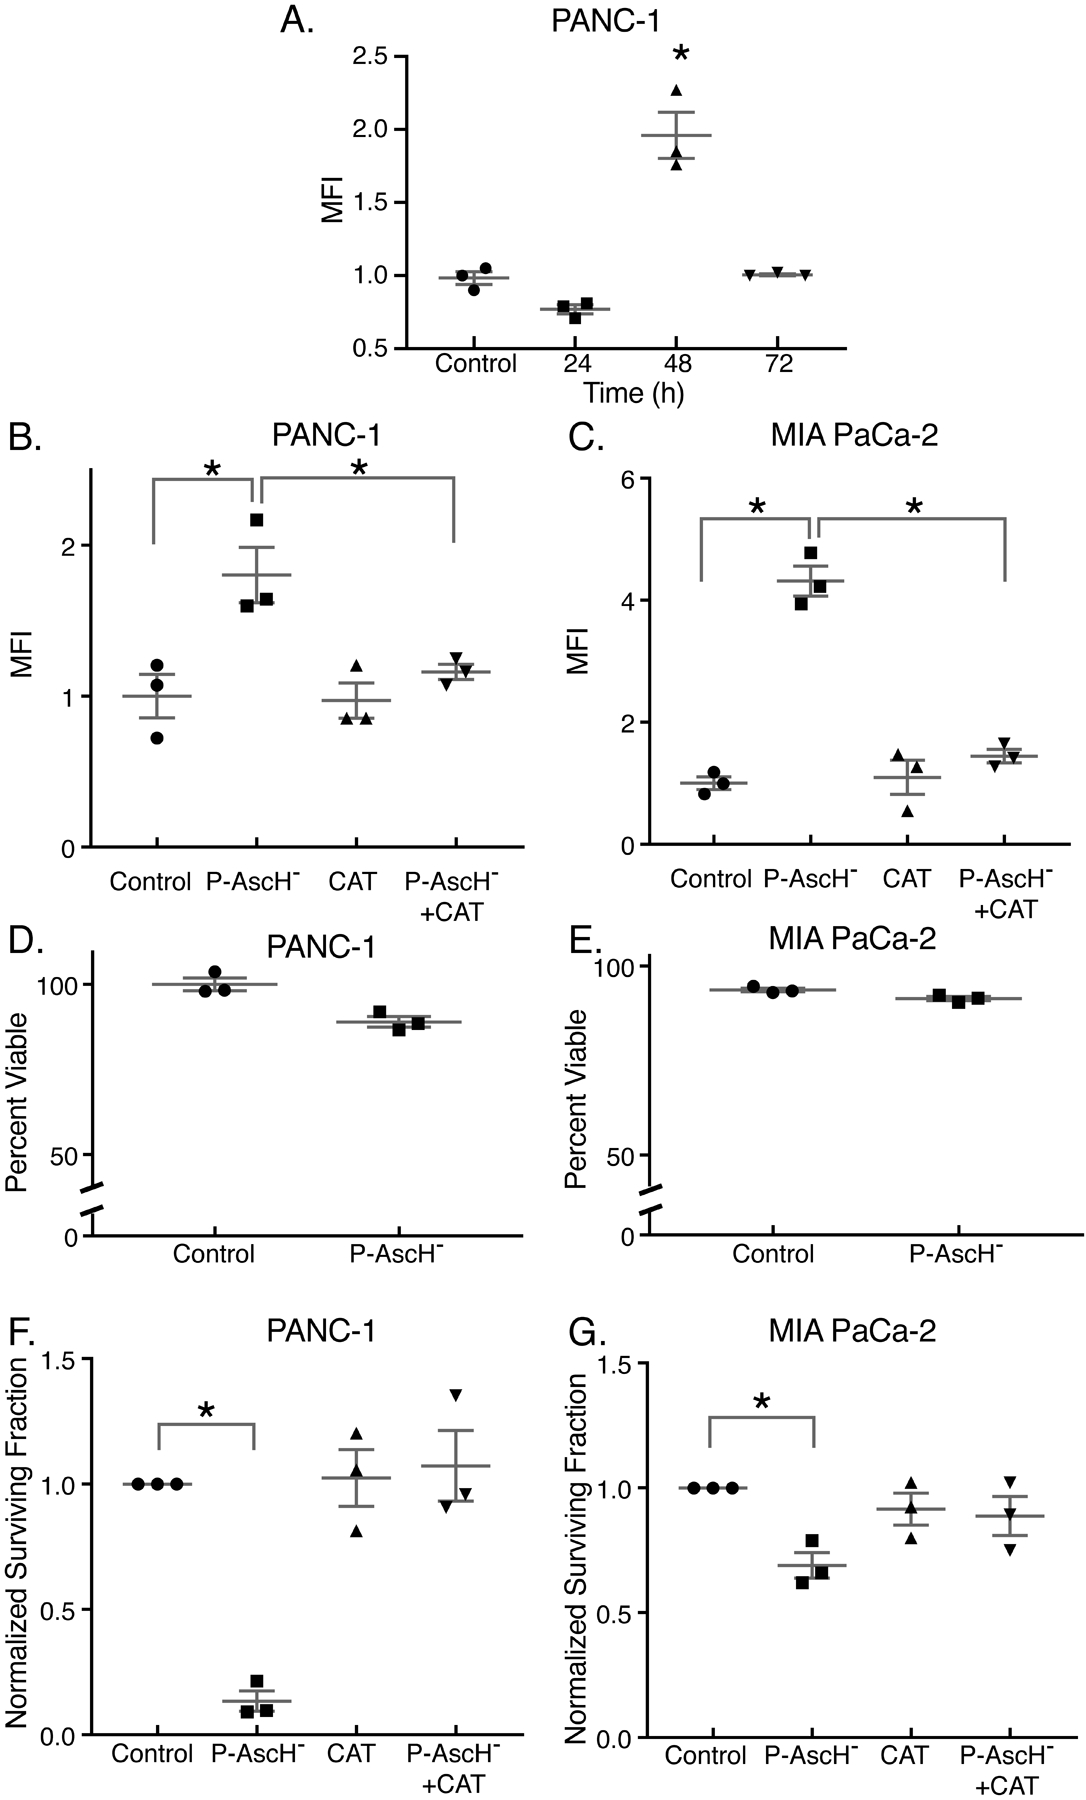
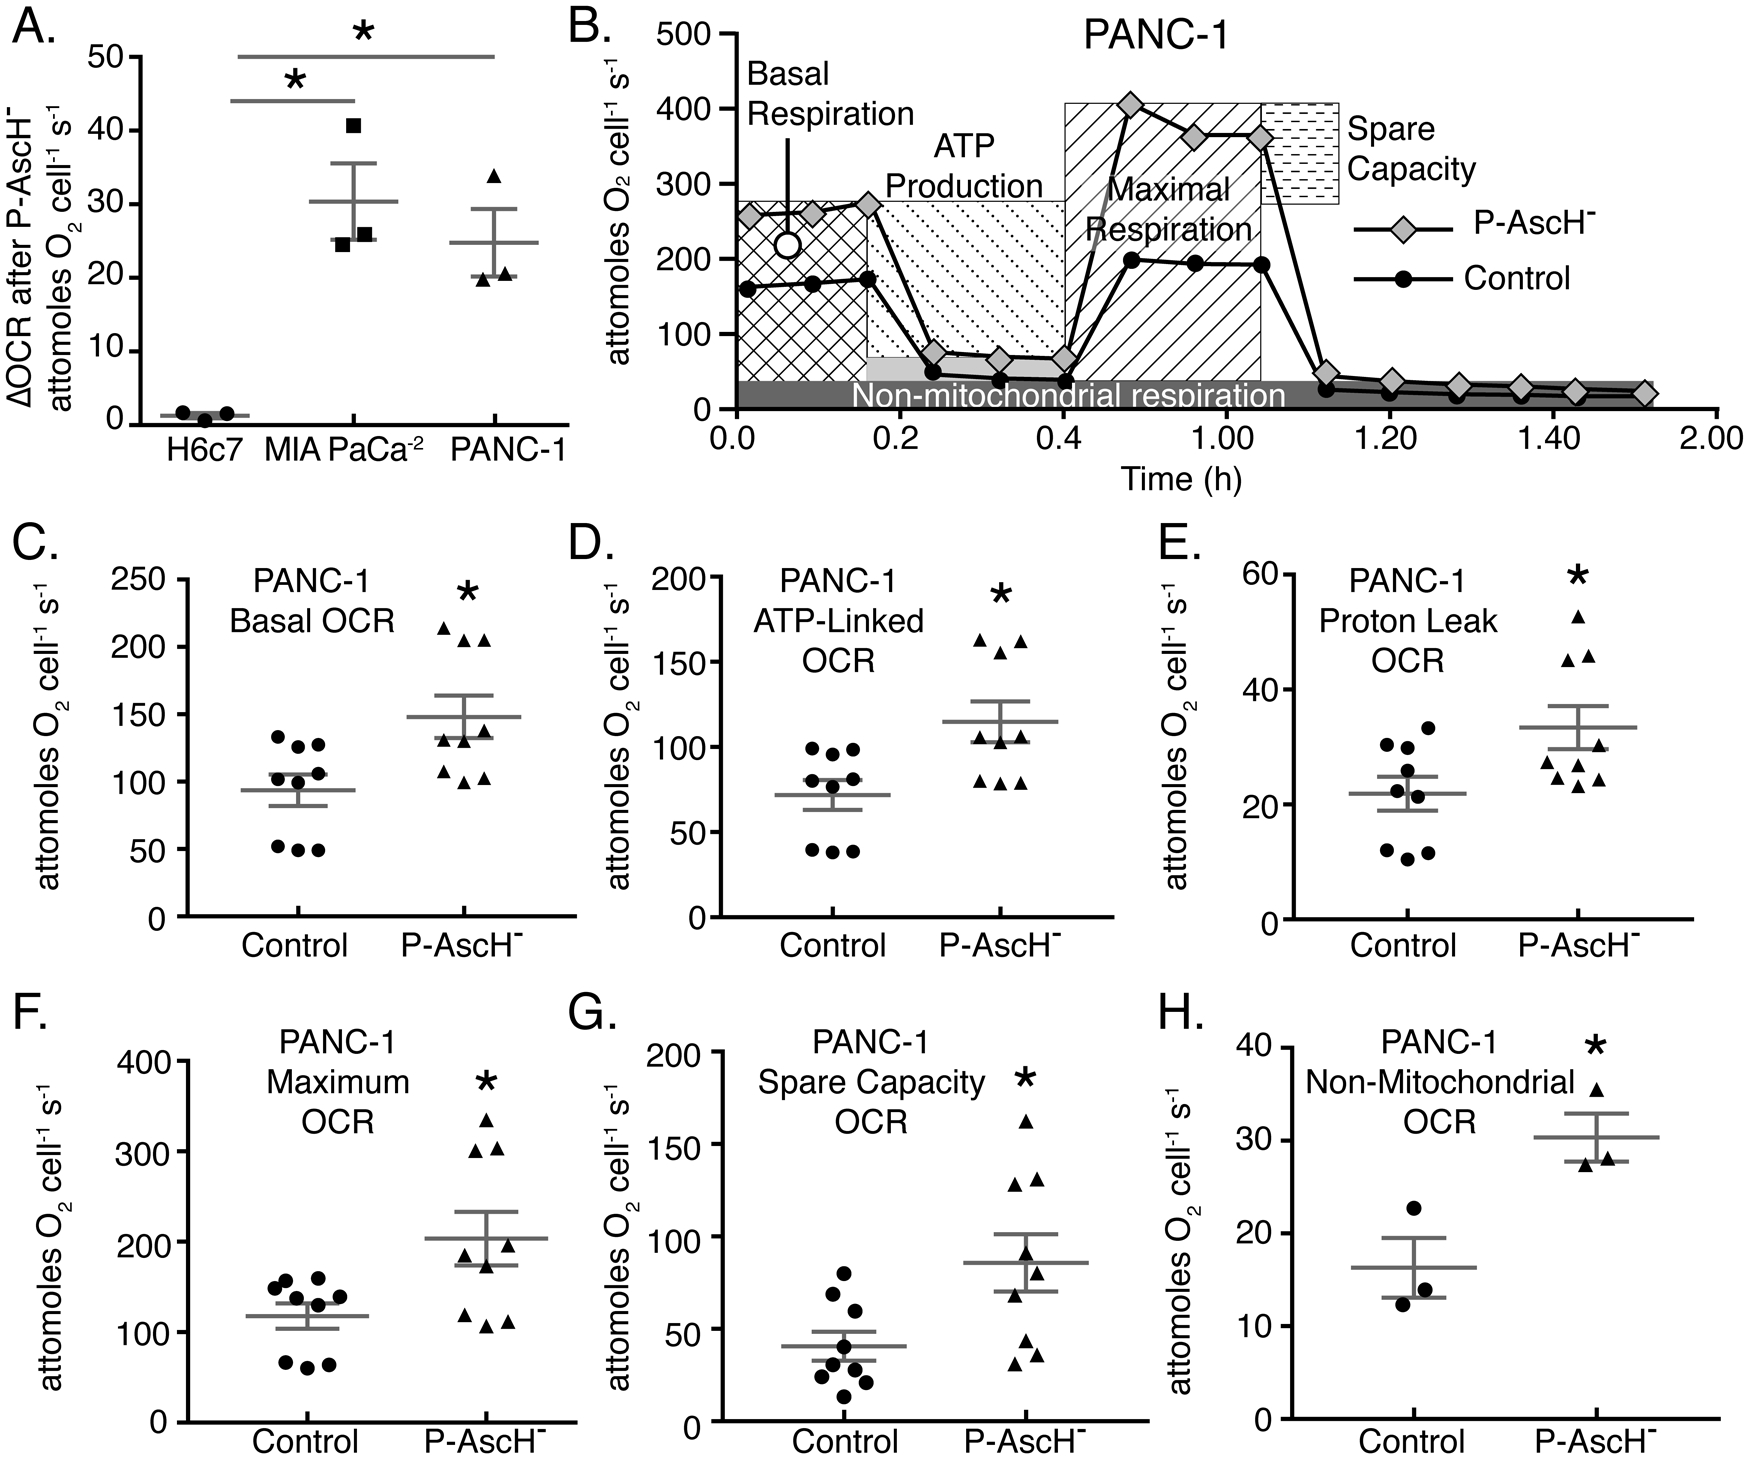
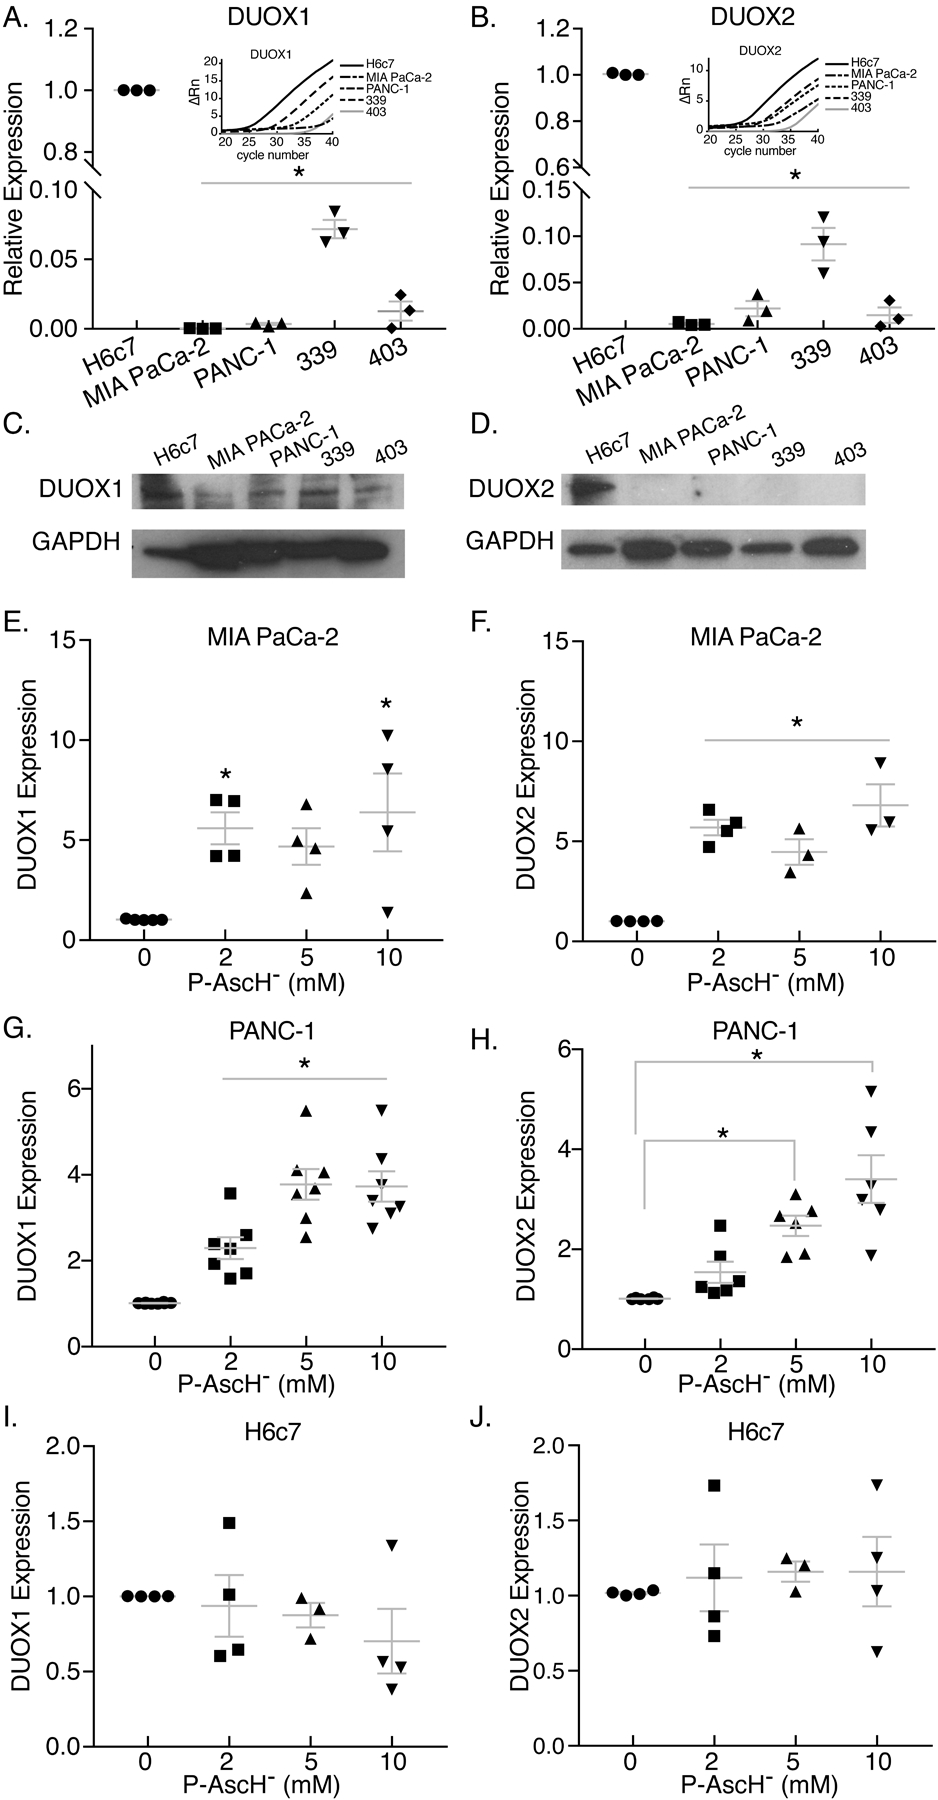
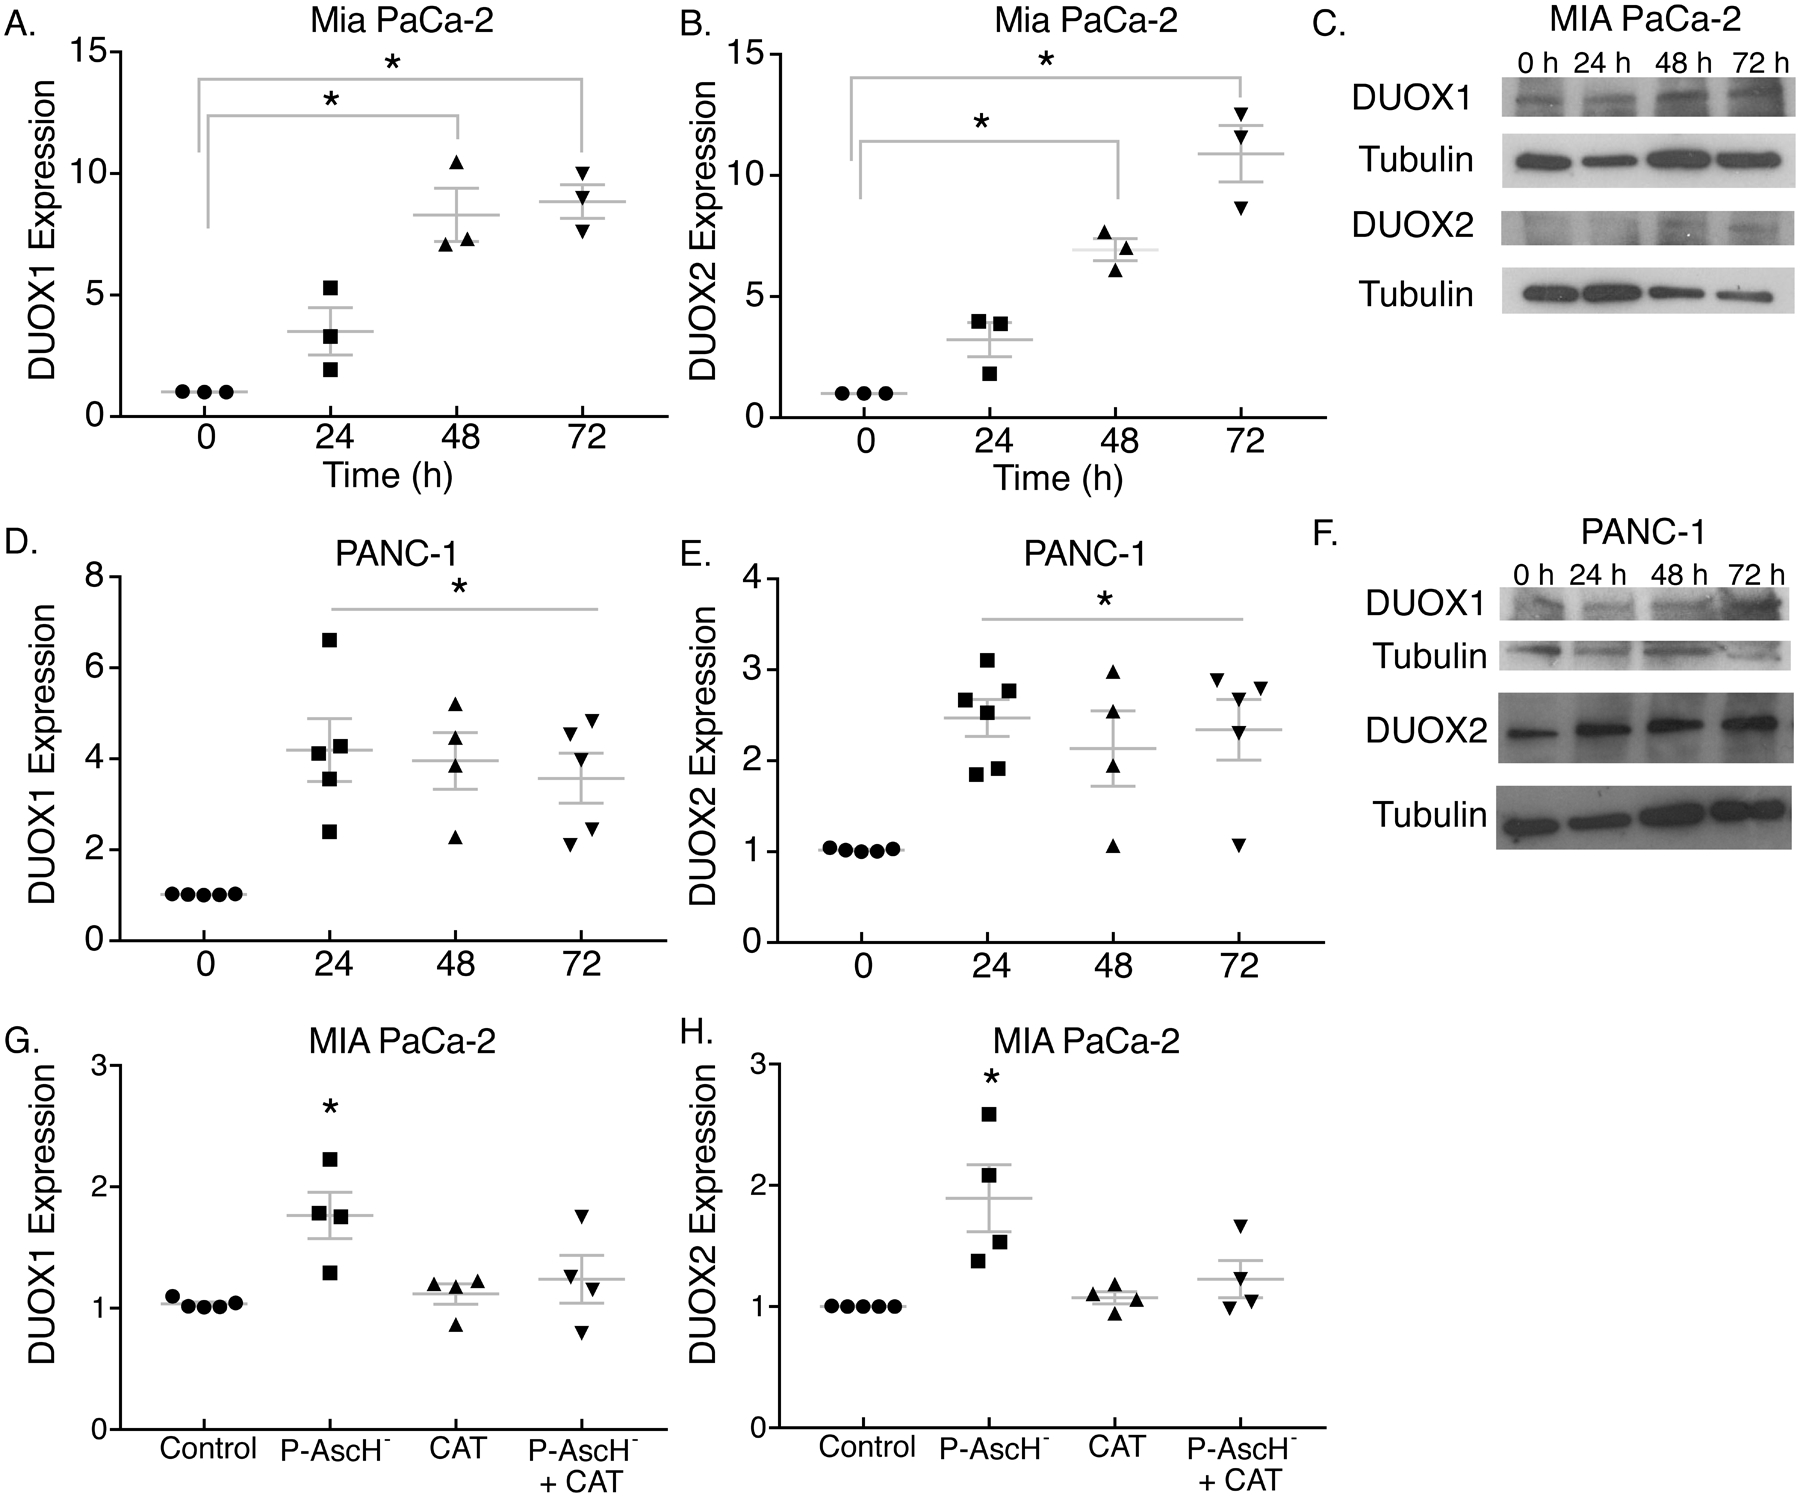
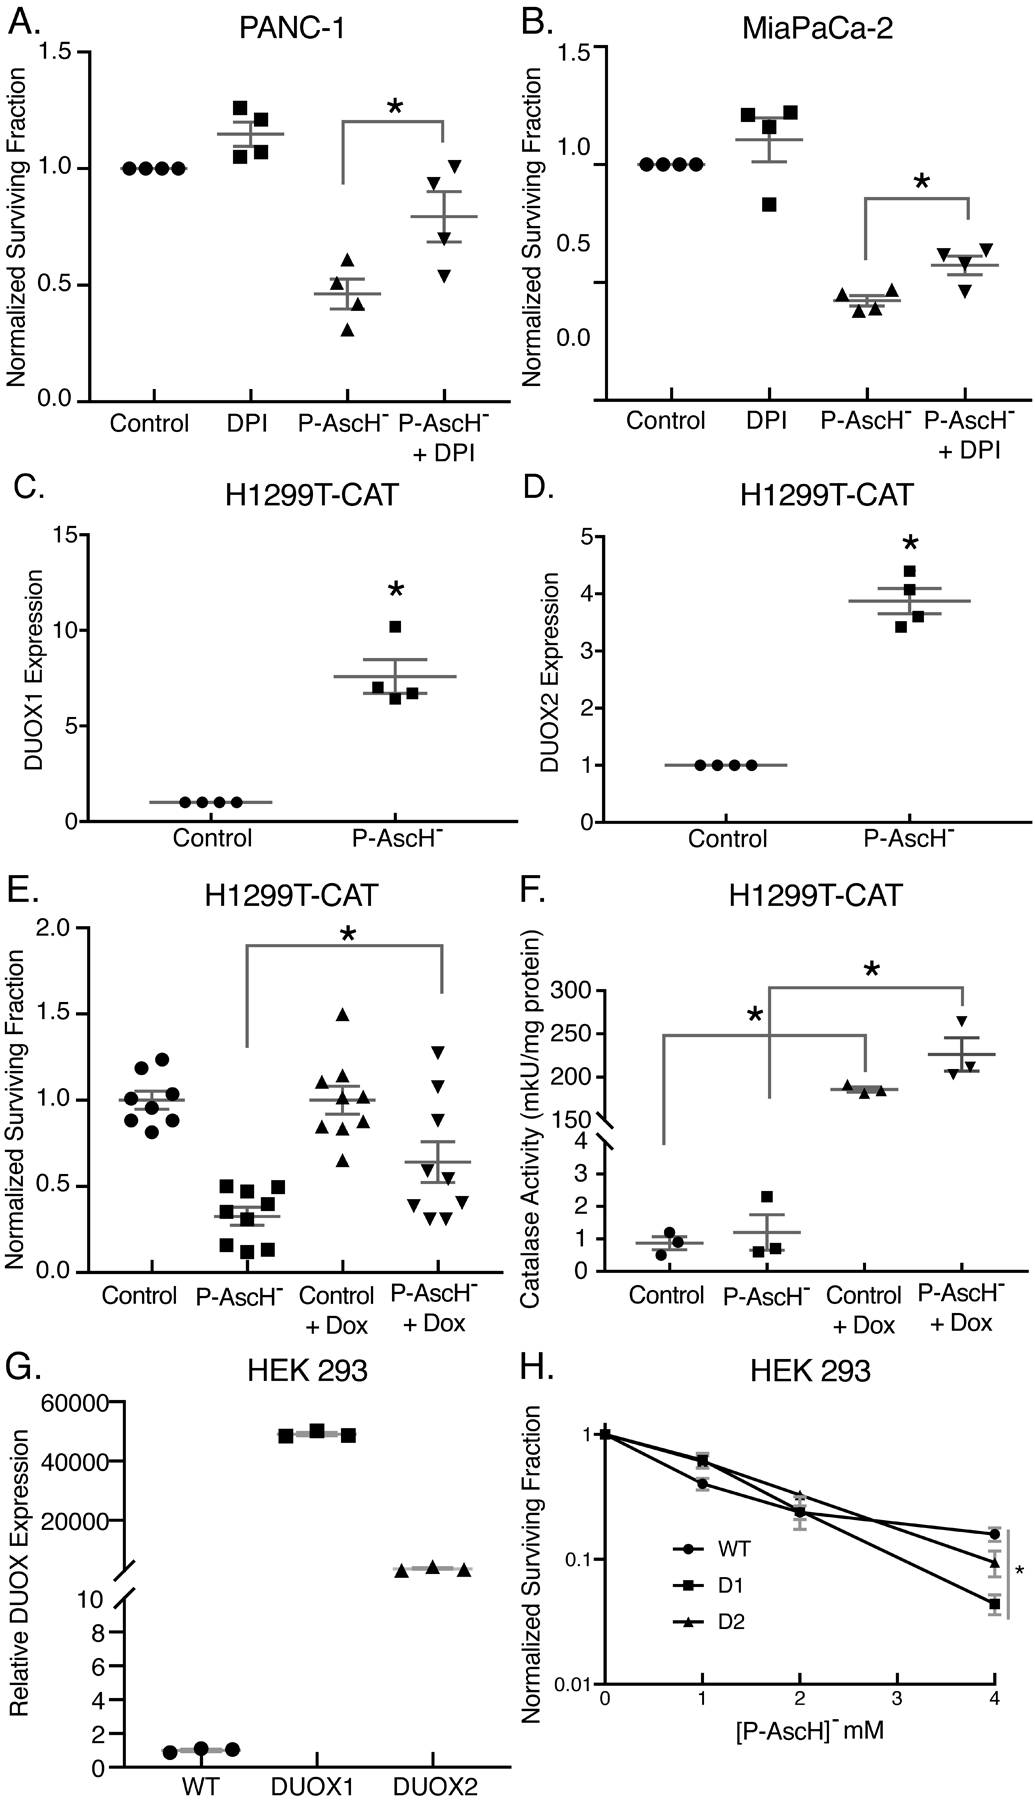
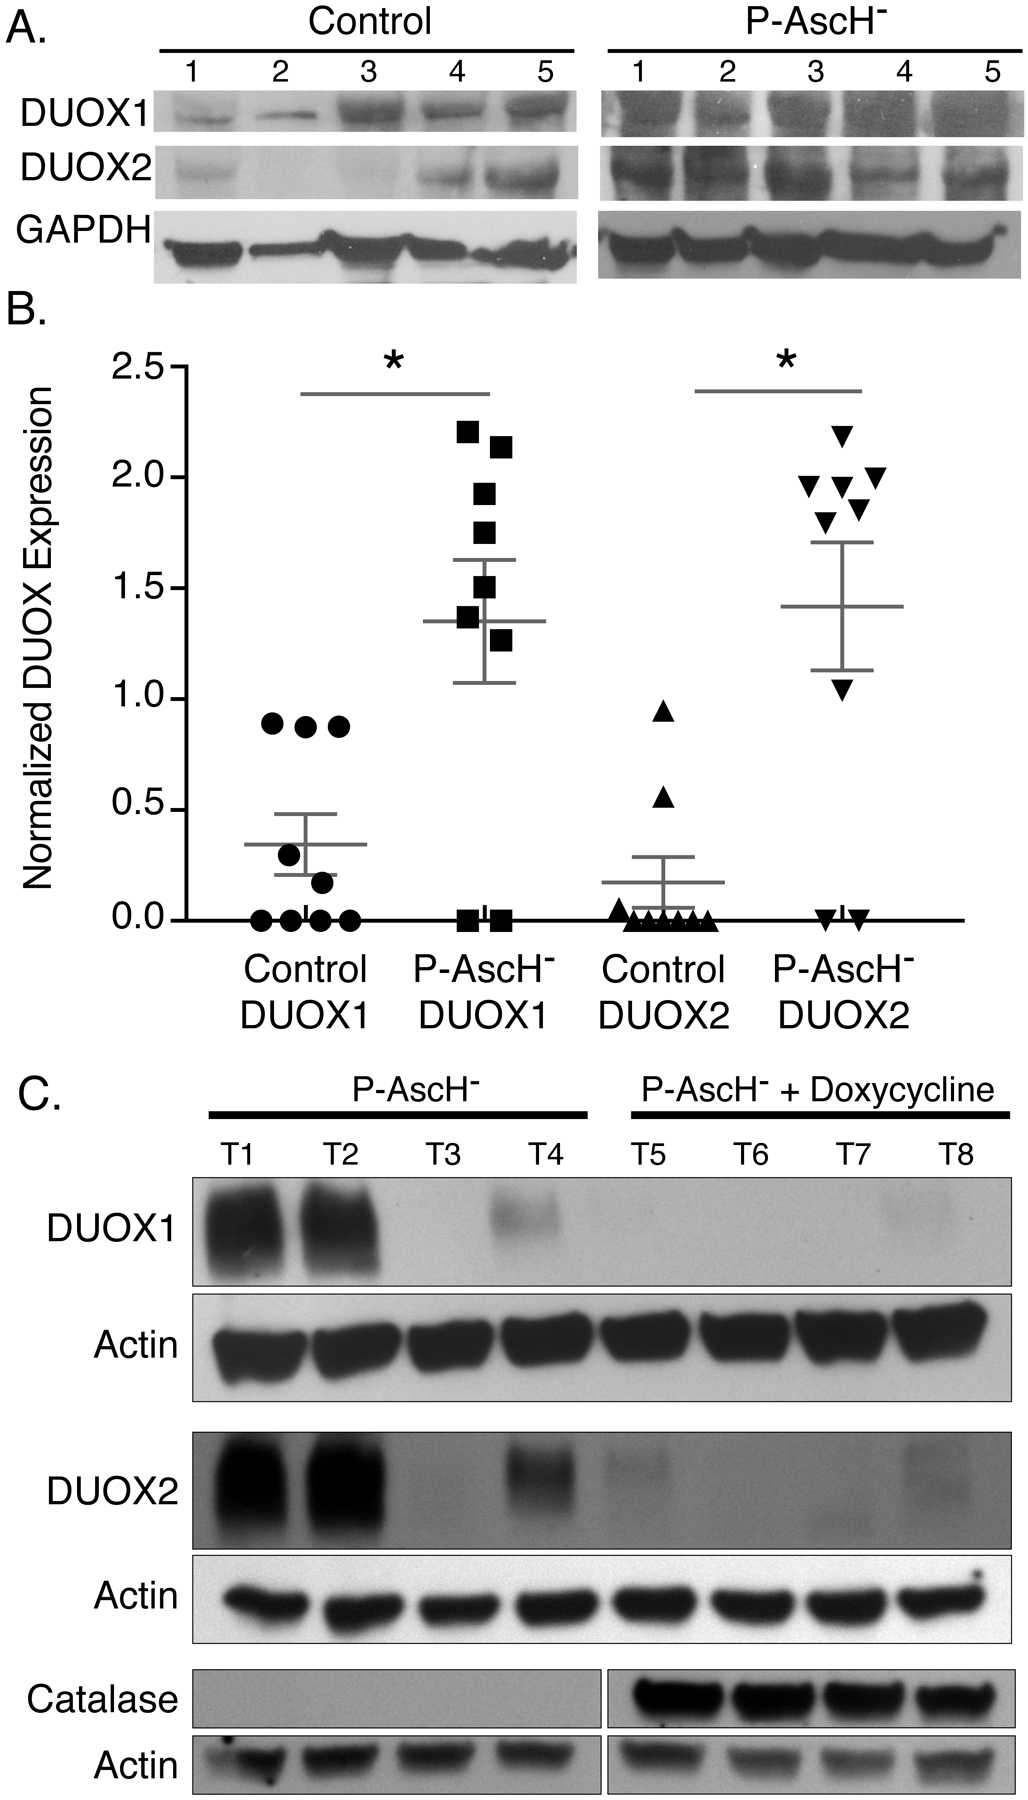
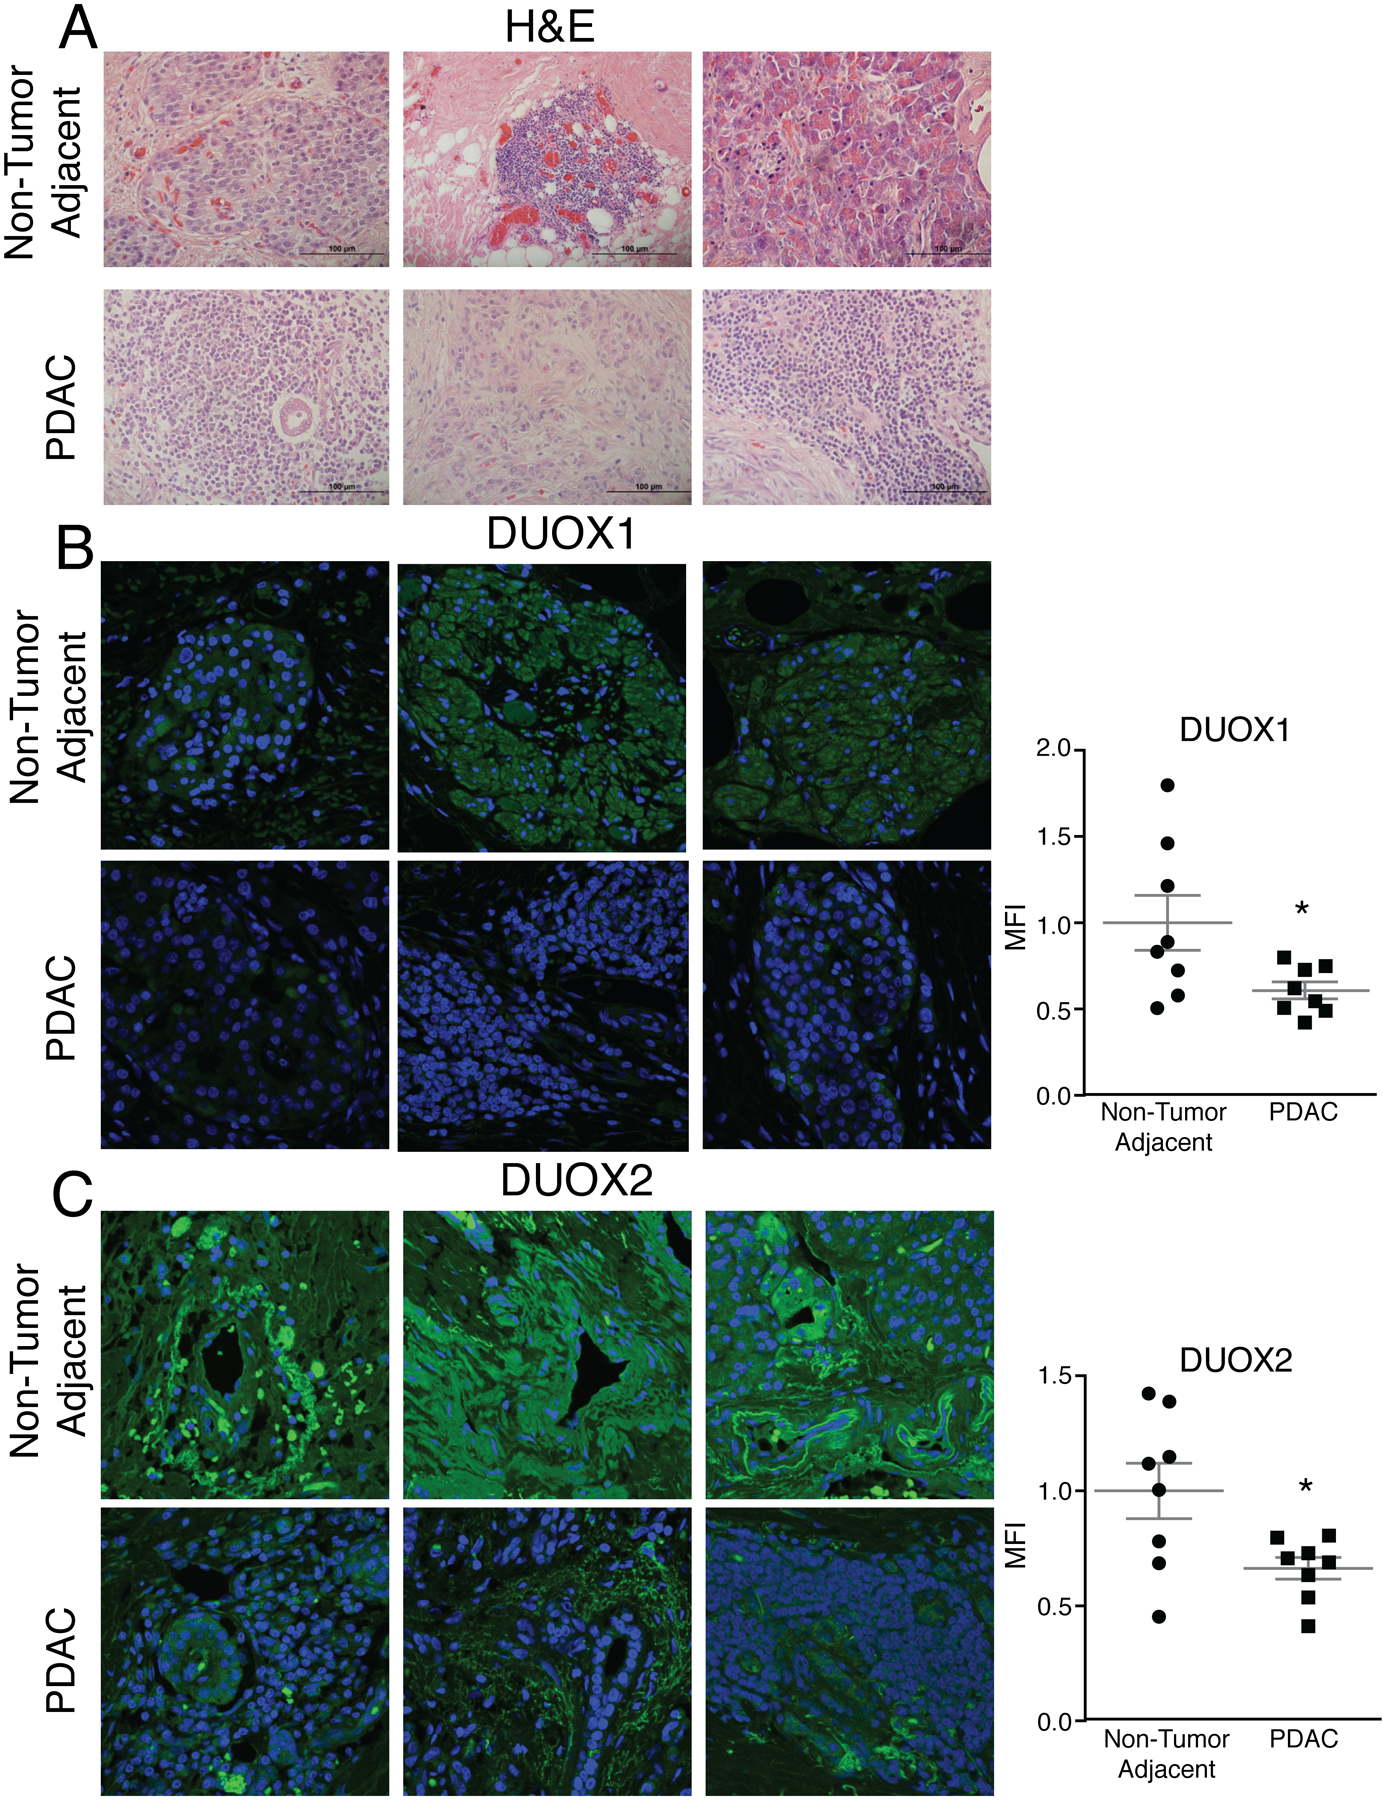
Pharmacologic ascorbate treatment (P-AscH-, high-dose, intravenous vitamin C) results in a transient short-term increase in the flux of hydrogen peroxide that is preferentially cytotoxic to cancer cells versus normal cells. This study examines whether an increase in hydrogen peroxide is sustained posttreatment and potential mechanisms involved in this process. Cellular bioenergetic profiling following treatment with P-AscH- was examined in tumorigenic and nontumorigenic cells. P-AscH- resulted in sustained increases in the rate of cellular oxygen consumption (OCR) and reactive oxygen species (ROS) in tumor cells, with no changes in nontumorigenic cells. Sources for this increase in ROS and OCR were DUOX 1 and 2, which are silenced in pancreatic ductal adenocarcinoma, but upregulated with P-AscH- treatment. An inducible catalase system, to test causality for the role of hydrogen peroxide, reversed the P-AscH--induced increases in DUOX, whereas DUOX inhibition partially rescued P-AscH--induced toxicity. In addition, DUOX was significantly downregulated in pancreatic cancer specimens compared with normal pancreas tissues. Together, these results suggest that P-AscH--induced toxicity may be enhanced by late metabolic shifts in tumor cells, resulting in a feed-forward mechanism for generation of hydrogen peroxide and induction of metabolic stress through enhanced DUOX expression and rate of oxygen consumption. SIGNIFICANCE: A high dose of vitamin C, in addition to delivering an acute exposure of H2O2 to tumor cells, activates DUOX in pancreatic cancer cells, which provide sustained production of H2O2.


Conflict of interest statement

The authors declare no potential conflicts of interest.

Figures

Figure 1.
Figure 1.. P-AscH increases ROS production 48 h after exposure, resulting in clonogenic cell death.
PDAC cell lines were treated with P-AscH for 1 h for all experiments. Assays were performed 48 h after exposure, unless stated otherwise. Presented are means ± SEM for each set, n = 3; *p < 0.05 vs. control for all experiments. For panels A - C and F - G, ANOVA with Tukey’s multiple comparisons were used. For panels D - E, 2-tailed student’s t-test was used. A. Time course (24 – 72 h) for the oxidation of DCFH-DA in PANC-1 cells treated with 2 mM ascorbate. Data is represented as mean fluorescent intensity (MFI) that is normalized to control. B-C. PANC-1 and MIA PaCa-2 cells treated with P-AscH (2 mM or 1 mM, respectively) exhibit increased DCFH-DA oxidation 48 h after treatment that is rescued by 100 μg/mL of bovine catalase in the medium. D-E. PANC-1 and MIA PaCa-2 cells treated with 2 mM or 1 mM ascorbate respectively, exhibited no changes in viability using the propidium iodide (PI) exclusion assay (p > 0.05). F-G. PANC-1 and MIA PaCa-2 cells treated with P-AscH (2 mM or 1 mM, respectively) exhibit significant decreases in clonogenic survival.
Figure 2.
Figure 2.. P-AscH treatment results in increased basal oxygen consumption rate, ATP linked, Maximal Respiration, and Proton leak in PDAC cell lines.
A. PANC-1, MIA PaCa-2, and H6c7 cells were treated with P-AscH for 1 h and basal oxygen consumption rate (OCR) was measured 48 h after treatment using a Clarke Electrode. Changes in OCR after P-AscH treatment were determined by subtracting the untreated basal OCR from the increase following P-AscH treatment to get ΔOCR. PANC-1 cells treated with 2 mM P-AscH, MIA PaCa-2 cells treated with 1 mM P-AscH and H6c7 cells treated with 2 mM P-AscH (Means ± SEM, n = 3, *p < 0.05 vs. control, ANOVA with Tukey’s multiple comparisons). B. Example data from Seahorse XF96 instrumentation showing that PANC-1 cells treated with P-AscH (2 mM) have alterations in the mitochondrial stress test curves 48 h after exposure. C-H. PANC-1 cells demonstrate an increase in: basal respiration; D. ATP production; E. proton leak; F. maximal respiration; G. spare capacity and H. non-mitochondrial respiration 48 h after treatment (Means ± SEM, n = 9 C-G and n = 3 H, p < 0.05 vs. control, 2-tailed student’s t-test).
Figure 3.
Figure 3.. DUOX1 and DUOX2 mRNA expression is decreased in PDAC cell lines compared to ductal epithelium in vitro and is increased in a dose-dependent manner after exposure to P-AscH.
MIA PaCa-2, PANC-1 and H6c7 ductal epithelial cells were exposed to varying doses of P-AscH for 1 h. mRNA expression was tested 24 h after exposure to P-AscH. For figures A-B and E-J: Means ± SEM, ANOVA with Tukey’s multiple comparisons used. A-B. DUOX1 and DUOX2 mRNA expression is decreased in PDAC cell lines MIA PaCa-2, PANC-1, 339, and 403 as compared to non-tumorigenic H6c7 cells (n = 3, *p < 0.05 vs. H6c7). C-D. DUOX1 and DUOX2 immunoreactive protein is decreased in PDAC cell lines as compared to non-tumorigenic H6c7 cells. Representative blots shown. E-F. DUOX1 and DUOX2 mRNA expression is increased in MIA PaCa-2 by increasing doses of P-AscH (n = 3–5, *p < 0.05 vs. 0 mM). G-H. DUOX1 and DUOX2 mRNA expression is increased in PANC-1 by increasing doses of P-AscH (n = 6–7, *p < 0.05 vs. 0 mM). I-J. DUOX1 and DUOX2 mRNA expression is unchanged in non-tumorigenic H6c7 cells by increasing doses of P-AscH (n = 3–4, p > 0.05 vs. 0 mM).
Figure 4.
Figure 4.. DUOX1 and DUOX2 expression is increased in a time dependent manner after exposure to P-AscH in PDAC cells.
MIA PaCa-2, PANC-1 and H6c7 ductal epithelial cells were exposed to P-AscH and DUOX expression determined at 0–72 h. For figures A-B, D-E, and G-J: Means ± SEM, ANOVA with Tukey’s multiple comparisons used. A-B. DUOX1 and DUOX2 mRNA expression is increased following P-AscH (5 mM) in MIA PaCa-2 cells (n = 3, *p < 0.05 vs. 0 h). C. DUOX1 and DUOX2 immunoreactive protein is increased in MIA PaCa-2 cells after P-AscH (5 mM). Representative blots shown. D-E. DUOX1 and DUOX2 mRNA expression is increased following P-AscH (5 mM) in PANC-1 cells (n = 4 – 5, *p < 0.05 vs. 0 h). F. DUOX1 and DUOX2 immunoreactive protein is increased in PANC-1 after P-AscH (5 mM). Representative blots shown. G-H. DUOX1 and DUOX2 mRNA expression is increased following P-AscH (1 mM) in MIA PaCa-2 cells and is reversed by pretreatment with 100 μg/mL bovine catalase. (n = 4, *p < 0.05 vs. control).
Figure 5.
Figure 5.. DUOX enhances P-AscH induced cytotoxicity in PDAC cell lines.
A-B. PANC-1 and MIA PaCa-2 cells were pretreated with DPI (5 μM) for 1 h prior to P-AscH treatment (2 mM and 1 mM, respectively) and a clonogenic survival assay was performed 48 h later (Means ± SEM, n = 4, *p < 0.05 vs. P-AscH, ANOVA with Tukey’s multiple comparisons). C-D. DUOX1 and DUOX2 mRNA expression is increased in H1299T-CAT cells 48 h following P-AscH treatment (5 mM) for 1 h (Means ± SEM, n = 4, *p < 0.05 vs. control, 2-tailed student’s t-test). E. H1299T-CAT cells were treated with 2 mM P-AscH for 1 h and 2 μg/mL doxycycline for 48 h before being plated in clonogenic survival assays. Over-expression of catalase demonstrated a partial reversal of P-AscH toxicity (Means ± SEM, n = 9, *p < 0.05 vs. P-AscH, ANOVA with Tukey’s multiple comparisons). F. Catalase over-expressing H1299T-CAT were tested for catalase activity following 48 h treatment with 2 μg/mL doxycycline (Means ± SEM, n = 3, *p < 0.05 control vs. Control + Dox and P-AscH vs. P-AscH + Dox, ANOVA with Tukey’s multiple comparisons). G. DUOX1 and DUOX2 over-expressing HEK 293 cells show increased DUOX1 and DUOX2 mRNA expression compared to control wild-type HEK 293 cells (Means ± SEM, n = 3, *p < 0.05 vs. WT, ANOVA with Tukey’s multiple comparisons). H. WT, DUOX1, and DUOX2 over-expressing cells were treated with P-AscH (0–4 mM) for 1 h and a clonogenic survival assay was performed (Means ± SEM, n = 3, *p < 0.05 vs. WT, ANOVA with Tukey’s multiple comparisons).
Figure 6.
Figure 6.. P-AscH treatment increases DUOX1 and DUOX2 expression in vivo.
A. Athymic nude mice with heterotopic MIA PaCa-2 xenografts were treated for 5 days with 4 g/kg I.P. ascorbate b.i.d. Western blotting was performed to analyze protein levels of DUOXs in xenograft tumors that were excised from control and P-AscH treated mice. DUOX1 and DUOX2 immunoreactive protein is increased in tumors of P-AscH treated mice compared to saline treated mice (Representative blots shown). B. Quantification of densitometric evaluation of western blots (Means ± SEM, n = 9, * p < 0.05 vs. controls, 2-tailed student’s t-test). C. Athymic nude mice with heterotopic H1299T-CAT xenografts were treated for 5 d with 4 g/kg I.P. ascorbate b.i.d. All mice were given 1% sucrose in their drinking water ± doxycycline (2 mg/mL). Tumors were excised, and western blotting was performed to analyze protein levels of DUOXs and catalase in xenografts. DUOX1 and DUOX2 immunoreactive protein is increased in tumors of P-AscH treated mice compared to mice in the P-AscH + doxycycline group. Catalase immunoreactive protein is increased in tumors from the P-AscH + doxycycline group compared to the P-AscH group. (Representative blots shown, n = 4 mice per group).
Figure 7.
Figure 7.. Resections for PDAC demonstrate differential expression of DUOX1 and DUOX2.
A. Hematoxylin and eosin staining performed on matched normal adjacent pancreas and PDAC from pancreaticoduodenectomy specimens demonstrated changes in morphology between normal adjacent and PDAC. Representative images shown. B-C. DUOX1 and DUOX2 immunofluorescence staining was performed on non-tumor adjacent pancreas and PDAC in matched patient samples. Samples were visualized using a Zeiss Confocal Microscope 40x oil objective. Results show decreased DUOX1 and DUOX2 fluorescence in PDAC and increased DUOX1 and DUOX2 fluorescence in normal adjacent pancreas. Green staining is DUOX1/DUOX2 and blue staining is for nuclear Toppiosmerase-3. Representative images shown along with quantification demonstrating normalized mean fluorescence intensity (MFI) (Means ± SEM, n = 8, *p < 0.05 vs. adjacent normal, 2-tailed student’s t-test).

Similar articles

Cited by

References

    1. Welsh JL, Wagner BA, van’t Erve TJ, Zehr PS, Berg DJ, Halfdanarson TR, et al. Pharmacological ascorbate with gemcitabine for the control of metastatic and node-positive pancreatic cancer (PACMAN): results from a phase I clinical trial. Cancer chemotherapy and pharmacology. 2013;71(3):765–75. - PMC - PubMed
    1. Ma Y, Chapman J, Levine M, Polireddy K, Drisko J, Chen Q. High-dose parenteral ascorbate enhanced chemosensitivity of ovarian cancer and reduced toxicity of chemotherapy. Science translational medicine. 2014;6(222):222ra18. - PubMed
    1. Padayatty SJ, Sun H, Wang Y, Riordan HD, Hewitt SM, Katz A, et al. Vitamin C pharmacokinetics: implications for oral and intravenous use. Annals of internal medicine. 2004;140(7):533–7. - PubMed
    1. Schoenfeld JD, Sibenaller ZA, Mapuskar KA, Wagner BA, Cramer-Morales KL, Furqan M, et al. O2(−) and H2O2-Mediated Disruption of Fe Metabolism Causes the Differential Susceptibility of NSCLC and GBM Cancer Cells to Pharmacological Ascorbate. Cancer cell. 2017;32(2):268. - PubMed
    1. Polireddy K, Dong R, Reed G, Yu J, Chen P, Williamson S, et al. High Dose Parenteral Ascorbate Inhibited Pancreatic Cancer Growth and Metastasis: Mechanisms and a Phase I/IIa study. Scientific reports. 2017;7(1):17188. - PMC - PubMed

Publication types

MeSH terms