

Can network science reveal structure in a complex healthcare system? A network analysis using data from emergency surgical services
- PMID: 32041860
- PMCID: PMC7044848
- DOI: 10.1136/bmjopen-2019-034265
Can network science reveal structure in a complex healthcare system? A network analysis using data from emergency surgical services
Abstract
Introduction: Hospitals are complex systems and optimising their function is critical to the provision of high quality, cost effective healthcare. Metrics of performance have to date focused on the performance of individual elements rather than the whole system. Manipulation of individual elements of a complex system without an integrative understanding of its function is undesirable and may lead to counterintuitive outcomes and a holistic metric of hospital function might help design more efficient services.
Objectives: We aimed to use network analysis to characterise the structure of the system of perioperative care for emergency surgical admissions in our tertiary care hospital.
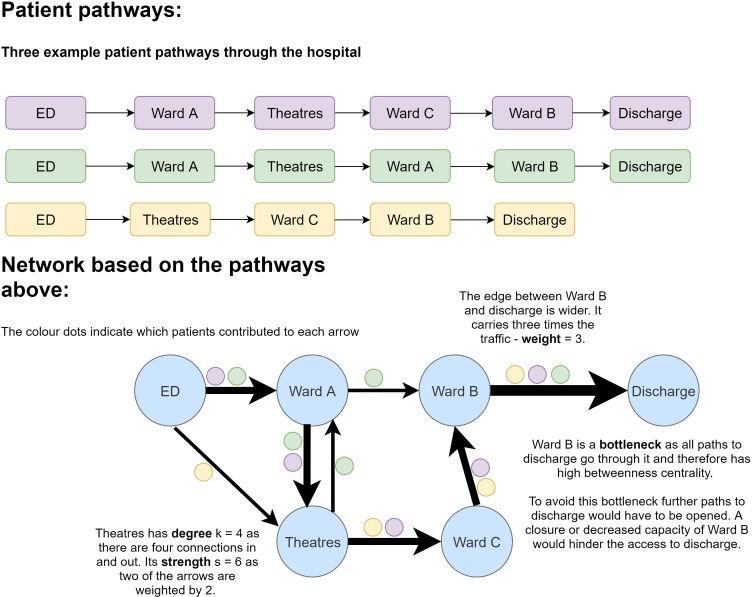
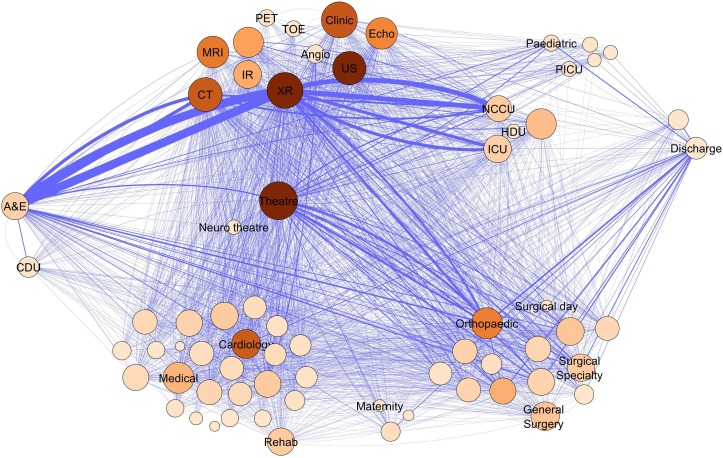
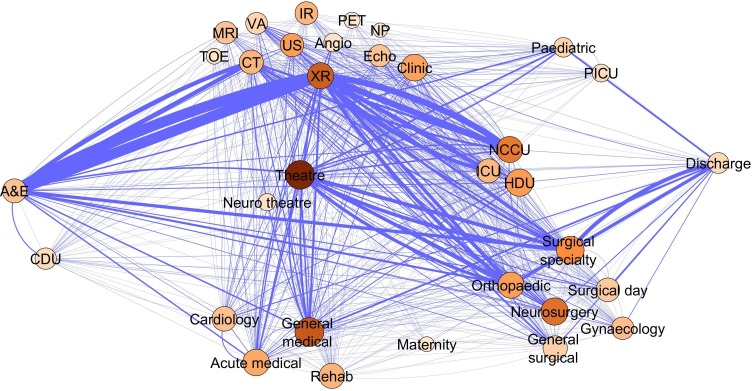
Design: We constructed a weighted directional network representation of the emergency surgical services using patient location data from electronic health records.
Setting: A single-centre tertiary care hospital in the UK.
Participants: We selected data from the retrospective electronic health record data of all unplanned admissions with a surgical intervention during their stay during a 3.5-year period, which resulted in a set of 16 500 individual admissions.
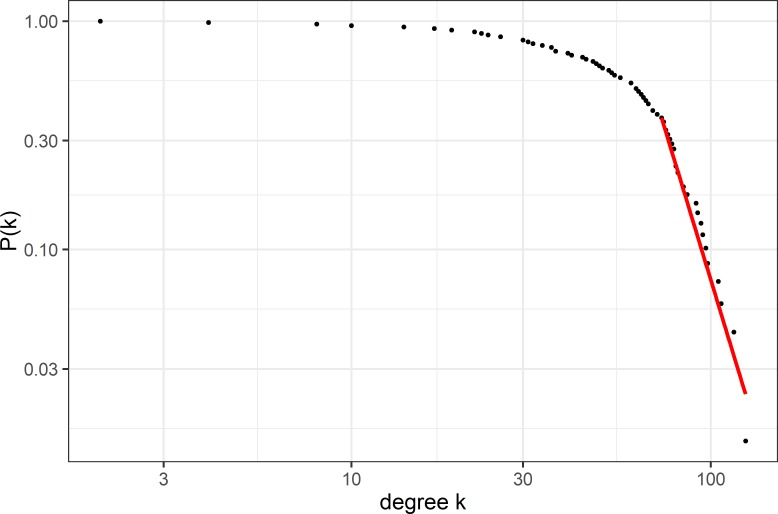
Methods: We then constructed and analysed the structure of this network using established methods from network science such as degree distribution, betweenness centrality and small-world characteristics.
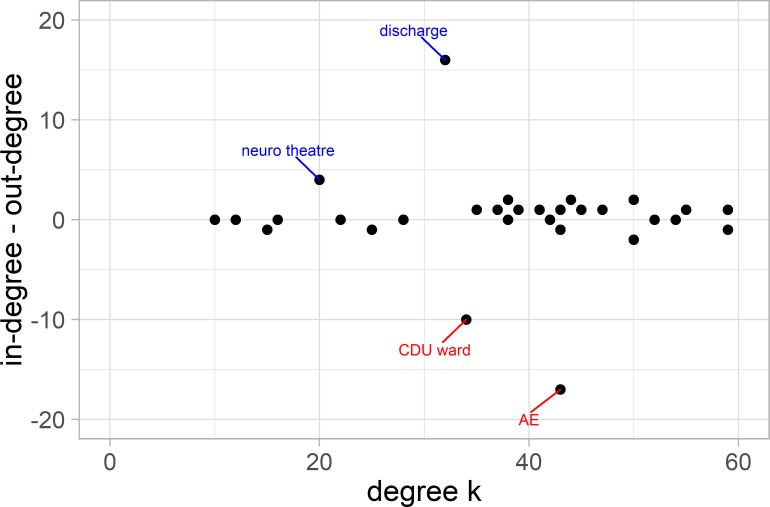
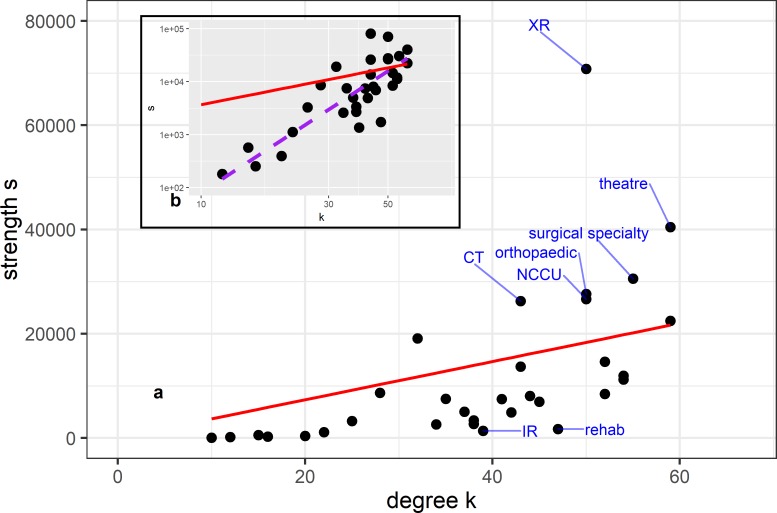
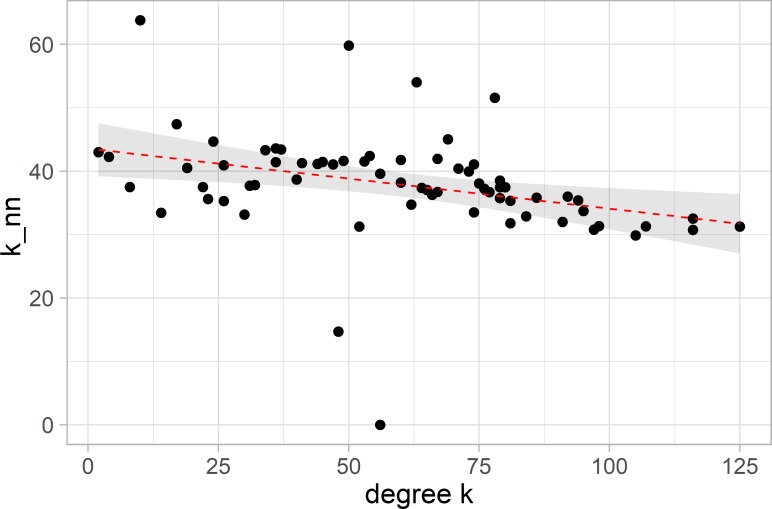
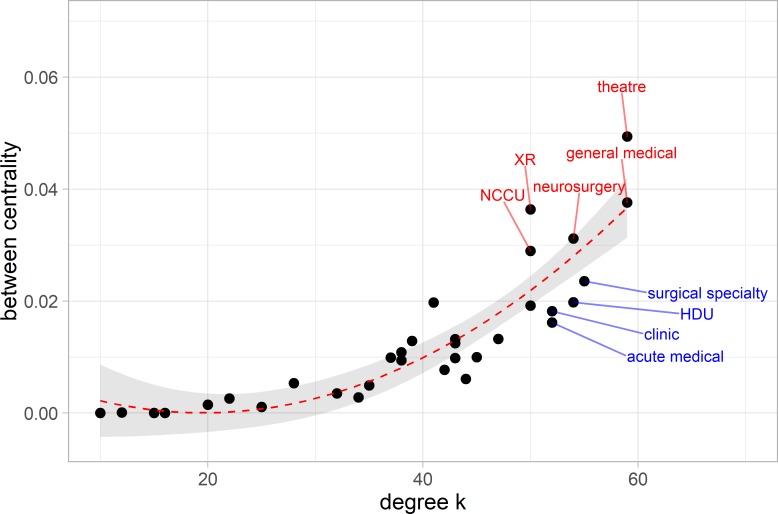
Results: The analysis showed the service to be a complex system with scale-free, small-world network properties. We also identified such potential hubs and bottlenecks in the system.
Conclusions: Our holistic, system-wide description of a hospital service may provide tools to inform service improvement initiatives and gives us insights into the architecture of a complex system of care. The implications for the structure and resilience of the service is that while being robust in general, the system may be vulnerable to outages at specific key nodes.
Keywords: adult anaesthesia; adult intensive & critical care; health informatics; health services administration & management; organisation of health services.
© Author(s) (or their employer(s)) 2020. Re-use permitted under CC BY. Published by BMJ.
Conflict of interest statement
Competing interests: None declared.
Figures
Similar articles
-
Critical Care Network in the State of Qatar.Qatar Med J. 2019 Nov 7;2019(2):2. doi: 10.5339/qmj.2019.qccc.2. eCollection 2019. Qatar Med J. 2019. PMID: 31763205 Free PMC article.
-
Impact of introduction of an acute surgical unit on management and outcomes of small bowel obstruction.ANZ J Surg. 2016 Oct;86(10):831-835. doi: 10.1111/ans.13238. Epub 2015 Jul 24. ANZ J Surg. 2016. PMID: 26207527
-
Auditing surgical service provision at a South African tertiary institution: Implications for the development of district services.S Afr J Surg. 2017 Nov;55(4):31-35. S Afr J Surg. 2017. PMID: 29227054
-
The standards for emergency surgical services.J R Soc Med. 2001;94 Suppl 39(Suppl 39):13-5. J R Soc Med. 2001. PMID: 11383422 Free PMC article. Review.
-
Acute surgical unit: the Australasian experience.ANZ J Surg. 2014 Jan-Feb;84(1-2):25-30. doi: 10.1111/ans.12473. Epub 2013 Nov 28. ANZ J Surg. 2014. PMID: 24286175 Review.
Cited by
-
Modular structures and the delivery of inpatient care in hospitals: a Network Science perspective on healthcare function and dysfunction.BMC Health Serv Res. 2022 Dec 10;22(1):1503. doi: 10.1186/s12913-022-08865-8. BMC Health Serv Res. 2022. PMID: 36494814 Free PMC article.
-
Using network analysis to model the effects of the SARS Cov2 pandemic on acute patient care within a healthcare system.Sci Rep. 2022 Jun 16;12(1):10050. doi: 10.1038/s41598-022-14261-3. Sci Rep. 2022. PMID: 35710694 Free PMC article.
-
Social network analysis of nationwide interhospital emergency department transfers in Taiwan.Sci Rep. 2023 Feb 9;13(1):2311. doi: 10.1038/s41598-023-29554-4. Sci Rep. 2023. PMID: 36759680 Free PMC article.
-
Making sense of the French public hospital system: a network-based approach to hospital clustering using unsupervised learning methods.BMC Health Serv Res. 2021 Nov 17;21(1):1244. doi: 10.1186/s12913-021-07215-4. BMC Health Serv Res. 2021. PMID: 34789235 Free PMC article.
-
Systems approach to improving traumatic brain injury care in Myanmar: a mixed-methods study from lived experience to discrete event simulation.BMJ Open. 2022 May 9;12(5):e059935. doi: 10.1136/bmjopen-2021-059935. BMJ Open. 2022. PMID: 35534061 Free PMC article.
References
-
- NHS England and NHS Digital Hospital accident and emergency activity, 2018.
-
- Khanna S, Boyle J, Good N, et al. . Hospital level analysis to improve patient flow. Stud Health Technol Inform 2013;188:65–71. - PubMed
Publication types
MeSH terms
LinkOut - more resources
Full Text Sources
Medical