. 2020 Feb 25;117(8):4211-4217.
doi: 10.1073/pnas.1913007117. Epub 2020 Feb 10.

Recent responses to climate change reveal the drivers of species extinction and survival

Affiliations

Recent responses to climate change reveal the drivers of species extinction and survival

Cristian Román-Palacios et al. Proc Natl Acad Sci U S A. .

Abstract

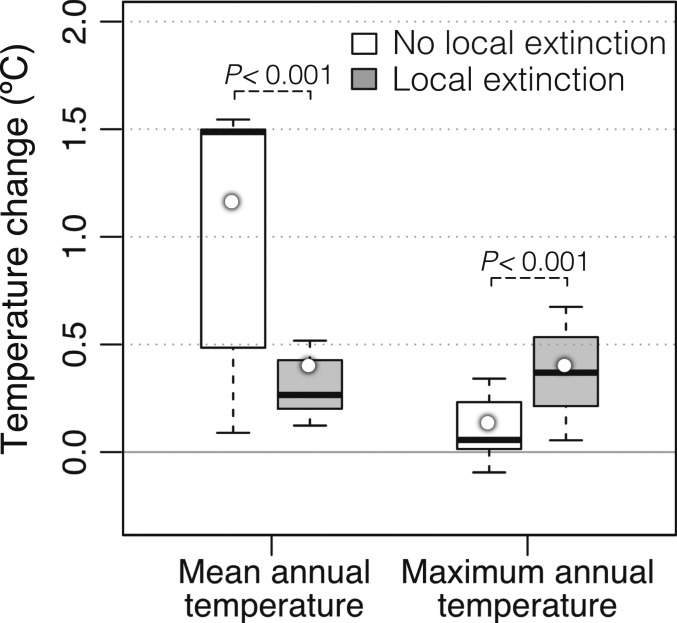
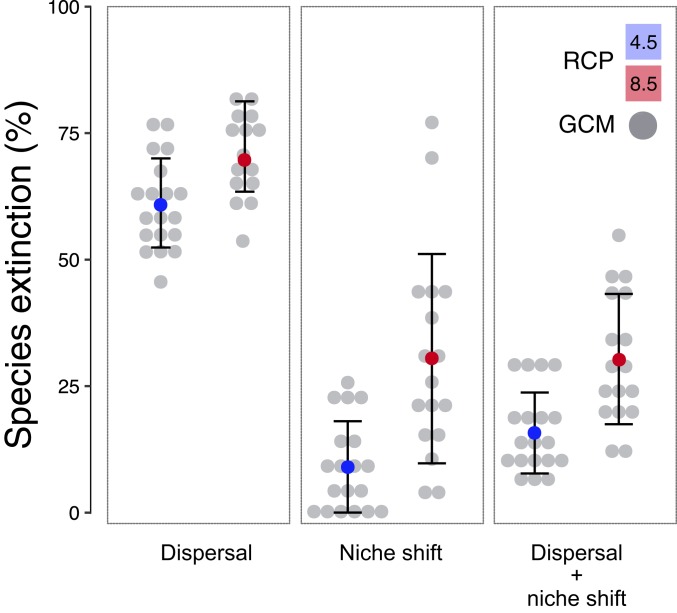
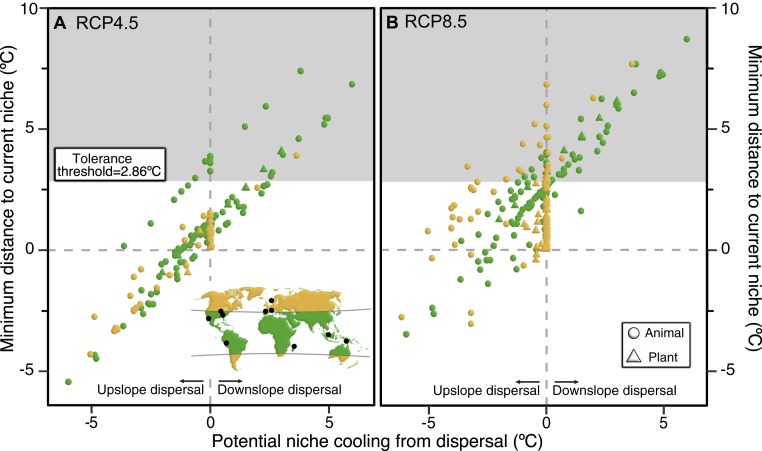
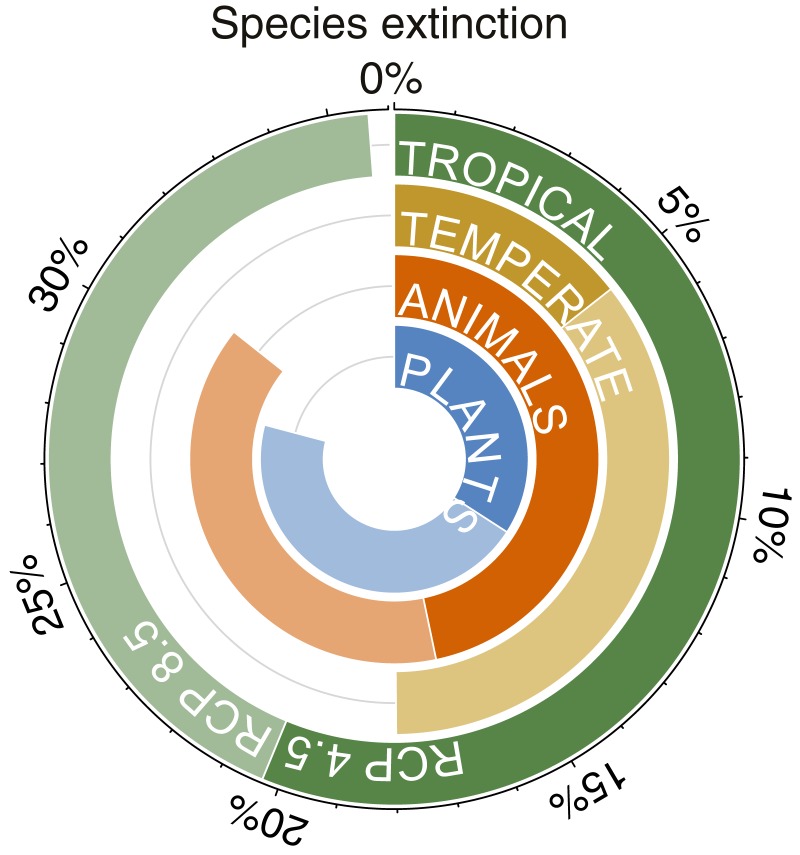
Climate change may be a major threat to biodiversity in the next 100 years. Although there has been important work on mechanisms of decline in some species, it generally remains unclear which changes in climate actually cause extinctions, and how many species will likely be lost. Here, we identify the specific changes in climate that are associated with the widespread local extinctions that have already occurred. We then use this information to predict the extent of future biodiversity loss and to identify which processes may forestall extinction. We used data from surveys of 538 plant and animal species over time, 44% of which have already had local extinctions at one or more sites. We found that locations with local extinctions had larger and faster changes in hottest yearly temperatures than those without. Surprisingly, sites with local extinctions had significantly smaller changes in mean annual temperatures, despite the widespread use of mean annual temperatures as proxies for overall climate change. Based on their past rates of dispersal, we estimate that 57-70% of these 538 species will not disperse quickly enough to avoid extinction. However, we show that niche shifts appear to be far more important for avoiding extinction than dispersal, although most studies focus only on dispersal. Specifically, considering both dispersal and niche shifts, we project that only 16-30% of these 538 species may go extinct by 2070. Overall, our results help identify the specific climatic changes that cause extinction and the processes that may help species to survive.

Keywords: climate change; disperal; extinction; niche shift.


Conflict of interest statement

The authors declare no competing interest.

Figures

Fig. 1.
Fig. 1.
Changes in temperature over time at sites with and without local extinction. We illustrate two of the strongest predictors of local extinction across the 581 sites. Quantifying the change in these variables over time (between surveys) at each site shows that those sites with local extinction had significantly larger increases in maximum annual temperatures but significantly smaller changes in mean annual temperatures. Boxes are bounded by the first (25th percentile) and third quartiles (75th percentile). Bottom and top whiskers depict minimum and maximum values. Thick lines within boxes depict median values, and means are circles within boxes. Statistical results are summarized in SI Appendix, Table S3. Data are presented in Dataset S3.
Fig. 2.
Fig. 2.
Projected species-level extinction from climate change when species respond by dispersal, niche shifts, or both. We show the percentage of the 538 sampled species that are predicted to go extinct (within their transects) by 2070. These results suggest that niche shifts are far more important for avoiding species-level extinction than dispersal. Different projections of future climates are shown, including the mean across different GCMs (gray data points) for each RCP (blue circle, RCP4.5; red circle, RCP8.5), along with error bars (SD). For dispersal, we consider upward dispersal to be limited by mountaintop height, and we assume that species that did not disperse upwards previously will not disperse upwards in the future. Alternative scenarios give identical results. Niche shifts assume a 95% extinction threshold. Full results are summarized in SI Appendix, Tables S8–S10.
Fig. 3.
Fig. 3.
Projected species-level extinctions among 538 plant and animal species by 2070. Each datapoint (circle, triangle) represents one species. Species are from sites considered subtropical/tropical (green; <35° absolute latitude) or temperate/arctic (yellow). We assume an intermediate level of climate change (RCP4.5) (A) and high level of climate change (RCP8.5) (B). The y axis is the difference between the projected maximum annual temperature at the current coldest site in each species’ range and the current value at the warmest site. Positive values indicate the current niche will not occur in the species current distribution in 2070. The x axis is the cooling gained through upward dispersal, based on species’ past rates of upward dispersal. Many species failed to disperse (zeroes) or moved downslope (positive values). We assumed these species would fail to move upwards in the future, but alternative analyses assumed all species would move upwards (SI Appendix, Table S10). Most species cannot tolerate increases in maximum temperatures >2.860 °C (0.95 threshold). Therefore, species in the gray shaded areas are projected to go extinct, even after upward dispersal. These include 16% (A) and 30% (B) of the 538 species (RCP 4.5, RCP8.5; means across GCMs). Two species with rapid downward dispersal (predicted to go extinct by 2070) are not depicted here. Full results in Datasets S8–S10 and SI Appendix, Table S10.
Fig. 4.
Fig. 4.
Projections for species-level extinction summarized for different climatic regions and taxonomic groups. We estimated the percentage of tropical, temperate, plant, and animal species in our dataset (n = 538) that are projected to go extinct within their transects by 2070. Extinctions are projected to be especially widespread in tropical regions and among animal species. We summarize results under two alternative RCPs (darker colors, RCP4.5; lighter colors, RCP8.5), based on the means across GCMs for each RCP (note that projected extinction is much more extensive under some GCMs, including up to 55% of all species; Fig. 2). These analyses assumed that species can both disperse (given their past dispersal rates) and shift their climatic niches. The results shown assume that species that did not disperse upwards previously will not disperse upwards in the future, that dispersal is constrained by mountaintop height, and a 95% extinction threshold. Results under alternative assumptions are similar and are given in SI Appendix, Table S10.

Comment in

Similar articles

Cited by

References

    1. Thomas C. D., et al. , Extinction risk from climate change. Nature 427, 145–148 (2004). - PubMed
    1. Loarie S. R., et al. , The velocity of climate change. Nature 462, 1052–1055 (2009). - PubMed
    1. Pimm S. L., Climate disruption and biodiversity. Curr. Biol. 19, R595–R601 (2009). - PubMed
    1. Warren R., et al. , Quantifying the benefit of early climate change mitigation in avoiding biodiversity loss. Nat. Clim. Chang. 3, 678–682 (2013).
    1. Urban M. C., Accelerating extinction risk from climate change. Science 348, 571–573 (2015). - PubMed

Publication types