. 2020 Feb 25;117(8):4347-4357.
doi: 10.1073/pnas.1917531117. Epub 2020 Feb 10.

miR-196b-5p-mediated downregulation of TSPAN12 and GATA6 promotes tumor progression in non-small cell lung cancer

Affiliations

miR-196b-5p-mediated downregulation of TSPAN12 and GATA6 promotes tumor progression in non-small cell lung cancer

Guang Liang et al. Proc Natl Acad Sci U S A. .

Abstract

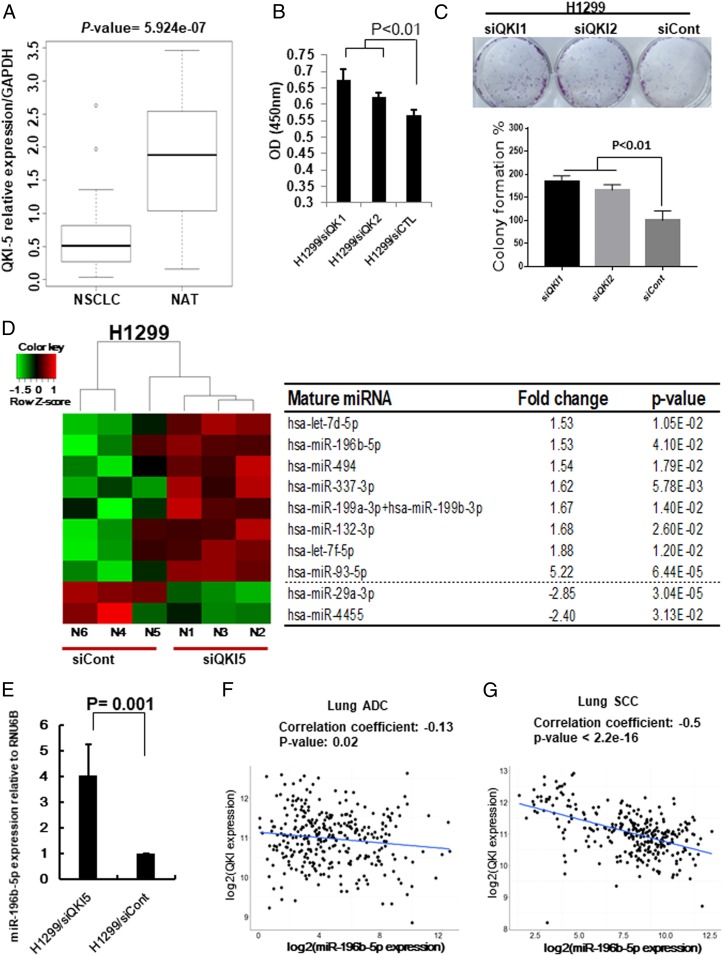
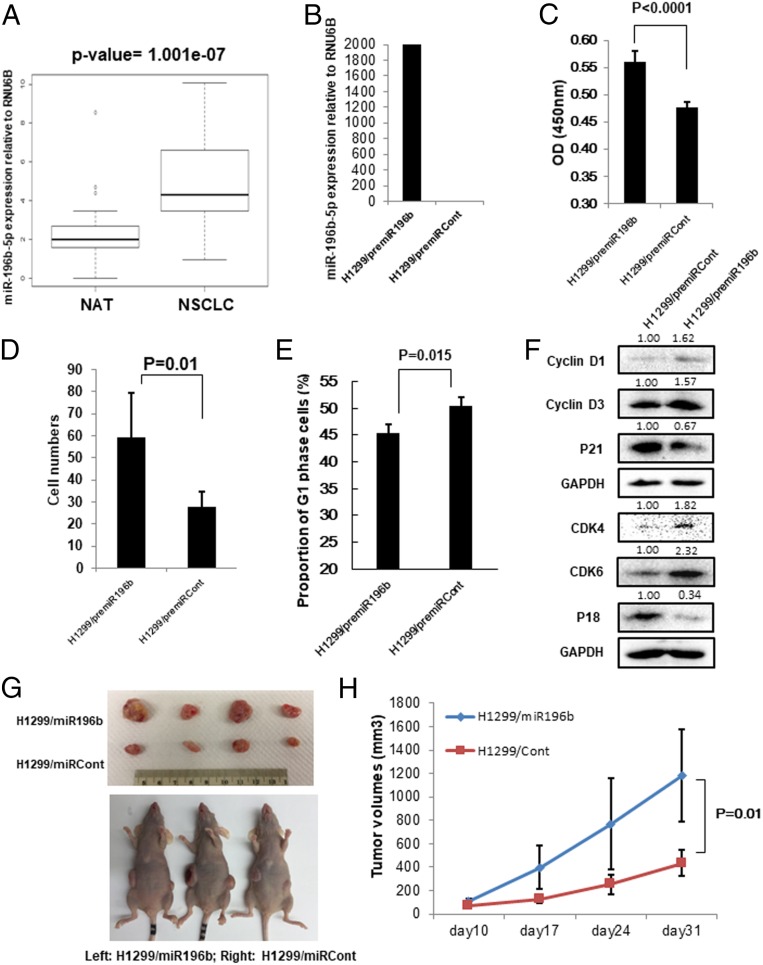
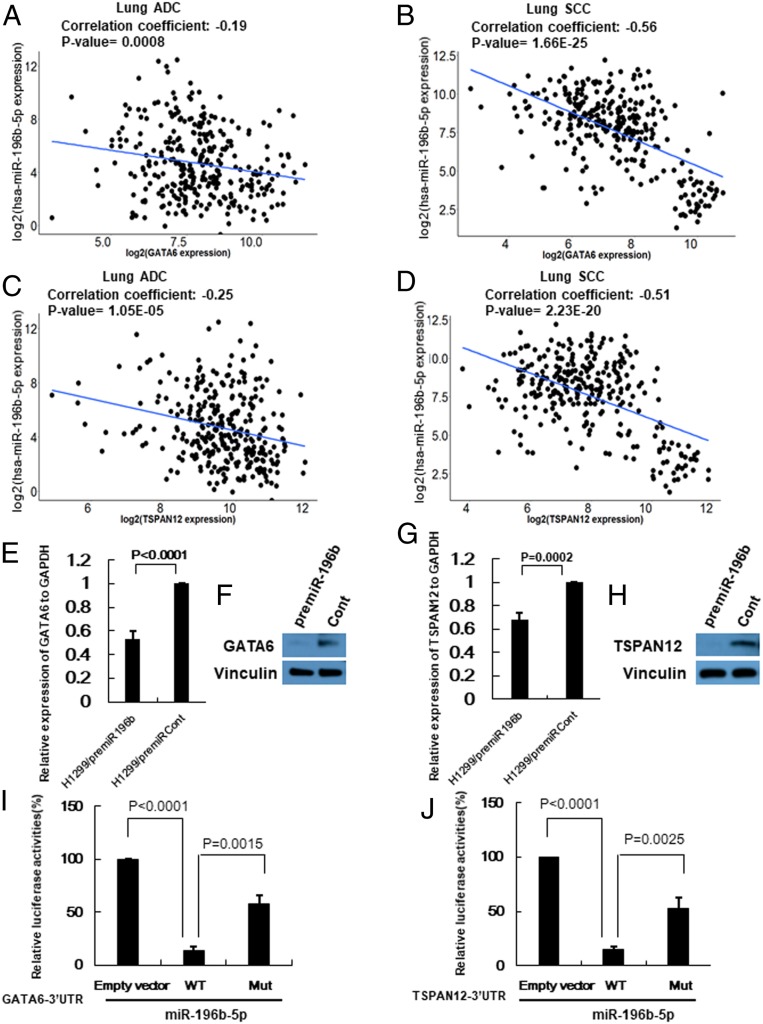
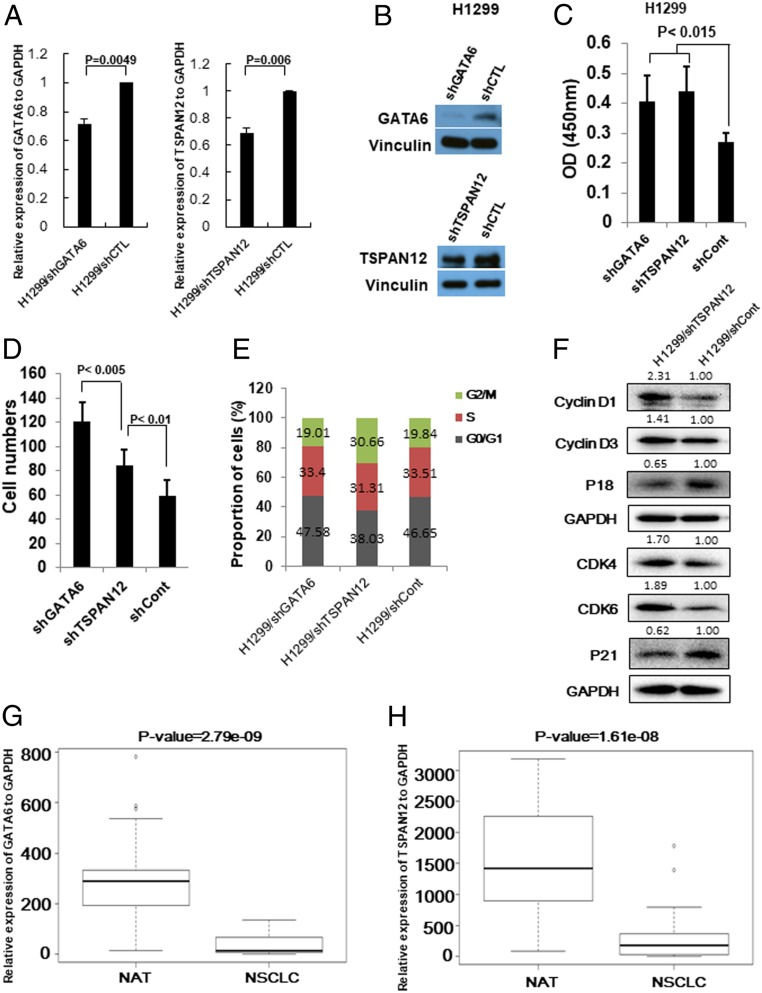
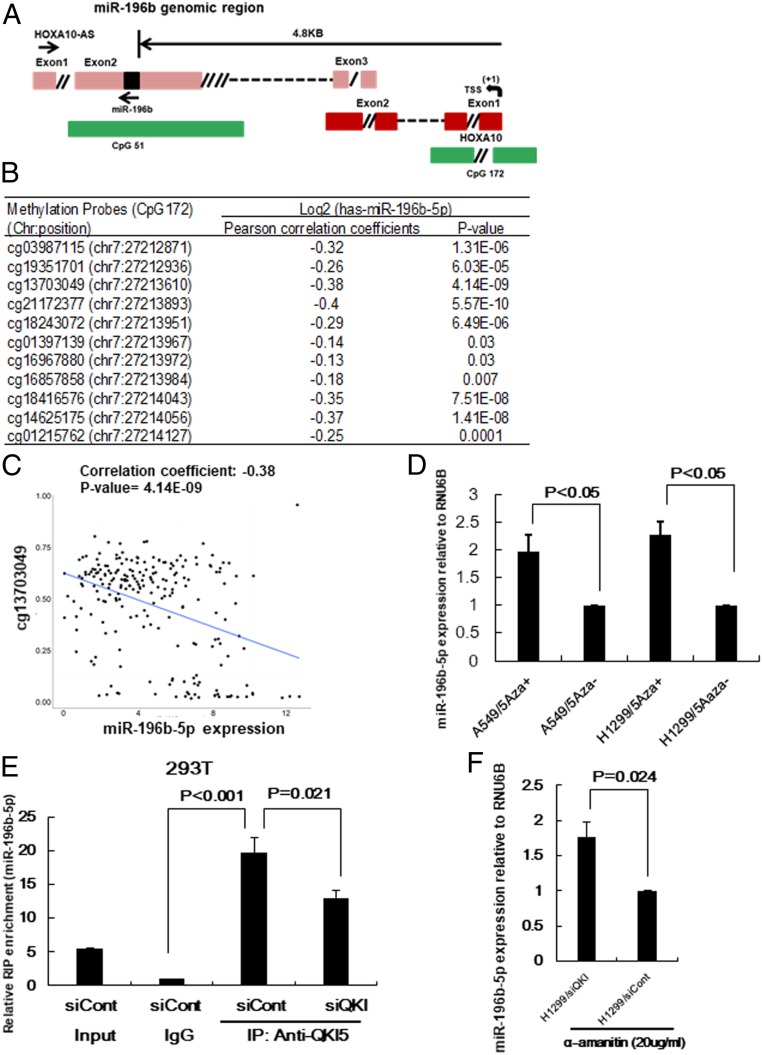
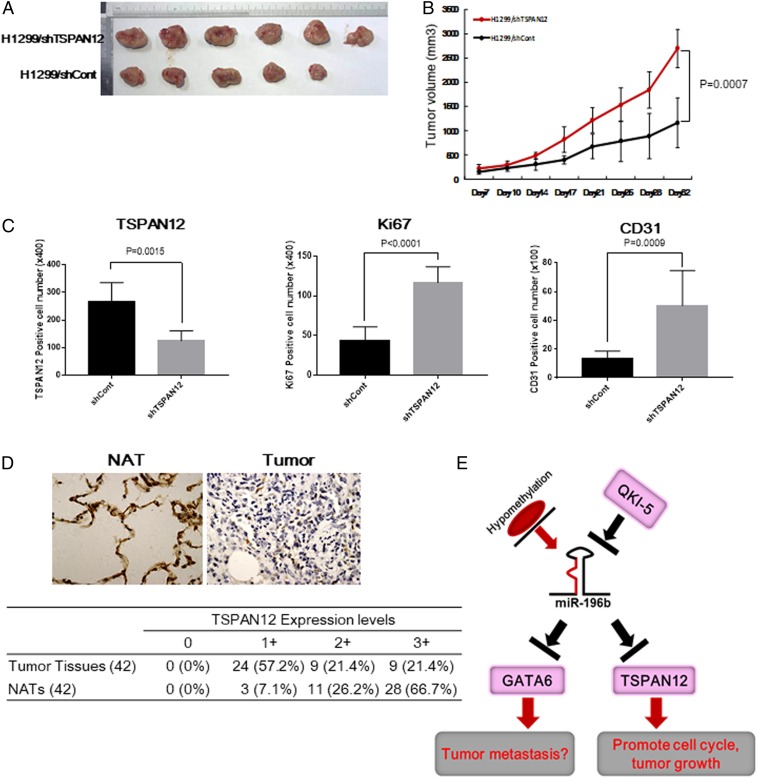
Lung cancer is the leading cause of cancer-related deaths worldwide and non-small cell lung cancer (NSCLC) accounts for over 80% of lung cancer cases. The RNA binding protein, QKI, belongs to the STAR family and plays tumor-suppressive functions in NSCLC. QKI-5 is a major isoform of QKIs and is predominantly expressed in NSCLC. However, the underlying mechanisms of QKI-5 in NSCLC progression remain unclear. We found that QKI-5 regulated microRNA (miRNA), miR-196b-5p, and its expression was significantly up-regulated in NSCLC tissues. Up-regulated miR-196b-5p promotes lung cancer cell migration, proliferation, and cell cycle through directly targeting the tumor suppressors, GATA6 and TSPAN12. Both GATA6 and TSPAN12 expressions were down-regulated in NSCLC patient tissue samples and were negatively correlated with miR-196b-5p expression. Mouse xenograft models demonstrated that miR-196b-5p functions as a potent onco-miRNA, whereas TSPAN12 functions as a tumor suppressor in NSCLC in vivo. QKI-5 bound to miR-196b-5p and influenced its stability, resulting in up-regulated miR-196b-5p expression in NSCLC. Further analysis showed that hypomethylation in the promoter region enhanced miR-196b-5p expression in NSCLC. Our findings indicate that QKI-5 may exhibit novel anticancer mechanisms by regulating miRNA in NSCLC, and targeting the QKI5∼miR-196b-5p∼GATA6/TSPAN12 pathway may enable effectively treating some NSCLCs.

Keywords: GATA6; NSCLC; QKI; TSPAN12; miR-196b.


Conflict of interest statement

The authors declare no competing interest.

Figures

Fig. 1.
Fig. 1.
QKI-5 down-regulation promotes miR-196b-5p expression. (A) Expression level of QKI-5 in 60 paired NSCLC tissues and their matched NATs. The RNA samples were extracted from 30 NSCLC tissues and 30 corresponding NATs. The RNAs were subject to qRT-PCR with a QKI-5 probe and the expression was normalized by GAPDH. (B and C) Cell proliferation assay (B) and colony formation assay (C) for QKI-5 knockdown H1299 cells. The cell growth rates were measured by cell counting kit 8. The values present mean ± SD as determined by quintuplet assays. Colony-forming areas were measured by ImageJ software. The average values were derived from three random areas. (D) Results of NanoString miRNA assay by comparing QKI-5 knockdown H1299 cells (H1299/siQKI) and control (H1299/siCont) cells. (E) qRT-PCR measure miR-196b-5p expressions in H1299/siQKI and H1299/siCont cells. (F and G) QKI expression from TCGA RNA-seq data and miR-196b-5p expression from miR-seq data were used to examine correlation between miR-196b-5p and QKI expressions in lung ADC dataset (n = 306) (F) and lung SCC dataset (n = 289) (G).
Fig. 2.
Fig. 2.
miR-196b-5p plays oncogenic functions in NSCLC. (A) Expression level of miR-196b-5p in 70 paired NSCLC tissues and their matched NATs. The RNA samples were extracted from 35 NSCLC tissues and 35 corresponding NATs. The RNAs were subject to qRT-PCR with an miR-196b-5p probe and the expression was normalized by U6B. Significantly up-regulated miR-196b-5p was observed in NSCLC tissues compared with their matched NATs. (B) qRT-PCR measure miR-196b-5p expression in premiR-196b–overexpressing H1299 cells and control cells. (C) Cell proliferation assay for premiR-196b–overexpressing H1299 cells and control cells. The cell growth rates were measured by cell counting kit 8. The values present mean ± SD as determined by quintuplet assays. (D) Cell migration assay for premiR-196b–overexpressing H1299 cells and control cells using transwell membranes. The average counts were derived from six random microscopic fields. (E) Proportion of cells in cell cycle G1 phase in premiR-196b–overexpressing H1299 cells and control cells were determined by flow cytometry analysis. The values present mean ± SD as determined by triple assays. (F) Western blot analysis of cell cycle G1 phase-related proteins (Cyclin D1, Cyclin D3, CDK4, CDK6, P18, and P21) in premiR-196b–overexpressing H1299 cells and control cells. The bands were quantified using ImageJ software and relative values were obtained by normalizing to the value of each corresponding glyceraldehyde-3-phosphate dehydrogenase (GAPDH). (G and H) Effects of miR-196b-5p on tumor growth in mouse model. Stable miR-196b-5p–overexpressing H1299 cells (H1299/miR196b) and control cells (H1299/miRCont) were s.c. injected into the flanks of nude mice. (G) Representative photographs of the tumors at day 31 after inoculation with either the H1299/miR196b or H1299/miRCont cells. (H) Tumor growth in nude mice s.c. injected into flanks with H1299/miR196b or H1299/miRCont. Data are presented as mean ± SD (n = 5 per group).
Fig. 3.
Fig. 3.
GATA6 and TSPAN12 are direct targets of miR-196b-5p. (A and B) GATA6 expression from TCGA RNA-seq data and miR-196b-5p expression from miR-seq data were used to examine correlation between miR-196b-5p and GATA6 expressions in lung ADC dataset (n = 306) (A) and lung SCC dataset (n = 289) (B). (C and D) TSPAN12 expression from TCGA RNA-seq data and miR-196b-5p expression from miR-seq data were used to examine correlation between miR-196b-5p and TSPAN12 expressions in lung ADC dataset (n = 306) (C) and lung SCC dataset (n = 289) (D). (E and F) qRT-PCR and Western blot to measure GATA6 mRNA and protein levels in lung cancer cells transfected with premiR-196b or control. (G and H) qRT-PCR and Western blot to measure TSPAN12 mRNA and protein levels in lung cancer cells transfected with premiR-196b or control. (I and J) Luciferase reporter constructs containing wild-type or mutated form of GATA6 (I) and TSPAN12 (J) 3′UTRs were cotransfected with miR-196b-5p mimic into the 293T cells. Data are presented as mean ± SD as determined by triple assays.
Fig. 4.
Fig. 4.
GATA6 and TSPAN12 play a crucial role in NSCLC progression. (A) qRT-PCR measures GATA6 and TSPAN12 mRNA levels in lung cancer cells transfected with shGATA6 or shTSPAN12 plasmids. (B) Western blot analysis measures GATA6 and TSPAN12 protein levels in lung cancer cells transfected with shGATA6 or shTSPAN12 plasmids. (C) Cell proliferation assay for GATA6 or TSPAN12 knockdown H1299 lung cancer cells. The cell growth rates were measured by cell counting kit 8. The values present mean ± SD as determined by quintuplet assays. (D) Cell migration assay for GATA6 or TSPAN12 knockdown H1299 cells using transwell membranes. The average counts were derived from six random microscopic fields. (E) Proportion of cells in each cell cycle phase in H1299/shGATA6, H1299/shTSPAN12, and H1299/shCont cells were determined by flow cytometry analysis. (F) Western blot analysis of cell cycle G1 phase-related proteins (Cyclin D1, Cyclin D3, CDK4, CDK6, P18, and P21) in H1299/shTSPAN12 cells and control cells. The bands were quantified using ImageJ software and relative values were obtained by normalizing to the value of each corresponding GAPDH. (G) Expression level of GATA6 in 60 paired NSCLC tissues and their matched NATs. The RNA samples were extracted from 30 NSCLC tissues and 30 corresponding NATs. The RNAs were subject to qRT-PCR with a GATA6 probe and the expression was normalized by GAPDH. (H) Expression level of TSPAN12 in 60 paired NSCLC tissues and their matched NATs. The RNA samples were extracted from 30 NSCLC tissues and 30 corresponding NATs. The RNAs were subject to qRT-PCR with a TSPAN12 probe and the expression was normalized by GAPDH.
Fig. 5.
Fig. 5.
Underlying mechanisms of up-regulated miR-196b-5p expression in NSCLC. (A) Schematic structure of miR196b-5p∼HOXA10-AS ∼HOXA10 genomic locus (not to scale). miR-196b-5p is located in exon 2 of HOXA10-AS. TSS indicates putative transcription start site and green boxes show the CpG islands. CpG51 expands exon 2 of HOXA10-AS and CpG172 expands exon 1 of HOXA10. (B) Correlation between miR-196b-5p expression from TCGA dataset and methylation probes in the promoter region of miR-196b-5p (CpG172) from TCGA Illumina Infinium Human DNA Methylation 450k beadchip in NSCLC. (C) Representative figure of correlation between miR-196b-5p expression and methylation probe cg13703049 (chr 7: 27213610) in NSCLC. (D) qRT-PCR to measure miR-196b-5p expression in lung cancer cell lines A549 and H1299 cells after treatment with 7.5µM 5-aza-CdR for 3 d. The values present mean ± SD as determined by triple assays. (E) Lysates from QKI-5 knockdown 293T cells or control cells were subjected to RIP analysis. The cell extracts were subjected to immunoprecipitation with IgG or anti-QKI5 antibody. Pull-down RNA was analyzed by qRT-PCR using specific probe for miR-196b-5p. Data are presented as mean ± SD as determined by triple assays. (F) RNAs were extracted from QKI-5 knockdown 293T cells or control cells treated with 20 μg/mL α-amanitin for 9 h and then subjected to qRT-PCR with a miR-196b-5p probe. U6B probe was used for normalization. Data are presented as mean ± SD as determined by triple assays.
Fig. 6.
Fig. 6.
(A and B) Effects of TSPAN12 on tumor growth in a mouse model. (A) Representative photographs of the tumors at day 32 after inoculation with either of the H1299/shTSPAN12 or H1299/shCont cells. (B) Tumor growth in nude mice s.c. injected into flanks with H1299/shTSPAN12 or H1299/shCont cells. Data are presented as mean ± SD (n = 6 per group). (C) TSPAN12-, CD31-, and Ki67-positive cells in tumors tissues derived from H1299/shTSPAN12 or H1299/shCont cells. Paraffin sections of tumors developing in nude mice were stained with anti-TSPAN12, anti-CD31, or anti-ki67 antibodies. The number of TSPAN12-positive cells, CD31-positive microvessels, or ki67-positive tumor cells in eight fields of tumors that demonstrated the highest reactivities with antibodies were counted at ×100 or ×400, respectively, and presented as mean ± SD. (D, Upper) Representative immunohistochemical staining for TSPAN12 in NSCLC tissues and NATs from the same patient. (D, Lower) Summary of tissue immunohistochemical staining data for TSPAN12 in 42 pairs of clinical NSCLC tissues and NATs. (E) Proposed dysregulated miR-196b-5p mediated down-regulation of GATA6 and TSPAN12 is involved in lung cancer pathogenesis in our research.

Similar articles

Cited by

References

    1. Siegel R. L., Miller K. D., Jemal A., Cancer statistics, 2019. CA Cancer J. Clin. 69, 7–34 (2019). - PubMed
    1. Gridelli C., et al. , Non-small-cell lung cancer. Nat. Rev. Dis. Primers 1, 15009 (2015). - PubMed
    1. Ebersole T. A., Chen Q., Justice M. J., Artzt K., The quaking gene product necessary in embryogenesis and myelination combines features of RNA binding and signal transduction proteins. Nat. Genet. 12, 260–265 (1996). - PubMed
    1. Wu J., Zhou L., Tonissen K., Tee R., Artzt K., The quaking I-5 protein (QKI-5) has a novel nuclear localization signal and shuttles between the nucleus and the cytoplasm. J. Biol. Chem. 274, 29202–29210 (1999). - PubMed
    1. Chénard C. A., Richard S., New implications for the QUAKING RNA binding protein in human disease. J. Neurosci. Res. 86, 233–242 (2008). - PubMed

Publication types

MeSH terms

LinkOut - more resources