. 2020 Mar 18;40(12):2445-2457.
doi: 10.1523/JNEUROSCI.1394-19.2020. Epub 2020 Feb 10.

Functional Clusters of Neurons in Layer 6 of Macaque V1

Affiliations

Functional Clusters of Neurons in Layer 6 of Macaque V1

Michael J Hawken et al. J Neurosci. .

Abstract

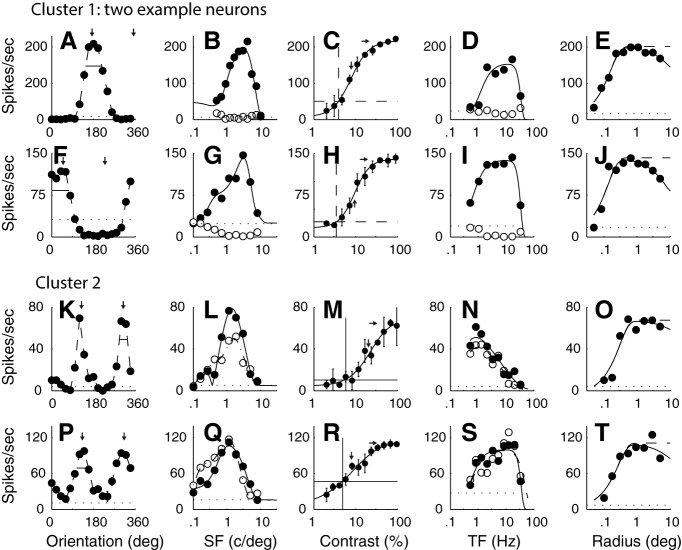
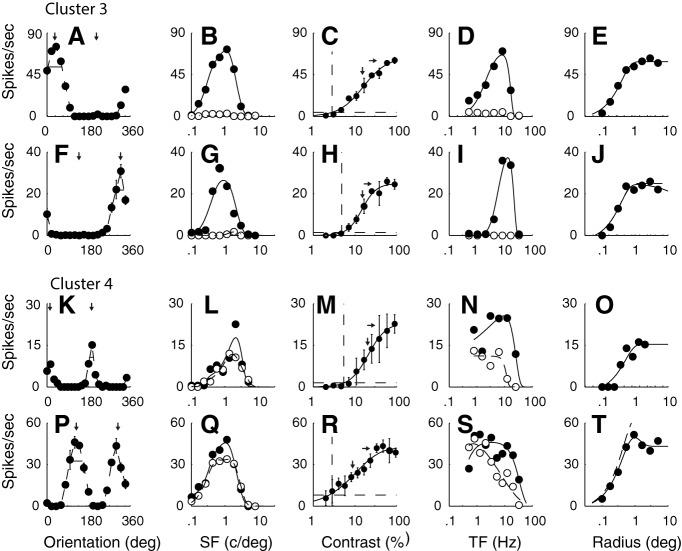
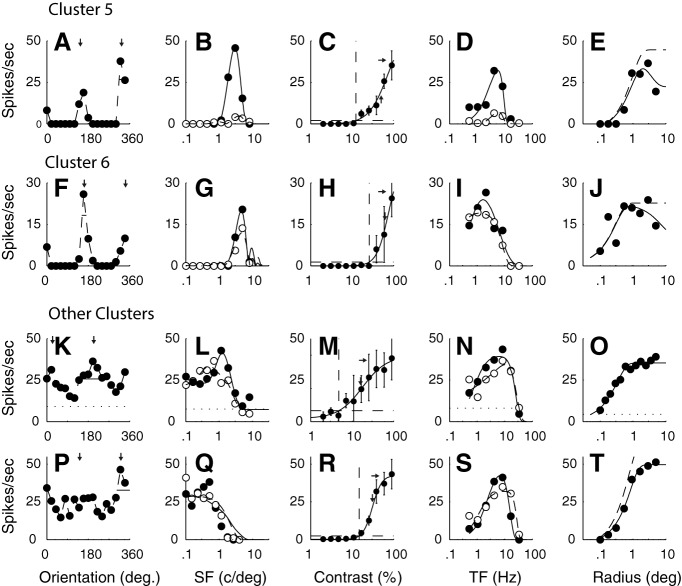
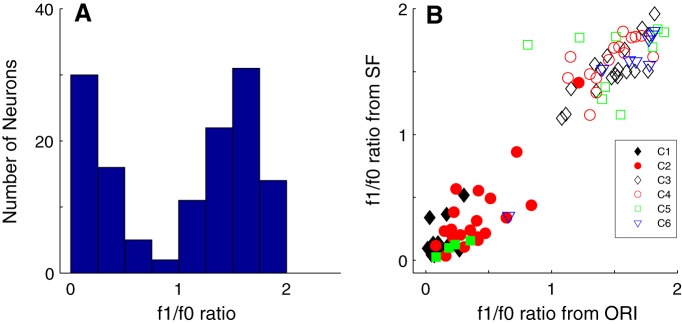
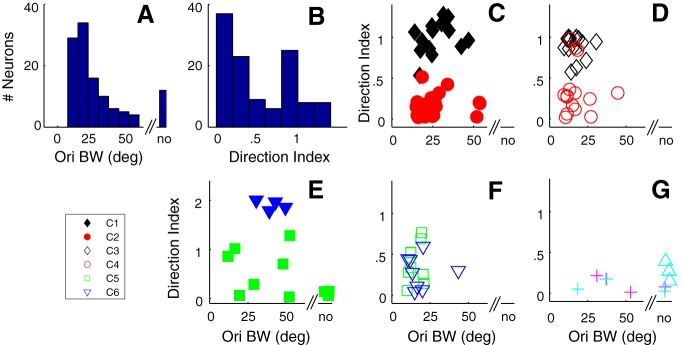
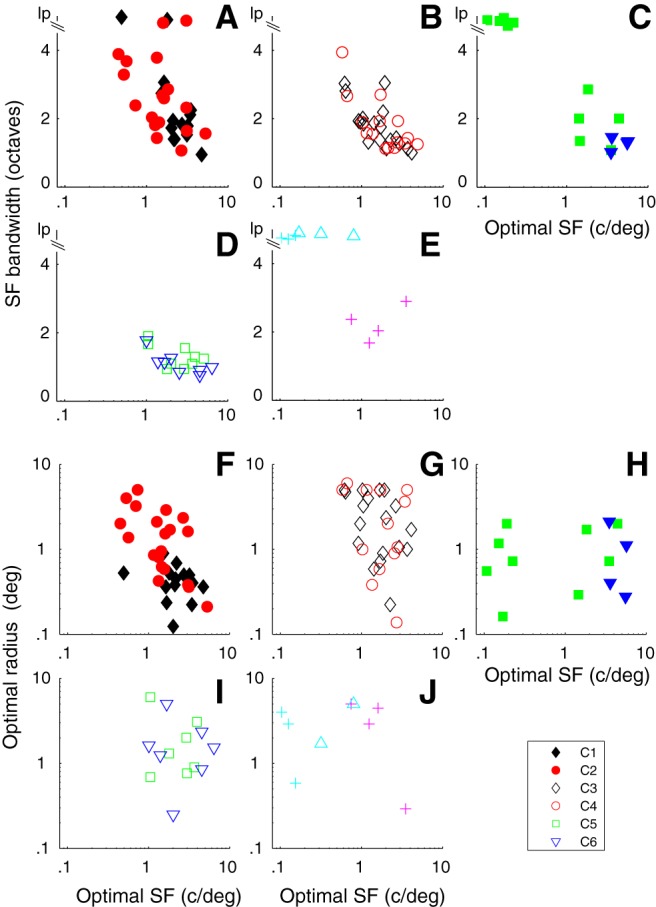
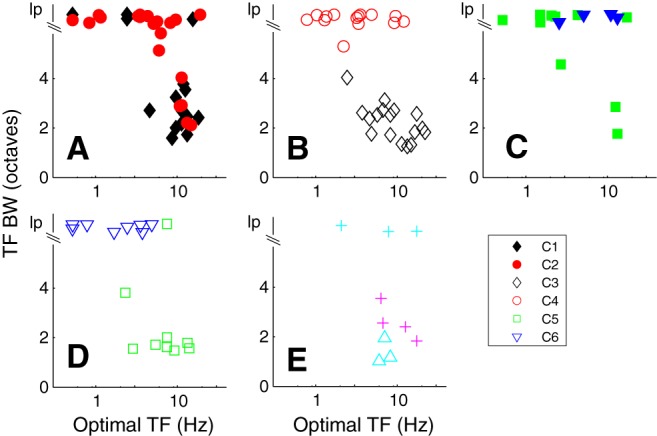
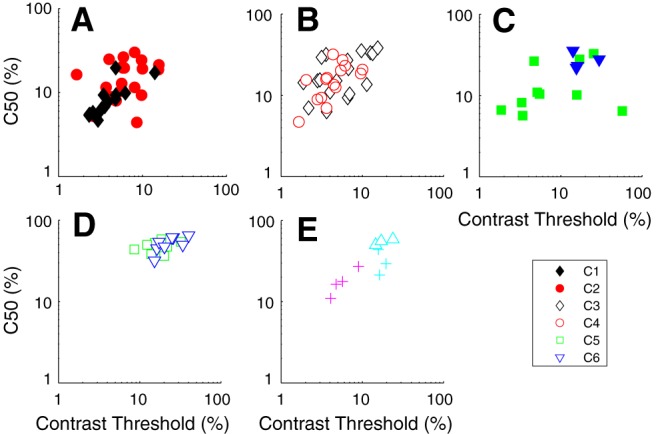
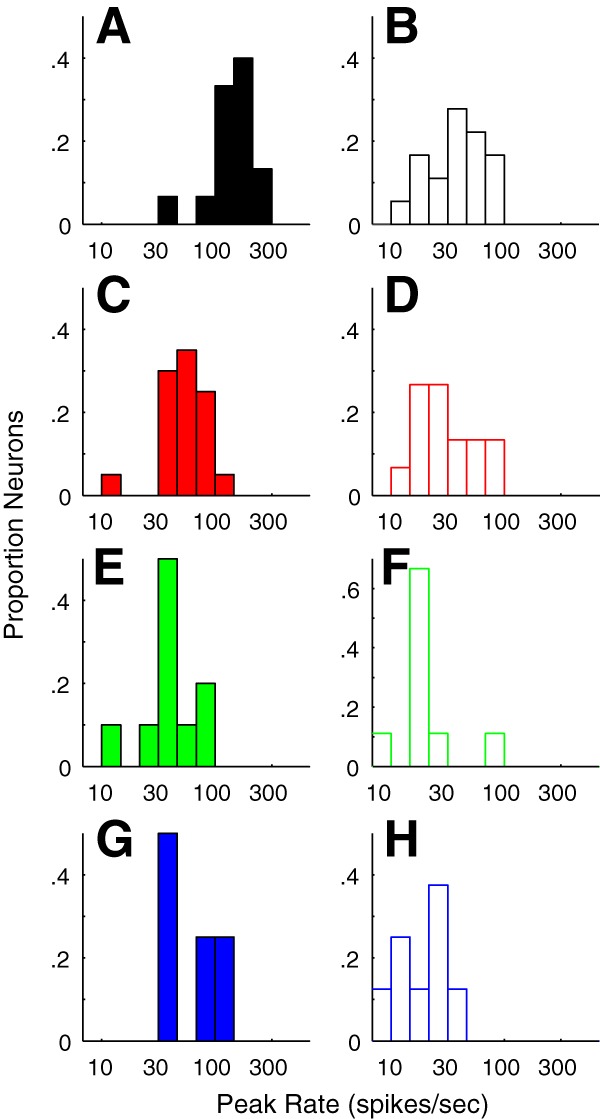
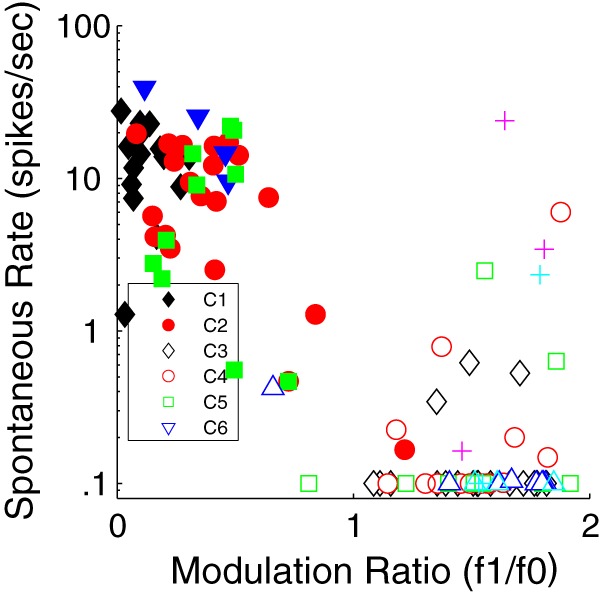
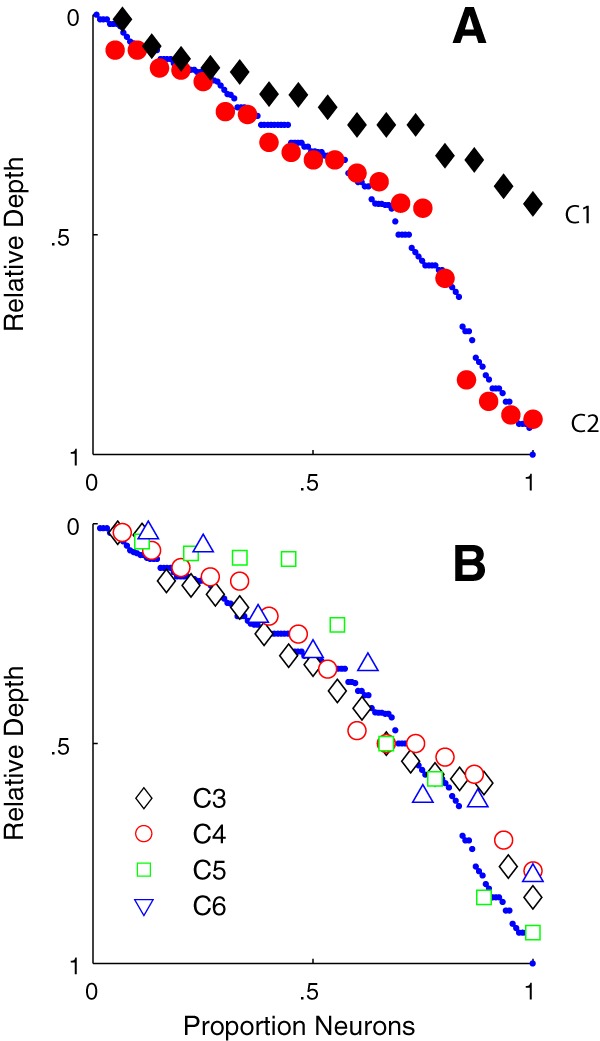
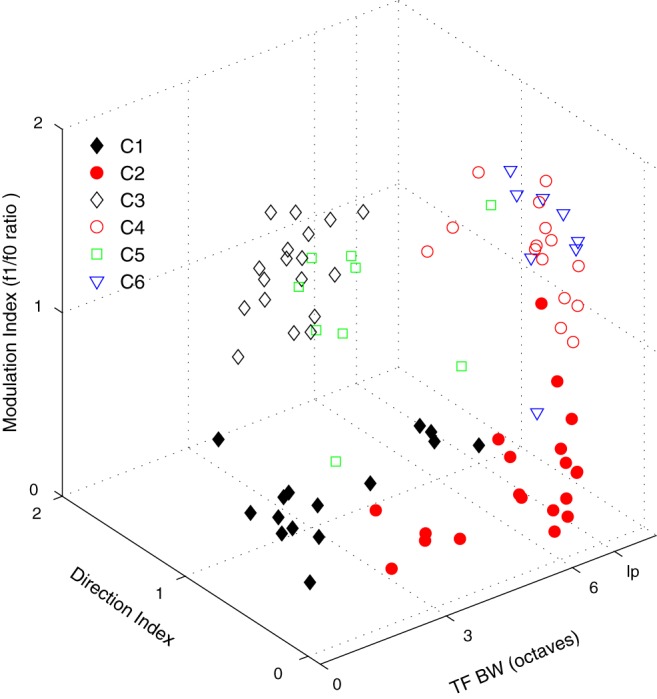
Layer 6 appears to perform a very important role in the function of macaque primary visual cortex, V1, but not enough is understood about the functional characteristics of neurons in the layer 6 population. It is unclear to what extent the population is homogeneous with respect to their visual properties or if one can identify distinct subpopulations. Here we performed a cluster analysis based on measurements of the responses of single neurons in layer 6 of primary visual cortex in male macaque monkeys (Macaca fascicularis) to achromatic grating stimuli that varied in orientation, direction of motion, spatial and temporal frequency, and contrast. The visual stimuli were presented in a stimulus window that was also varied in size. Using the responses to parametric variation in these stimulus variables, we extracted a number of tuning response measures and used them in the cluster analysis. Six main clusters emerged along with some smaller clusters. Additionally, we asked whether parameter distributions from each of the clusters were statistically different. There were clear separations of parameters between some of the clusters, particularly for f1/f0 ratio, direction selectivity, and temporal frequency bandwidth, but other dimensions also showed differences between clusters. Our data suggest that in layer 6 there are multiple parallel circuits that provide information about different aspects of the visual stimulus.SIGNIFICANCE STATEMENT The cortex is multilayered and is involved in many high-level computations. In the current study, we have asked whether there are subpopulations of neurons, clusters, in layer 6 of cortex with different functional tuning properties that provide information about different aspects of the visual image. We identified six major functional clusters within layer 6. These findings show that there is much more complexity to the circuits in cortex than previously demonstrated and open up a new avenue for experimental investigation within layers of other cortical areas and for the elaboration of models of circuit function that incorporate many parallel pathways with different functional roles.

Keywords: layer 6; primate; visual cortex.


Figures

Figure 1.
Figure 1.
The tuning functions of example neurons from the two main clusters that had f1/f0 ratios < 1. A–E, The tuning from a single neuron in C1 (f1/f0 = 0.17). F–J, The tuning for a second neuron in C1 (f1/f0 = 0.07). The neurons in C1 were orientation- and direction-selective, had low-contrast thresholds, and were bandpass in TF. There is a high response rate of these neurons, which was a characteristic of this cluster. K–O, The tuning for a neuron in C2 (f1/f0 = 0.19). P–T, The tuning for a second neuron in C2 (f1/f0 = 0.24). Neurons in this cluster were orientation-selective but not direction-selective, and were mainly low pass in TF (N), but some were bandpass (S). A, F, K, P, The response of each neuron was measured as a function of orientation to a drifting achromatic grating at the optimal SF and TF and a high contrast through a window of the optimal size. The pair of small vertical arrows in each plot indicate the optimal orientation that was selected by fitting a von Mises function to the data. Small horizontal bars represent the bandwidth, width at amplitude of √2 of the maximum. B, G, L, Q, The response of each neuron was measured as a function of SF at the preferred orientation and in both drift directions. The pairs of data in each plot indicate the response at the preferred orientation for each drift direction (filled circles represent preferred drift direction; unfilled circles represent nonpreferred drift direction). Smooth curves fitted to the data indicate a spatial receptive field model that is a difference of offset difference of Gaussians (see Materials and Methods). C, H, M, R, The response as a function of contrast was measured for each neuron at the preferred orientation, drift direction, SF, and TF in a patch of grating of the optimal diameter. Smooth curve through each dataset indicates a modified Naka-Rushton function (see Materials and Methods). Horizontal dotted line indicates the response that is 2 SDs above the response to a blank gray screen (spontaneous response). Vertical dotted line indicates the value of contrast that was taken as the contrast threshold, the point where the horizontal line intersected the fitted Naka-Rushton function. Error bars indicate SD. D, I, N, S, The response as a function of TF is shown for a grating of the optimal orientation, SF, and in both the preferred and opposite to preferred direction of drift direction (filled circles represent preferred drift direction; unfilled circles represent nonpreferred drift direction). The two datasets were fitted independently with a difference of exponentials function. Smooth curves indicate the best fitting functions. E, J, O, T, A grating of the optimal orientation, drift direction, SF, and TF and at high contrast (≥64%) was presented in a circular window of different radii. The response as a function of radius of the window is shown. Data are fitted with a difference of Gaussians function (see Materials and Methods).
Figure 2.
Figure 2.
The tuning functions of example neurons from two of the four main clusters that had f1/f0 ratios > 1. A–E, F–J, Tuning of two example neurons from C3 (f1/f0 1.5 and 1.1, respectively). These neurons, characteristic of the cluster, were strongly direction-selective and bandpass in TF. K–O, P–T, Tuning functions of two example neurons from C4 (f1/f0 1.6 and 1.7, respectively). These neurons were orientation-selective but not direction-selective with low pass TF tuning. The other details are as for Figure 1.
Figure 3.
Figure 3.
A–E, F–J, The tuning functions of example neurons from C5 and C6. The neurons in these clusters were orientation and SF selective, but one characteristic that separated them from the other two clusters was their insensitivity to contrast. They are separated from each other by their TF tuning, neurons in C5 were bandpass, and those in C6 were low pass. K–O, P–T, Neurons from the smaller clusters where most of the neurons were weakly selective for orientation and relatively low pass in SF (f1/f0 1.3 and 1.5, respectively). The other details are as for Figure 1.
Figure 4.
Figure 4.
A, The distribution of f1/f0 ratio for all the neurons in the sample from layer 6 (n = 116). The f1/f0 ratio was used as one of the response measures in the clustering procedure. B, The f1/f0 ratio measured in the orientation tuning experiment (x axis) plotted against the f1/f0 ratio of the same cell measured from the SF tuning experiment (y axis). Symbols represent cluster assignments. There were six main clusters that are shown as filled black diamonds (C1), filled red circles (C2), unfilled black diamonds (C3), unfilled red circles (C4), unfilled green squares (C5), and unfilled blue triangles (C6). Unfilled magenta triangles and cyan and magenta crosses represent three smaller clusters with f1/f0 ratios > 1. Filled blue triangles represent a small cluster with f1/f0 < 1. Filled green squares represent four further clusters with f1/f0 < 1 and with < 4 neurons that were combined. The clusters were clearly separated according to whether they are complex (f1/f0 < 1) or simple (f1/f0 > 1).
Figure 5.
Figure 5.
Orientation bandwidth (obw) and dI were two tuning parameters used in the clustering procedure. A, The distribution of obw for the whole layer 6 sample. no, Nonoriented. B, The distribution of dI for the whole sample. C–G, The relationship between obw (x axis) and dI (y axis) for the same clusters shown in Figure 4. C, The obw/dI relationship for C1 (filled black diamonds) and C2 (filled red circles). There is a clear separation by dI but not obw in the two clusters. D, The relationship for C3 (unfilled black diamonds) and C4 (unfilled red circles). There is a clear separation based on dI but not obw in the two clusters. E, The obw/dI relationship between the remaining clusters where the clusters also had f1/f0 < 1. The neurons in the small cluster (filled blue triangles) are very direction-selective and strongly suppressed in the nonpreferred direction. Filled green squares represent the combination of three small clusters. F, The obw/dI relationship for C5 (green squares) and C6 (blue triangles), both with neurons that have f1/f0 > 1. G, Three small clusters (unfilled cyan triangles, magenta crosses, and cyan crosses) where all the clusters also had f1/f0 < 1.
Figure 6.
Figure 6.
The relationship between optimal SF (osf, x axis) and SF bandwidth (sfbw, y axis, A–E) and optimal radius (F–J) for the main clusters. Cluster designation as in Figure 5. lp, Low pass. A, In C1 and C2, there is an inverse relationship between osf and sfbw for both groups. B, C3 and C4 show overlapping relationships between osf and sfbw. C, The small very direction-selective clusters (filled blue triangles) have very similar osfs and sfbws, whereas the combined clusters have a number of neurons that are low pass in SF tuning. D, C5 and C6 show narrow sfbws across a range of osfs. E, Neurons in two clusters are low pass in SF; the other is bandpass (magenta crosses). F–J, The optimal summation radius for C1 is restricted, whereas there is a broad span of optimal summation radius for other clusters. The smaller clusters are detailed in Figure 5C, E, H, J. For 5 of 85 cells in the 6 main clusters, we did not obtain area summation measures. F–J, The n in each cluster C1–C6 was 15, 20, 18, 13, 7, and 7, respectively.
Figure 7.
Figure 7.
The relationship between optimal TF (otf, x axis) and TF bandwidth (tfbw, y axis) for the main clusters. Cluster designation as in Figure 5. lp, Low pass. A, C1 and C2, the majority of neurons in C1 are bandpass in TF and have otfs ∼10 Hz. Many of the neurons in cluster 2 are lp in TF. B, C3 and C4 show distinct separation based on tfbw. C, The majority of the neurons in the remaining clusters with f1/f0 ratio < 1 are low pass in TF. D, C5 and C6 are separated by their tuning for TF (except 1 neuron in C5 that is lp). E, Three small clusters are distinguished by their TF tuning. The smaller clusters are detailed in Figure 5C, E.
Figure 8.
Figure 8.
Two measures from the response as a function of contrast were used as tuning parameters in the clustering procedure: contrast threshold (cTh) and the contrast where the response reached half the maximum response (c50). Cluster designation as in Figure 5. A, C1 has neurons with relatively low cTh and c50, whereas neurons in C2 are intermediate in their contrast sensitivity. B, C3 and C4 have overlapping cThs and c50s but are somewhat less sensitive than C1. C, Neurons in the direction-selective cluster (blue triangles) are relatively insensitive to contrast. D, Neurons in C5 and C6 have high cThs and c50, making the clusters stand out as being contrast insensitive. E, One cluster is intermediate in contrast sensitivity (magenta crosses), another insensitive (cyan triangles). The smaller clusters are detailed in Figure 5C, E.
Figure 9.
Figure 9.
Distribution of maximum firing rates (see Materials and Methods) to optimal stimuli in each cluster. A, C, E, G, The distributions of peak firing rate of neurons in C1, C2, C6, and C7, respectively, all that had f1/f0 ratios < 1. Many neurons in C1 have high maximum firing rates. B, D, F, H, The distributions of peak firing rate of neurons in C3, C4, C5, and C6 respectively, all had f1/f0 ratios > 1.
Figure 10.
Figure 10.
Distribution of spontaneous firing rates (y axis) as a function of f1/f0 ratio (x axis) for all neurons shown as clusters in Figure 4. Neurons with spontaneous rate of ≤0.1 are shown as 0.1. There are two main groups: those with f1/f0 < 1 have spontaneous rates > 1, and those with f1/f0 > 1 have low spontaneous rate. Clusters as in Figure 4. The smaller clusters detailed in the Figure 5 legend are shown with the same symbols used in Figure 5.
Figure 11.
Figure 11.
The relative depth of each neuron is shown in serial order from top of layer 6. Each cluster is shown by the same symbols as used in Figure 4 and subsequent figures. A, The relative depth for C1 (black diamonds) shows that the neurons are found in the upper half of layer 6. Neurons in C2 (red circles) are distributed through the full depth of layer 6. Small blue circles represent the serial order of the total sample of 116 neurons. B, The four clusters with f1/f0 ratios > 1, C3–C6, are distributed through the full depth of layer 6.
Figure 12.
Figure 12.
Distribution of the six largest clusters is shown with respect to three tuning parameters: TF bandwidth (x axis), f1/f0 ratio (y axis), and dI (z axis). Each cluster is indicated by the symbols described in Figure 4.

References

    1. Barlow HB, Kaushal TP, Hawken M, Parker AJ (1987) Human contrast discrimination and the threshold of cortical neurons. J Opt Soc Am A 4:2366–2371. 10.1364/JOSAA.4.002366 - DOI - PubMed
    1. Bonds AB. (1991) Temporal dynamics of contrast gain in single cells of the cat striate cortex. Vis Neurosci 6:239–255. 10.1017/S0952523800006258 - DOI - PubMed
    1. Briggs F, Callaway EM (2001) Layer-specific input to distinct cell types in layer 6 of monkey primary visual cortex. J Neurosci 21:3600–3608. 10.1523/JNEUROSCI.21-10-03600.2001 - DOI - PMC - PubMed
    1. Briggs F, Usrey WM (2009) Parallel processing in the corticogeniculate pathway of the macaque monkey. Neuron 62:135–146. 10.1016/j.neuron.2009.02.024 - DOI - PMC - PubMed
    1. Briggs F, Kiley CW, Callaway EM, Usrey WM (2016) Morphological substrates for parallel streams of corticogeniculate feedback originating in both V1 and V2 of the macaque monkey. Neuron 90:388–399. 10.1016/j.neuron.2016.02.038 - DOI - PMC - PubMed

Publication types

LinkOut - more resources