. 2020 Mar 16;133(6):jcs237388.
doi: 10.1242/jcs.237388.

ORP3 phosphorylation regulates phosphatidylinositol 4-phosphate and Ca2+ dynamics at plasma membrane-ER contact sites

Affiliations

ORP3 phosphorylation regulates phosphatidylinositol 4-phosphate and Ca2+ dynamics at plasma membrane-ER contact sites

Gergő Gulyás et al. J Cell Sci. .

Abstract

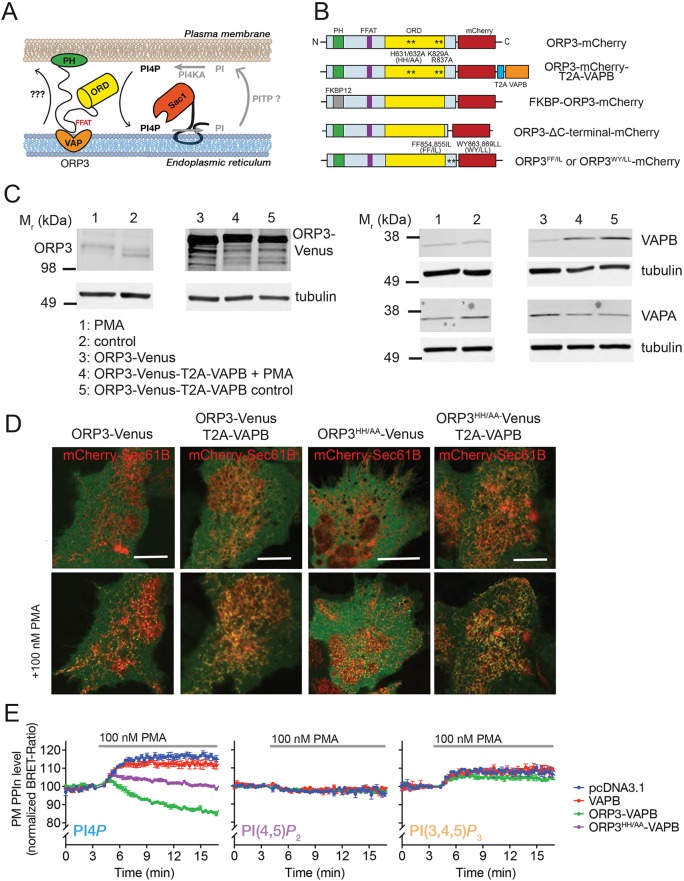
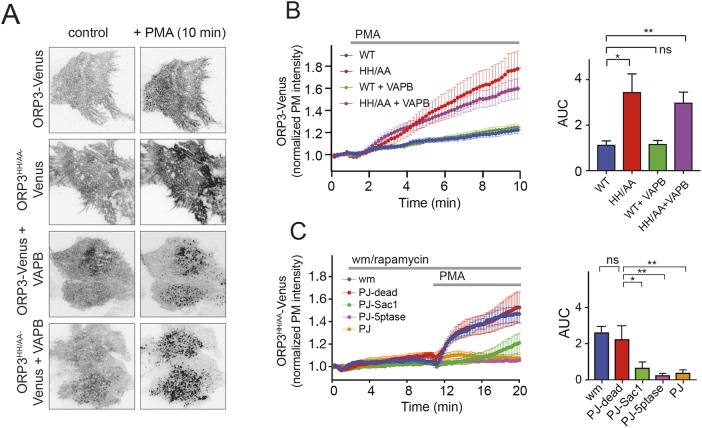
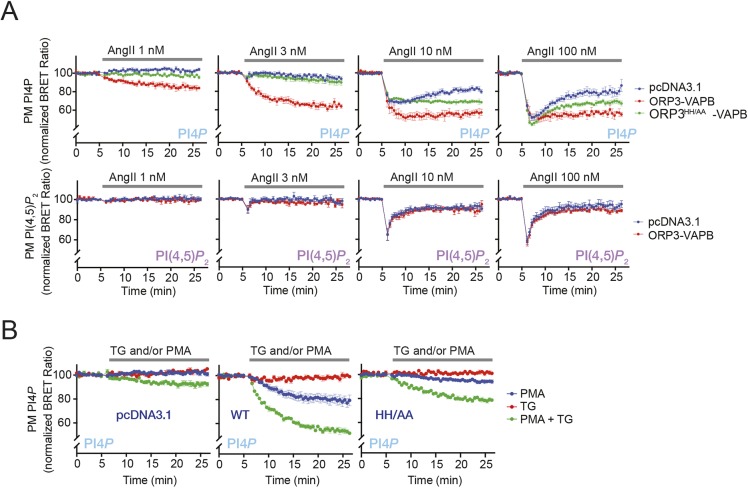
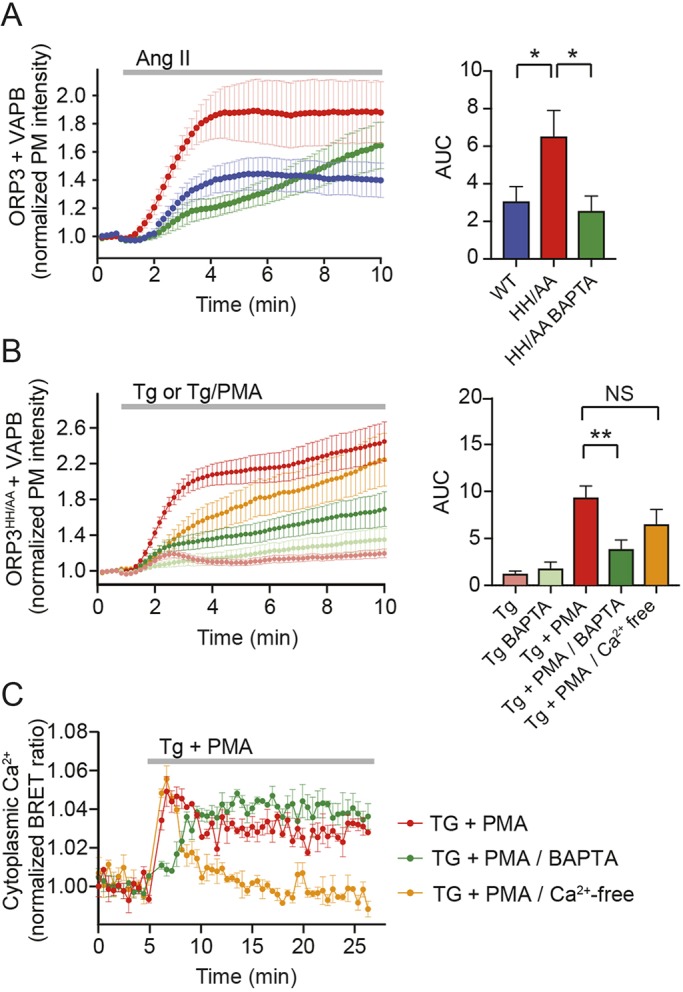
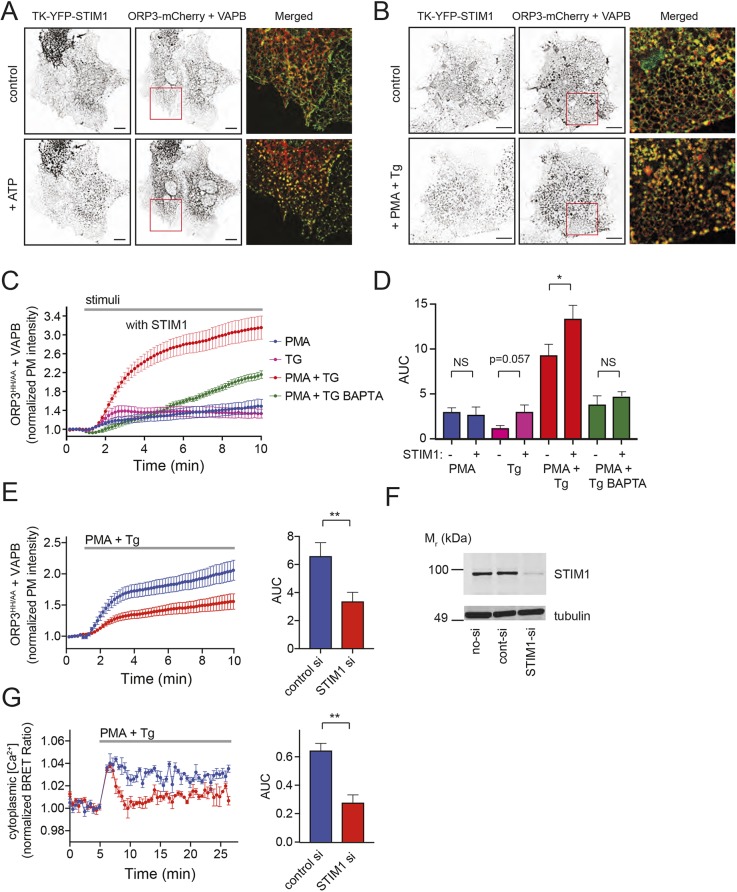
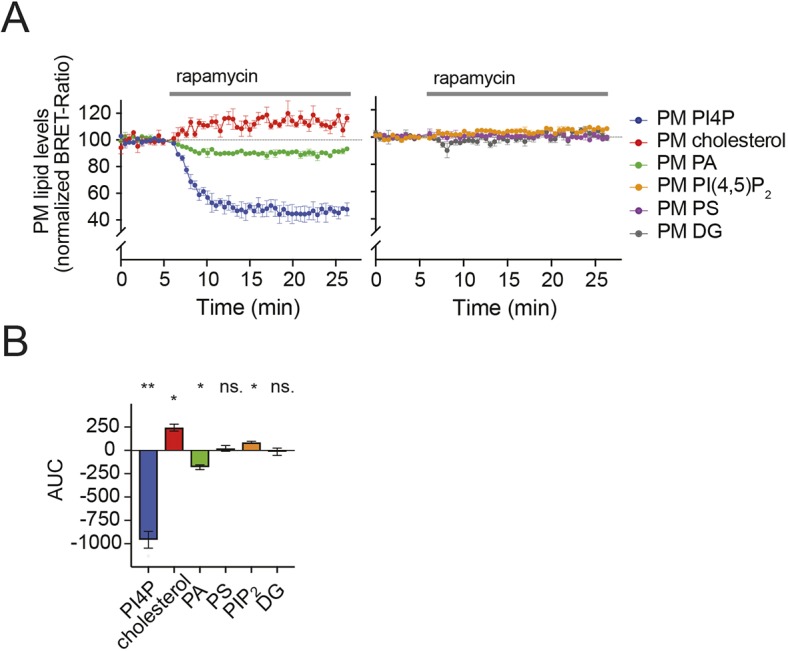
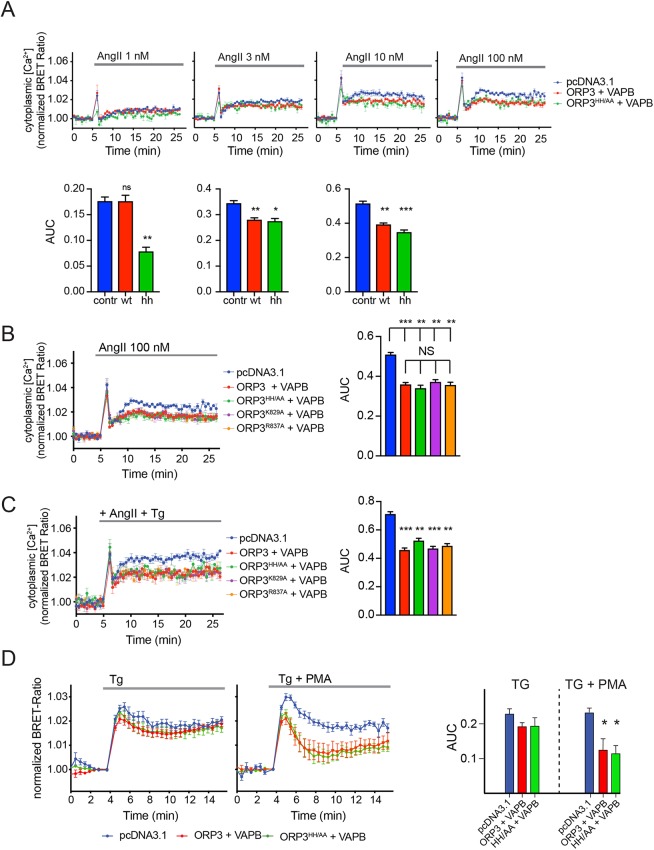
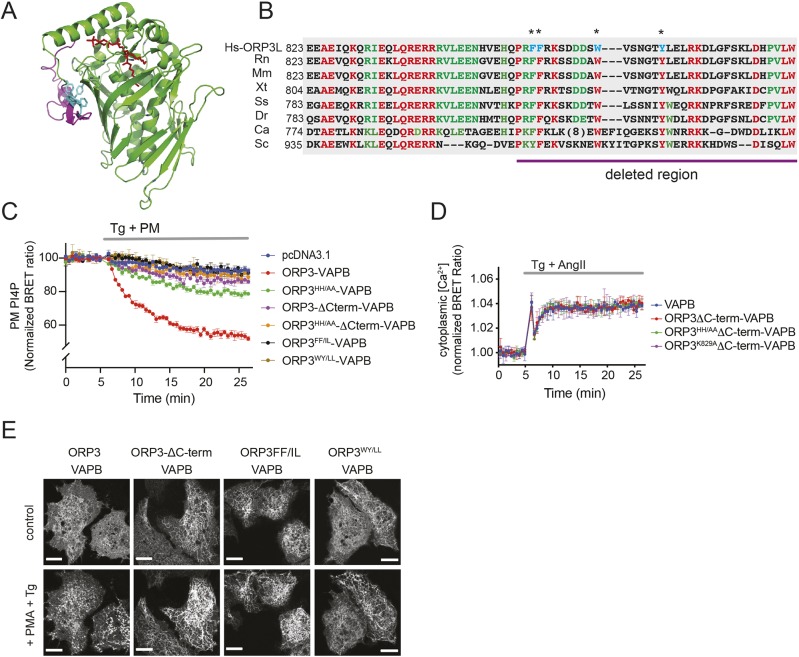
Oxysterol-binding protein (OSBP)-related proteins (ORPs) mediate non-vesicular lipid transfer between intracellular membranes. Phosphoinositide (PI) gradients play important roles in the ability of OSBP and some ORPs to transfer cholesterol and phosphatidylserine between the endoplasmic reticulum (ER) and other organelle membranes. Here, we show that plasma membrane (PM) association of ORP3 (also known as OSBPL3), a poorly characterized ORP family member, is triggered by protein kinase C (PKC) activation, especially when combined with Ca2+ increases, and is determined by both PI(4,5)P2 and PI4P After activation, ORP3 efficiently extracts PI4P and to a lesser extent phosphatidic acid from the PM, and slightly increases PM cholesterol levels. Full activation of ORP3 resulted in decreased PM PI4P levels and inhibited Ca2+ entry via the store-operated Ca2+ entry pathway. The C-terminal region of ORP3 that follows the strictly defined lipid transfer domain was found to be critical for the proper localization and function of the protein.

Keywords: BRET; ORP3; Phosphoinositides; Protein kinase C; SOCE; STIM1; TIRF.


Conflict of interest statement

Competing interestsThe authors declare no competing or financial interests.

Figures

Fig. 1.
Fig. 1.
PKC activation and VAP interaction are key determinants of ORP3 localization and function. (A) A simplified cartoon illustrating the operation of the ORP3 protein. ORP3 binding to the PM is mediated by the PH domain of the protein, whereas its ER binding is mediated by the FFAT motifs that interact with the ER-resident VAP proteins. The ER-resident PI4P phosphatase Sac1 and the PM-localized PI4KA enzyme maintain the PI4P gradient between the two membranes. (B) Schematic representation of the different ORP3 constructs used in this study. Although ORP3 has one FFAT-like and one genuine FFAT motif, only one is depicted here for simplicity. The approximate position of the mutations within the ORD domain are marked with asterisks. (C) Western blot analysis of ORP3 and VAP proteins in non-transfected HEK293-AT1 cells (lanes 1 and 2), or in cells expressing ORP3-mVenus (lane 3) or ORP3-mVenus-T2A-VAPB (lanes 4 and 5). 100 nM PMA was used for 10 min to activate PKC (lanes 1 and 4). Control treatment (lanes 2 and 5) was with DMSO. (D) Confocal images showing the intracellular localization of ORP3-Venus protein or ORP3HH/AA relative to the ER-marker mCherry-Sec61B transiently transfected HEK293-AT1 cells. In resting cells, both the wild-type and mutant ORP3-Venus show cytoplasmic localization. In the presence of VAPB, both constructs are partially ER-localized (these differences are better seen in the single Venus channel shown in Fig. S1A). After 100 nM PMA treatment (5 min), the proteins form patches on the PM, indicating PM and ER binding at contact sites. Scale bars: 10 μm. (E) Monitoring changes in PM phosphoinositide levels after ORP3 activation using BRET-based biosensors. HEK293T cells were transiently transfected with the respective BRET probes together with the indicated constructs. After a 5 min control period, cells were treated with 100 nM PMA to activate ORP3. BRET ratio values were normalized taking the resting ratio as 100% and the complete lack of energy transfer as 0% (for details, see Materials and Methods). Data are means±s.e.m. of three independent experiments, each performed in triplicate.
Fig. 2.
Fig. 2.
Phosphoinositides determine the PM binding of ORP3 after PMA treatment. (A) Representative TIRF images show the footprint of HEK293-AT1 cells transfected with the indicated constructs. Selected images are shown from a time-lapse series showing the same cells before and 10 min after PMA addition. (B) Quantification of image sequences obtained in several TIRF experiments similar to that shown in A. For calculations of the normalized PM intensities, see the Materials and Methods. Bar diagrams show the area under the curve (AUC) values calculated from 7 (WT and ORP3HH/AA), 14 (WT-VAPB) and 18 (ORP3HH/AA-VAPB) independent dishes obtained in 2–8 experiments. Data are means±s.e.m. The PM binding of ORP3HH/AA was significantly higher than wild type regardless of the presence of VAPB. Welch ANOVA analysis was used to compare the groups with different sample sizes. The individual groups were compared with unpaired Welch t-test in multiple comparison (**P<0.01; *P<0.05; ns, not significant). (C) Monitoring the PM binding of the ORP3HH/AA protein (ORP3HH/AA-mVenus-T2A-VAPB) in response to PMA stimulation after manipulation of the PM phosphoinositide pools. To selectively reduce PM PI4P, PI(4,5)P2 or their combination, an inducible heterodimerization approach was employed utilizing the FKBP-fused pseudojanin (PJ) lipid phosphatase. PJ-Sac1 (4-phosphatase active, green curve) or PJ-5ptase (5-phosphatase active, purple curves) selectively deplete PM PI4P or PI(4,5)P2, respectively. The dual activity PJ (both 4- and 5-phosphatase active) eliminates both of these phosphoinositide lipids. The enzymatically inactive protein (PJ-dead, red curve) was used as control. To reduce the PI3K products PI(3,4,5)P3 and PI(3,4)P2, 100 nM wortmannin (wm, blue curves) was added before the PMA stimulation. For the calculation of the normalized PM intensities, see the Materials and Methods. Bar diagrams show AUC values calculated for the period corresponding to PMA stimulation. Data are means±s.e.m. from 7 independent dishes in each group, obtained in 3–5 experiments. PM PI(3,4,5)P3 and PI(3,4)P2 depletion had no effect on the PM binding of the ORP3 protein, compared with the control cells (expressing PJ-dead). In contrast, the PM binding of ORP3HH/AA was significantly reduced after PM PI4P or PI(4,5)P2 depletion (green and purple curves and bars, respectively), PI(4,5)P2 depletion having a more robust effect. One-way ANOVA with Dunnett test was used to compare groups to the inactive enzyme (PJ-dead, red curves and bar) control (*P<0.05; **P<0.01; ns, not significant).
Fig. 3.
Fig. 3.
The effect of ORP3 on PM phosphoinositide lipid changes during receptor stimulation or PMA and thapsigargin treatment. (A) Changes in PM PI4P and PI(4,5)P2 levels after stimulation of angiotensin II (AngII) receptors that activate PLC. HEK293-AT1 cells were transiently transfected with the BRET biosensors monitoring PI4P (top panels) or PI(4,5)P2 (bottom panels) together with the indicated constructs. Increasing concentrations of AngII were applied at the times indicated. Data are means±s.e.m. of three independent experiments each performed in triplicate. (B) Monitoring the effect of wild type and ORP3HH/AA on PM PI4P levels after treatment with either PMA (100 nM) or thapsigargin (Tg, 200 nM) or their combination. As a control, pcDNA3.1 was transfected instead of ORP3. Data are means±s.e.m. of three independent experiments, each performed in triplicate.
Fig. 4.
Fig. 4.
Ca2+ influx contributes to the activation of ORP3. (A) Quantification of PM-binding of ORP3 or ORP3HH/AA with VAPB present in HEK293-AT1 cells stimulated with 5 nM AngII. Cells were transfected with the indicated plasmids and analyzed by TIRF microscopy. BAPTA-2AM loading (10 min, 10 µM) was carried out at room temperature. Data are means±s.e.m., recorded in [n=12 (WT), n=13 (HH/AA), n=7 (HH/AA-BAPTA)] independent dishes obtained in 3–7 experiments. Statistical analysis was carried out on the AUC values comparing different groups, as indicated, using unpaired t-test with Welch's correction (*P<0.05). (B) Similar experiments as shown in A except stimulation was with Tg (200 nM; tan and light green) or with a combination of Tg and PMA (red, dark green and orange). Cells were used with or without a 10 min pre-treatment with BAPTA-2AM (10 μM) as indicated. The nominally Ca2+-free medium was supplemented with 100 µM EGTA. Data shown are means±s.e.m. of n=6 (Tg); n=7 (Tg BAPTA); n=13 (Tg+PMA); n=8 (Tg+PMA BAPTA) and n=7 (Tg+PMA/Ca2+ free) independent dishes obtained in 2–5 experiments. The AUCs were compared with unpaired Welch's t-test in multiple comparison. (**P<0.01; NS, not significant). (C) Cytoplasmic Ca2+ changes after stimulation of HEK293-AT1 cells with the combination of PMA (100 nM) and Tg (200 nM). Cells were transfected with the BRET-based intramolecular Ca2+-sensor (Gulyas et al., 2015). Stimulation was carried out at the times indicated. BAPTA-2AM (10 µΜ) was used as pre-treatment for 10 min. The nominally Ca2+-free medium was supplemented with 100 μM EGTA. Data are means±s.e.m. of three independent experiments, each performed in triplicate.
Fig. 5.
Fig. 5.
The role of STIM1 on ORP3 PM binding. (A,B) Representative confocal images showing the colocalization between the wild-type ORP3 protein and STIM1 (TK-mRFP-STIM1) in COS-7 cells before and after stimulation with 50 μM ATP (A), or with a combination of 100 nM PMA+200 nM Tg (B). Red squares show the region enlarged in the merged images. Scale bars: 15 μm. (C) Membrane association of ORP3HH/AA in the presence of VAPB and STIM1 after stimulation with PMA (100 nM, blue), Tg (200 nM, pink) or their combination (red). When used, BAPTA-2AM (10 µM) pre-treatment was for 10 min (green). Data are means±s.e.m. of n=6 (PMA); n=7 (Tg); n=13 (PMA+Tg) and n=6 (PMA+Tg BAPTA) obtained in independent dishes acquired in 2–5 separate experiments. (D) Quantification of the TIRF experiments shown in C by calculating the AUC. The graph also includes data for the STIM1 minus groups obtained in experiments shown in Figs 2 and 4 for better comparison. Statistical differences were evaluated for each stimulus by comparing groups with or without STIM1 using unpaired t-test with Welch's correction (*P<0.05; NS, not significant). (E) Quantification of PM binding of ORP3HH/AA mutant (with VAPB) assessed in TIRF experiments using HEK293-AT1 cells stimulated with 100 nM PMA and 200 nM Tg. Cells were treated with either control siRNA (blue) or with siRNA against STIM1 (red). Data are means±s.e.m. of n=15 independent dishes for each group obtained in 4 experiments. The AUCs were compared using unpaired Welch's t-test (**P<0.01). (F) Western blot analysis of HEK293-AT1 lysates from cells treated with the indicated siRNA. The tubulin blot shown is from the same samples but run in a different gel. (G) Cytoplasmic Ca2+ changes after stimulation of HEK293-AT1 cells with the combination of PMA (100 nM) and thapsigargin (Tg, 200 nM). Cells were transfected with a BRET-based intramolecular Ca2+ sensor and stimulated as indicated. Data are means±s.e.m. of three independent experiments, each performed in triplicate. Statistical difference between the control and STIM1-silenced cells was calculated from AUCs using unpaired Welch's t-test (**P<0.01).
Fig. 6.
Fig. 6.
Selected lipid changes in the PM after recruitment of the FKBP-tagged ORP3 protein. (A) The PH domain of ORP3 was replaced with FKBP12 allowing its rapid regulated recruitment to the PM. The FKBP12-ORP3-mCherry construct was co-transfected with the PM-anchored FRB (Lyn1-14-FRB-mRFP), and the respective BRET sensors to monitor changes in the indicated lipids in the PM of HEK293-AT1 cells. Rapamycin (100 nM) was added after 5 min to recruit ORP3 to the membrane. Data are means±s.e.m. of three independent experiments, each performed in triplicate. (B) Bar diagrams showing the AUC calculations from the BRET experiments in A. Here, the areas were calculated relative to the baseline (0). For statistical analysis one-sample Student's t-test was used. Data are means±s.e.m. of three independent experiments, performed in triplicate (*P<0.05; **P<0.01; ns, non-significant).
Fig. 7.
Fig. 7.
ORP3 expression inhibits store-operated Ca2+-influx. (A) Cytoplasmic Ca2+-changes after stimulation of HEK293-AT1 cells with various concentrations of AngII. Cells were co-transfected with a BRET-based intramolecular Ca2+ sensor and the indicated ORP3 constructs with VAPB. AngII was added at the time indicated. Data are means±s.e.m. of three independent experiments, each performed in triplicate. Below each panel is the corresponding statistical analysis performed on the AUC values using Brown–Forsythe and Welch ANOVA, compared with the control (*P<0.05, **P<0.01, ***P<0.001). (B) Comparison of different ORP3 mutants on the cytoplasmic Ca2+ responses in HEK293-AT1 cells after stimulation with 100 nM AngII as described for A. Note that none of the mutants differed in their Ca2+ responses from that of the wild-type ORP3. The 100 nM AngII control curve (blue) shown in panel A is plotted here for comparison. Data are means±s.e.m. of three independent experiments, each performed in triplicate. The statistical analysis performed as described for A is shown on the right. (C) Similar experiments as shown in B, except stimulation was with AngII (100 nM)+Tg (200 nM). Data are means±s.e.m. of three independent experiments, each performed in triplicate. The statistical analysis is shown on the right. (D) Cytoplasmic [Ca2+] changes in HEK293T cells, expressing the Ca2+-sensitive BRET probe and the indicated ORP3 constructs. Cells were treated either with Tg (200 nM) alone, or in combination with PMA (100 nM) as indicated. Note that only after PKC activation does ORP3 exert an inhibitory effect. Data are means±s.e.m. of four independent experiments, each performed in triplicate. The statistical analysis performed as in A, is shown on the right (*P<0.05).
Fig. 8.
Fig. 8.
Modification of the C-terminus of ORP3 eliminates lipid transport, PM binding and inhibition of Ca2+ signals. (A) 3D structure of the ORP3 ortholog OSH3 protein in complex with PI4P (4INQ) (Tong et al., 2013). The extreme C-terminal segment distal to the ORD domain and the conserved hydrophobic residues facing the ORD domain are highlighted in magenta and cyan, respectively. Pymol was used to generate this image. (B) Multiple alignment of the C-terminal ends of ORP3 orthologues. Conserved residues are marked red, partially conserved residues and conserved substitutions are marked green. The mutated conserved hydrophobic residues are marked with asterisks, and also highlighted in cyan within the human sequence. Hs, Homo sapiens; Rn, Rattus norvegicus; Mm, Mus musculus; Xt, Xenopus tropicalis; Ss, Salmo salar; Dr, Danio rerio; Ca, Candida albicans; Sc, Saccharomyces cerevisiae. (C) Effect of C-terminal truncation and mutagenesis of selected hydrophobic residues on the ability of ORP3 to affect PM PI4P levels in HEK293-AT1 cells. Cells were transiently transfected with the PI4P-specific BRET probe, and the indicated ORP3 mutants with VAPB. Activation of ORP3 proteins was induced by 100 nM PMA added after 5 min. Data are means±s.e.m. of three independent experiments, each performed in triplicate. (D) Cytoplasmic Ca2+ levels in HEK293-AT1 cells expressing a BRET-based Ca2+ sensor and the indicated ORP3 mutants with VAPB. Stimulation was with a combination of AngII (100 nM) and Tg (200 nM). Data are means±s.e.m. of three independent experiments, each performed in triplicate. (E) Confocal images of HEK293-AT1 cells showing the intracellular localization of the Venus-tagged versions of the wild-type ORP3-VAPB protein and its C-terminal region mutants as indicated. After 100 nM PMA and 200 nM Tg treatment (5 min), the wild-type protein forms patches on the PM, indicating PM and ER binding at contact sites. The patch formation is missing in the case of the mutants; however, increased ER binding is indicated by the drop in the background cytoplasmic fluorescence. Scale bars: 10 μm.

Similar articles

Cited by

References

    1. Antonny B., Bigay J. and Mesmin B. (2018). The oxysterol-binding protein cycle: burning off PI(4)P to transport cholesterol. Annu. Rev. Biochem. 87, 809-837. 10.1146/annurev-biochem-061516-044924 - DOI - PubMed
    1. Baba T., Toth D. J., Sengupta N., Kim Y. J. and Balla T. (2019). Phosphatidylinositol 4,5-bisphosphate controls Rab7 and PLEKHM1 membrane cycling during autophagosome-lysosome fusion. EMBO J. 38, e100312 10.15252/embj.2019102837 - DOI - PMC - PubMed
    1. Beh C. T., McMaster C. R., Kozminski K. G. and Menon A. K. (2012). A detour for yeast oxysterol binding proteins. J. Biol. Chem. 287, 11481-11488. 10.1074/jbc.R111.338400 - DOI - PMC - PubMed
    1. Bojjireddy N., Botyanszki J., Hammond G., Creech D., Peterson R., Kemp D. C., Snead M., Brown R., Morrison A., Wilson S. et al. (2014). Pharmacological and genetic targeting of the PI4KA enzyme reveals its important role in maintaining plasma membrane phosphatidylinositol 4-phosphate and phosphatidylinositol 4,5-bisphosphate levels. J. Biol. Chem. 289, 6120-6132. 10.1074/jbc.M113.531426 - DOI - PMC - PubMed
    1. Broad L. M., Braun F.-J., Lievremont J.-P., Bird G. S. J., Kurosaki T. and Putney J. W. Jr (2001). Role of the phospholipase C-inositol 1,4,5-trisphosphate pathway in calcium release-activated calcium current and capacitative calcium entry. J. Biol. Chem. 276, 15945-15952. 10.1074/jbc.M011571200 - DOI - PubMed

Publication types

MeSH terms

Substances