. 2020 Apr;182(4):2126-2142.
doi: 10.1104/pp.19.01561. Epub 2020 Feb 10.

H+ Transport by K+ EXCHANGE ANTIPORTER3 Promotes Photosynthesis and Growth in Chloroplast ATP Synthase Mutants

Affiliations

H+ Transport by K+ EXCHANGE ANTIPORTER3 Promotes Photosynthesis and Growth in Chloroplast ATP Synthase Mutants

Viviana Correa Galvis et al. Plant Physiol. 2020 Apr.

Abstract

The composition of the thylakoid proton motive force (pmf) is regulated by thylakoid ion transport. Passive ion channels in the thylakoid membrane dissipate the membrane potential (Δψ) component to allow for a higher fraction of pmf stored as a proton concentration gradient (ΔpH). K+/H+ antiport across the thylakoid membrane via K+ EXCHANGE ANTIPORTER3 (KEA3) instead reduces the ΔpH fraction of the pmf. Thereby, KEA3 decreases nonphotochemical quenching (NPQ), thus allowing for higher light use efficiency, which is particularly important during transitions from high to low light. Here, we show that in the background of the Arabidopsis (Arabidopsis thaliana) chloroplast (cp)ATP synthase assembly mutant cgl160, with decreased cpATP synthase activity and increased pmf amplitude, KEA3 plays an important role for photosynthesis and plant growth under steady-state conditions. By comparing cgl160 single with cgl160 kea3 double mutants, we demonstrate that in the cgl160 background loss of KEA3 causes a strong growth penalty. This is due to a reduced photosynthetic capacity of cgl160 kea3 mutants, as these plants have a lower lumenal pH than cgl160 mutants, and thus show substantially increased pH-dependent NPQ and decreased electron transport through the cytochrome b 6 f complex. Overexpression of KEA3 in the cgl160 background reduces pH-dependent NPQ and increases photosystem II efficiency. Taken together, our data provide evidence that under conditions where cpATP synthase activity is low, a KEA3-dependent reduction of ΔpH benefits photosynthesis and growth.


Figures

Figure 1.
Figure 1.
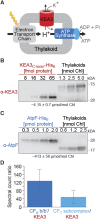
KEA3 occurs substoichiometrically to the cpATP synthase in the thylakoid membrane. A, Scheme depicting the thylakoid membrane with the main proton transport pathways (i.e. the electron transport chain and the ATP synthase, as well as KEA3). B and C, Representative blots of KEA3 (B) and AtpF (C) quantifications obtained by titrating known amounts of purified recombinant proteins, i.e. the C terminus of KEA3 (which binds the specific epitope antibody, Armbruster et al., 2014) and full-length AtpF, against known amounts of thylakoid membranes (quantified by Chl content). Values derived from the quantifications are given below the blots as average of n = 5 ± sd. D, Ratio of spectral counts identified by MS analysis for the CFo cpATP b/b` subunits and the CF1 cpATP synthase subcomplex with KEA3. Average of n = 5 ± sd is displayed.
Figure 2.
Figure 2.
The low cpATP synthase mutant cgl160 has decreased ATP synthase activity, lower ATP levels, and high pmf. A, Picture of 5-week-old Col-0, cgl160-1, and cgl160-2. B and C, Membrane proton conductivity (gH+) as proxy for ATP synthase activity (B) and light-induced thylakoid pmf estimated by ECSt (C) were calculated from changes in the ECS signal during a short dark interval following 10 min of actinic light illumination at the indicated light intensities. Averages of n = 6 are shown and error bars indicate ± se. ANOVA and a Holm-Sidak pairwise multiple comparison describe gH+ of both mutants to be significantly lower than that of Col-0 (P < 0.05), except where stated ns for nonsignificant. For ECSt, the tests describe mutants to have significantly higher values at all light intensities as compared with Col-0. D, ATP levels of Col-0 and cgl160-1 or cgl160-2 were determined from leaf discs in two independent experiments as described in Supplemental Table S1, and ratios between Col-0, cgl160-1 or cgl160-2 were calculated.
Figure 3.
Figure 3.
KEA3 optimizes growth in the cgl160 mutant by increasing the capacity for photosynthesis. A, Picture of 5-week-old Col-0, kea3-1, kea3-2, cgl160-1, cgl160-2, cgl160-1 kea3-1, cgl160-1 kea3-2, and cgl160-2 kea3-1 plants. B, Dry weight of 5-week-old plants represented as box plots, n = 13. C, Increases in leaf area during 5 weeks for Col-0, kea3-1, cgl160-1, and cgl160-1 kea3-1; averages of n = 6–8 are shown, and error bars indicate ± se. The inset shows daily growth rate ± sd (D) Chl a fluorescence was measured of dark acclimated plants at increasing actinic light intensities, and the electron transport rate through PSII (ETRII) was calculated; averages of n = 18 are displayed and error bars indicate ± se. E, Whole plant assimilation was determined in response to increasing light intensities and recalculated on a leaf area basis; averages of n = 7–13 plus error bars for ± se are shown.
Figure 4.
Figure 4.
In the cgl160 mutant, KEA3 decreases the ΔpH component of the pmf and thereby increases photosynthetic electron transport. A and B, At growth light, the cgl160 mutant stores a high fraction of pmf as ΔΨ, which is KEA3-dependent. Representative ECS traces of Col-0, kea3-1, cgl160-1, and kea3-1 cgl160-1 plants during a transition from light (150 µmol photons m−2 s−1) to dark (A). The difference in the ECS signal between light and the transient minimum in dark is ECSt, between light and steady-state dark ECSss and between transient dark minimum and steady-state dark ECSinv. ECSt is a measure for light induced pmf, ECSss for ΔΨ and ECSinv for ΔpH. B, ECS and its composition measured for Col-0, kea3-1, kea3-2, cgl160-1, cgl160-2, cgl160-1 kea3-1, cgl160-1 kea3-2, and cgl160-2 kea3-1. Averages are shown for n = 10, and error bars indicate ± se. Different letters above and in graph indicate significant differences between genotypes with P < 0.05 as determined by ANOVA and a Holm-Sidak pairwise multiple comparison for ECSt and ECSinv, respectively. C, Membrane conductivity for protons (gH+). D, Scheme of the thylakoid membrane depicting the composition of the pmf, the regulatory role of the lumenal proton concentration, and parameters that were derived in this work. VDE, violaxanthin de-epoxidase; V, violaxanthin; Z, zeaxanthin; LHCII, light harvesting complex II; OEC, oxygen evolving complex; PQ, plastoquinone; bf, cytochrome b6f complex; PC, plastocyanin. E to l, photoinhibitory quenching (qI, E), pH-dependent quenching (qE, F and indicated as curvy black arrow in D), xanthophyll deepoxidation state (DEPS, G), PSII quantum efficiency (ΦII, H), PSII acceptor availability (qL, I), cyt-f oxidation state (J), PSI donor side limitation (Y[ND]; K), and PSI acceptor side limitation (Y[NA] L). Average is shown for n = 10 (C, E, F, H) and n = 6–8 (G and I–L), and error bars indicate ± se. A–C and E–L, Measurements were performed on 5-week-old plants at actinic light intensities resembling growth light as described in “Materials and Methods.” Different letters above bars indicate significant differences between genotypes with P < 0.05 as calculated by ANOVA and Holm-Sidak pairwise multiple comparison (C and E–L).
Figure 5.
Figure 5.
In the cgl160 mutant, lack of KEA3 decreases plastocyanin content. A, Chl content per leaf area is very similar between 5-week-old Col-0, kea3-1, kea3-2, cgl160-1, cgl160-2, cgl160-1kea3-2, and cgl160-2kea3-1 plants. B to F, PSII (B), Cytb6f (C), PSI (D), and PC (E) were quantified spectroscopically with respect to Chl in isolated thylakoids as described in the methods. F, PC per leaf area was calculated from data in (A) and (E). Averages are shown for n = 6, and error bars indicate ± se. Different letters above bars indicate significant differences between genotypes with P < 0.05 as calculated by ANOVA and post hoc Tukey’s test. Note that PC per leaf area for cgl160-1kea3-2 and cgl160-2kea3-1 is significantly different from both parents, cgl160-1, kea3-2 and cgl160-2, kea3-1, respectively. G, Western blot analysis of total leaf protein from Col-0 (dilution series), kea3-1, cgl160-1, and cgl160-1kea3-1 with antibodies as indicated on the right. Before immune detection, membranes were stained with Ponceau Red.
Figure 6.
Figure 6.
cgl160 plants are sensitive to high light independent of KEA3. A, Maximum quantum yield of 5-week-old Col-0, kea3-1, kea3-2, cgl160-1, cgl160-2, cgl160-1 kea3-2, and cgl160-2 kea3-1 was measured before and 3 h after a shift to 900 µmol photons m−2 s−1. Averages are shown for n = 10, and error bars indicate ± se. Different letters above bars indicate significant differences between genotypes with P < 0.05 as calculated by ANOVA and post hoc Tukey’s test. B, Light-induced pmf (ECSt) and fraction stored as ΔΨ (ECSss) and ΔpH (ECSinv) was measured at 1000 µmol photons m−2 s−1 actinic light for Col-0, kea3-1, cgl160-1, and cgl160-1 kea3-1. Average is shown for n = 5, and error bars indicate ± se. Different letters above graph indicate significant differences between genotypes for ECSt, in top bar for ECSss and in bottom bar for ECSinv with P < 0.05 as calculated by ANOVA and post hoc Tukey’s test.
Figure 7.
Figure 7.
Overexpression of KEA3 in the cgl160 background promotes photosynthesis by down-regulating qE. A, Picture of 5-week-old Col-0, cgl160-1 and two independent lines overexpressing KEA3-GFP in the cgl160-1 background. B, Dry weight of 5-week-old plants; n = 13–15. Different letters above graph indicate significant differences between genotypes with P < 0.05 as calculated by ANOVA on ranks and Dunn’s test (C and D) pH-dependent quenching (qE; C) and PSII quantum efficiency (ΦII; D) were measured of Col-0, cgl160-1, and oeKEA3 lines 1 and 2 (L1 and L2) in the cgl160-1 background. Averages are shown for n = 6, and error bars indicate ± se. E to H, Light-induced pmf (ECSt) and fraction stored as ΔΨ (ECSss) and ΔpH (ECSinv; E), cpATP synthase conductivity (gH+; F), halftime (t1/2) of ECSinv recovery (G), and cyt-f oxidation state (H) were measured for Col-0, cgl160-1, oeKEA3 in cgl160-1 L1 and L2. Data for both overexpression lines were pooled for representation and statistical analysis. Average is shown for n = 3–10, and error bars indicate ± se. C to H, Measurements were performed at actinic light intensities resembling growth light as detailed in “Materials and Methods.” Different letters above graph indicate significant differences between genotypes with P < 0.05 as calculated by ANOVA and Holm-Sidak pairwise multiple comparison.

Comment in

Similar articles

Cited by

References

    1. Allen J.(2002) Photosynthesis of ATP-electrons, proton pumps, rotors, and poise. Cell 110: 273–276 - PubMed
    1. Armbruster U, Carrillo LR, Venema K, Pavlovic L, Schmidtmann E, Kornfeld A, Jahns P, Berry JA, Kramer DM, Jonikas MC(2014) Ion antiport accelerates photosynthetic acclimation in fluctuating light environments. Nat Commun 5: 5439. - PMC - PubMed
    1. Armbruster U, Correa Galvis V, Kunz HH, Strand DD(2017) The regulation of the chloroplast proton motive force plays a key role for photosynthesis in fluctuating light. Curr Opin Plant Biol 37: 56–62 - PubMed
    1. Armbruster U, Leonelli L, Correa Galvis V, Strand D, Quinn EH, Jonikas MC, Niyogi KK(2016) Regulation and levels of the thylakoid K+/H+ antiporter KEA3 shape the dynamic response of photosynthesis in fluctuating light. Plant Cell Physiol 57: 1557–1567 - PMC - PubMed
    1. Baker NR.(2008) Chlorophyll fluorescence: A probe of photosynthesis in vivo. Annu Rev Plant Biol 59: 89–113 - PubMed

Publication types

MeSH terms

Substances