. 2020 Feb 10;9(2):15.
doi: 10.1038/s41389-020-0195-2.

STAT3 activates MSK1-mediated histone H3 phosphorylation to promote NFAT signaling in gastric carcinogenesis

Affiliations

STAT3 activates MSK1-mediated histone H3 phosphorylation to promote NFAT signaling in gastric carcinogenesis

Hongyan Qi et al. Oncogenesis. .

Abstract

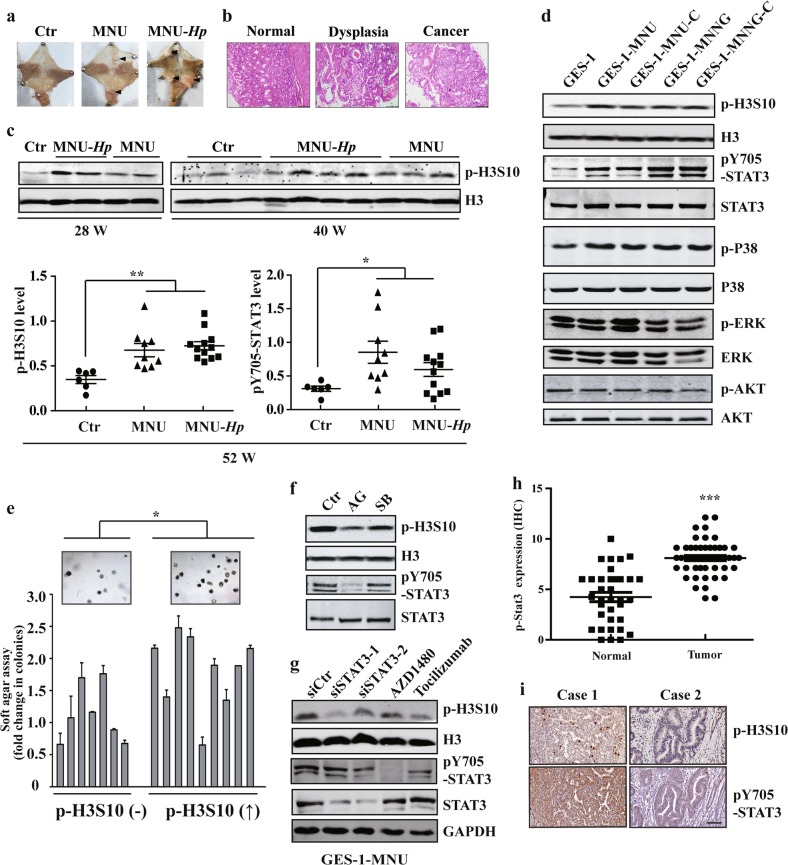
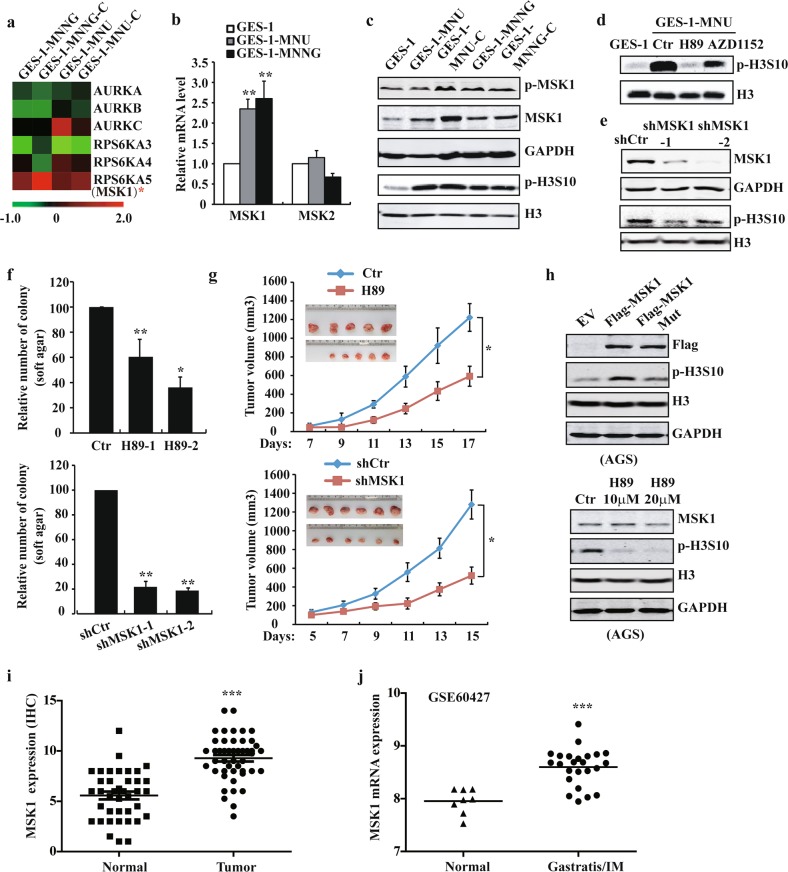
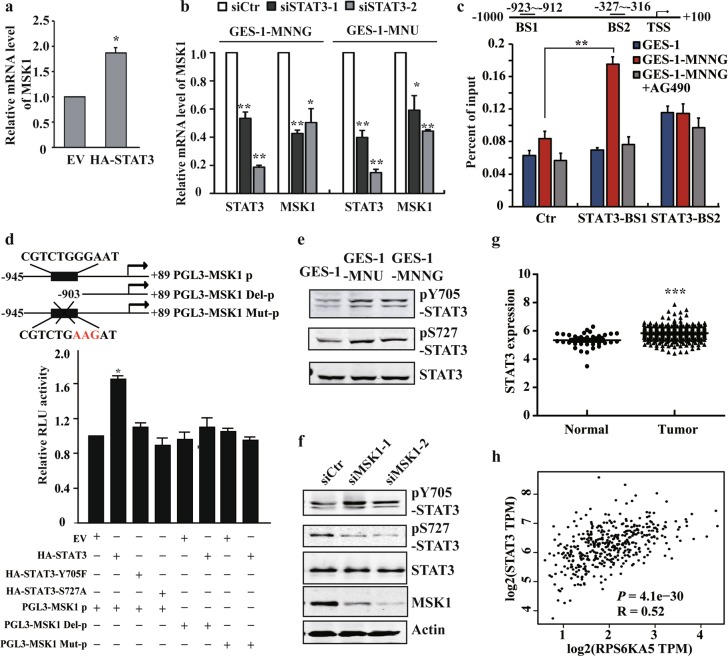
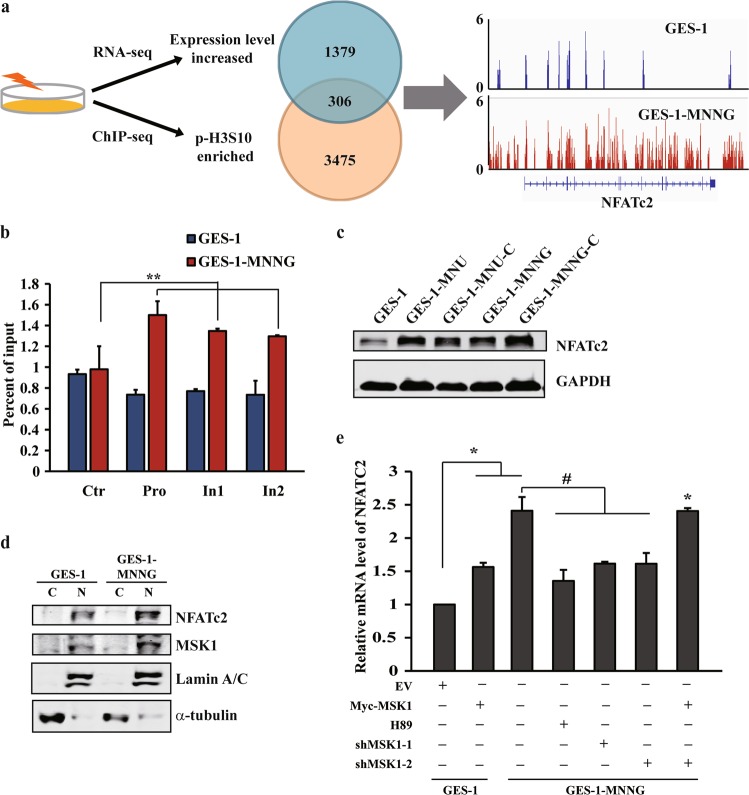
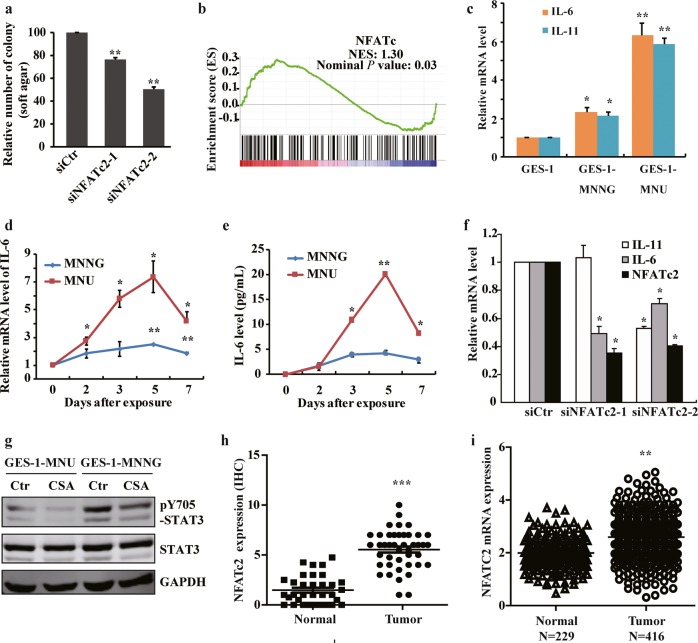
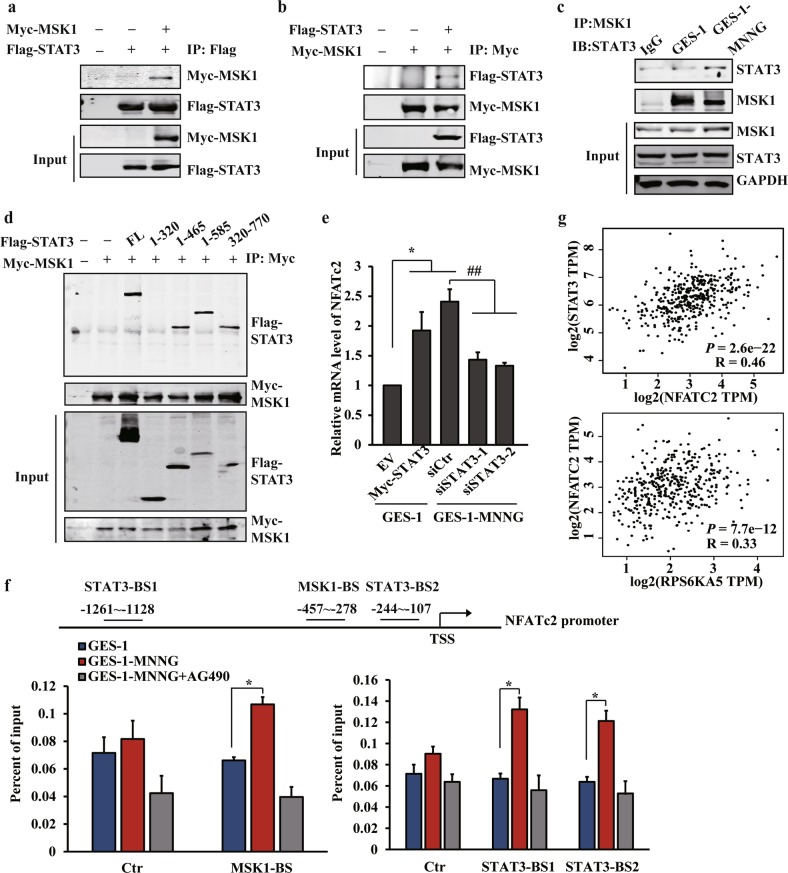
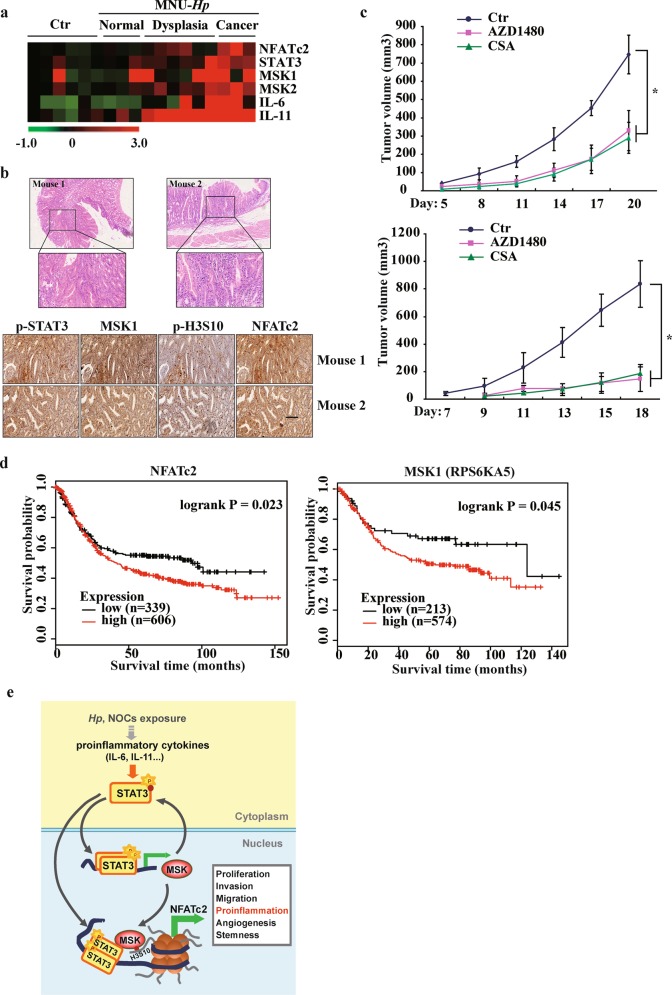
Epigenetic abnormalities contribute significantly to the development and progression of gastric cancer. However, the underlying regulatory networks from oncogenic signaling pathway to epigenetic dysregulation remain largely unclear. Here we showed that STAT3 signaling, one of the critical links between inflammation and cancer, acted as a control pathway in gastric carcinogenesis. STAT3 aberrantly transactivates the epigenetic kinase mitogen- and stress-activated protein kinase 1 (MSK1), thereby phosphorylating histone H3 serine10 (H3S10) and STAT3 itself during carcinogen-induced gastric tumorigenesis. We further identified the calcium pathway transcription factor NFATc2 as a novel downstream target of the STAT3-MSK1 positive-regulating loop. STAT3 forms a functional complex with MSK1 at the promoter of NFATc2 to promote its transcription in a H3S10 phosphorylation-dependent way, thus affecting NFATc2-related inflammatory pathways in gastric carcinogenesis. Inhibiting the STAT3/MSK1/NFATc2 signaling axis significantly suppressed gastric cancer cell proliferation and xenograft tumor growth, which provides a potential novel approach for gastric carcinogenesis intervention by regulating aberrant epigenetic and transcriptional mechanisms.


Conflict of interest statement

The authors declare that they have no conflict of interest.

Figures

Fig. 1
Fig. 1. STAT3 contributes to enhanced H3S10 phosphorylation in gastric carcinogenesis.
a Representative image of NOC (N-methyl-N-nitroso-urea, MNU) and H. pylori plus NOC -induced mouse model of gastric cancer. b HE staining of stomach tissues from the carcinogen-treated mice. c Histone H3 phosphorylation was analyzed by WB of stomach tissues from the carcinogen-treated mice at different times. d WB analysis of signaling pathways related to cell proliferation in GES-1 and NOC-treated cells with the indicated antibodies. e Cell colony-forming ability in soft agar of p-H3S10 increased or unchanged subcloned NOC-treated cells. f, g AG490 50 μM, SB203580 10 μM, AZD1480 2 μM, Tocilizumab 10 μM, scramble siRNA (siCtr) or STAT3 siRNA were used to treat the MNU-transformed cells, respectively. The level of p-H3S10 was determined by WB. h STAT3 expression score by IHC in 52 paired gastric cancer tissues. i The representative images of STAT3 and p-H3S10 levels in human gastric cancer tissues by IHC. Scale bar: 200μm. The analyses were repeated three times, and the results were expressed as mean ± SD. */#p < 0.05, **p < 0.01, ***p < 0.001. GES-1-MNNG or GES-1-MNU: MNNG- or MNU-induced malignantly transformed GES-1 cell; GES-1-MNNG-C or GES-1-MNU-C: subcloned cells derived from GES-1-MNNG or GES-1-MNU.
Fig. 2
Fig. 2. MSK1 phosphorylates H3S10 during carcinogen-induced transformation and is crucial for gastric cancer cell proliferation.
a The heatmap of RNA-seq analysis of H3S10 kinases in GES-1 and NOC-transformed cells. b RT-qPCR analysis of the mRNA expression of MSKs in NOC-transformed cells. c MSK1 phosphorylation and total protein, p-H3S10 levels in NOC-transformed cells detected by WB analysis. d p-H3S10 level was determined by WB after H89 10 μM, AZD1152 treatment for 24 h or e MSK1 stably silenced in NOC-transformed cells. f Soft agar and g xenograft assay (n = 6) were performed after H89 treatment or MSK1 stably silenced in NOC-transformed cells cells. h p-H3S10 level was determined by WB after overexpression of MSK1 wild-type and inactive mutant (Mut), or treated with H89 in AGS cells. i MSK1 expression score in 52 paired gastric cancer tissues by IHC. j Analysis of MSK1 expression in GEO dataset (GSE60427). The analyses were repeated three times, and the results were expressed as mean ± SD. *p < 0.05, **p < 0.01, ***p < 0.001.
Fig. 3
Fig. 3. STAT3 induces transcriptional activation of MSK1 and forms a positive feedback loop with MSK1.
a, b RT-PCR analysis of MSK1 expression after STAT3 overexpression or siRNA knockdown in GES-1 or NOC-transformed cells. c NOC-transformed cells were treated with vehicle or AG490. The binding of STAT3 in the specific sites of MSK1 promoter were analyzed by ChIP-qPCR with anti-STAT3 antibody. Ctr: control site. BS1: binding site 1. BS2: binding site 2. d pLG3-MSK1 promoter constructs and STAT3 full-length or muntants were co-transfected into the cells, and the transcriptional activity of MSK1 promoter was analyzed by the luciferase reporter assay. e STAT3 Y705 or S727 phosphorylation levels were examined by WB with the specific antibodies in malignantly transformed cells. f STAT3 phosphorylation levels in the transformed cells following MSK1 siRNA knockdown were detected by WB analysis. g TCGA database analysis of STAT3 expression. h The correlation between STAT3 and MSK1 expression of the TCGA database were generated by GEPIA (Gene Expression Profiling Interactive Analysis, http://gepia.cancer-pku.cn/). The analyses were repeated three times, and the results were expressed as mean ± SD. *p < 0.05, **p < 0.01, ***p < 0.001.
Fig. 4
Fig. 4. NFATc2 is a downstream target of MSK1-mediated H3S10 phosphorylation.
a The overlap of genes with increased expresion in RNA-seq (blue) and enriched p-H3S10 signals in ChIP-seq (orange) results in NOC-transformed cells compared with GES-1 cells. The snapshop of p-H3S10 ChIP-Seq signals at the NFATC2 gene locus in NOC-transformed and GES-1 cells. b ChIP–qPCR of p-H3S10 signals in NOC-transformed and GES-1 cells using the indicated primer pairs. Pro: promoter site. In: intron site. c, d NFATc2 total and nuclear protein levels were detected by WB in GES-1 and NOC-transformed cells. e NFATc2 mRNA expression in GES-1 and NOC-transformed cells with MSK1 overexpression, H89 treatment or MSK1 knockdown. The analyses were repeated three times, and the results were expressed as mean ± SD. */#p < 0.05 and **p < 0.01.
Fig. 5
Fig. 5. NFATc2 contributes to gastric carcinogenesis by affecting the inflammatory pathways.
a Cell anchorage-independent growth in transformed cells with NFATC2 siRNA knockdown. b Gene set enrichment plots of differentially expressed genes belonging to the NFATc pathway in NOC-treated cells. P value is determined by GSEA software. c IL-6 and IL-11 mRNA expression in malignant transformed cells by RT-qPCR. d IL-6 expression by PCR after NOC treatment at different times. e IL-6 production detected by ELISA after NOC treatment at different times. f RT-qPCR analysis of IL-6 and IL-11 mRNA levels after knockdown NFATc2 by siRNA. g The transformed cells were treated by cyclosporine A (CSA) 10 μM for 24 h, and STAT3 Y705 phosphorylation was detected by WB. h and i NFATc2 expression in 52 paired gastric cancer tissues by IHC, and TCGA database analysis, respectively. The analyses were repeated three times, and the results were expressed as mean ± SD. *p < 0.05, **p < 0.01, ***p < 0.001.
Fig. 6
Fig. 6. MSK1 and STAT3 can be recruited to the promoter of NFATC2, and activate its expression by coupling histone phosphorylation.
a, b STAT3 and MSK1 protein interaction was derived from HEK 293T cells following the transfection with Myc-MSK1 and Flag-STAT3 by immunoprecipitation assay (IP). c Endogenous interaction between Stat3 and MSK1 by IP analysis derived from GES-1 or MNNG-transformed cells. d Flag-STAT3 fragments were co-expressed with Myc-MSK1 wild-type in HEK293T cells. After anti-Myc immunoprecipitation, coprecipitated STAT3 was revealed by immunoblotting. e RT-qPCR analysis of NFATc2 mRNA expression after STAT3 overexpression or siRNA knockdown. f The binding of MSK1 (left) or STAT3 (right) to the promoter of NFATc2 was analyzed by ChIP assay with anti-MSK1 or anti-STAT3 antibody in the MNNG-transformed cells treated with vehicle or AG490. Ctr: control site. MSK1-BS: MSK1 binding site. STAT3-BS1: STAT3 binding site 1. STAT3-BS2: STAT3 binding site 2. g The correlation between STAT3 and NFATc2 expression or MSK1 and NFATc2 expression of the TCGA database were analyzed by GEPIA. The analyses were repeated three times, and the results were expressed as mean ± SD. *p < 0.05 and ##p < 0.01.
Fig. 7
Fig. 7. STAT3/MSK1/NFATc2 axis is activated in carcinogen-induced gastric tumorigenesis and correlates with poor prognosis in patients with gastric cancer.
a Heatmap of the mRNA levels of NFATc2, STAT3, MSK1, IL-6 and IL-11 in stomach tissues from mice treated with or without carcinogens. b The representative images of HE staining, p-STAT3 Y705, MSK1, p-H3S10, NFATc2 expression of stomach tissues from the mice treated with carcinogens by IHC. Scale bar: 200 μm. c The tumor volume of xenograft assay (n = 8, for each group) in NOC-transformed cell and gastric cancer cell MKN45 following the inhibition of STAT3 or NFATc2 by AZD1480 or CSA, respectively. The results were expressed as mean ± SD. *p < 0.05. d Kaplan–Meier survival curves by log-rank tests on gastric cancer patients stratified by MSK1 and NFATc2 expression levels for overall survival. e Schematic map of Stat3/MSK1/NFATc2 activation model after carcinogens exposure.

Similar articles

Cited by

References

    1. Bray F, et al. Global cancer statistics 2018: GLOBOCAN estimates of incidence and mortality worldwide for 36 cancers in 185 countries. CA Cancer J. Clin. 2018;68:394–424. doi: 10.3322/caac.21492. - DOI - PubMed
    1. Chen W, et al. Cancer statistics in China, 2015. CA Cancer J. Clin. 2016;66:115–132. doi: 10.3322/caac.21338. - DOI - PubMed
    1. Padmanabhan N, Ushijima T, Tan P. How to stomach an epigenetic insult: the gastric cancer epigenome. Nat. Rev. Gastroenterol. Hepatol. 2017;14:467–478. doi: 10.1038/nrgastro.2017.53. - DOI - PubMed
    1. Yamashita S, et al. Genetic and epigenetic alterations in normal tissues have differential impacts on cancer risk among tissues. Proc. Natl Acad. Sci. USA. 2018;115:1328–1333. doi: 10.1073/pnas.1717340115. - DOI - PMC - PubMed
    1. Muratani M, et al. Nanoscale chromatin profiling of gastric adenocarcinoma reveals cancer-associated cryptic promoters and somatically acquired regulatory elements. Nat. Commun. 2014;5:4361. doi: 10.1038/ncomms5361. - DOI - PubMed