. 2020 Feb 10;11(1):812.
doi: 10.1038/s41467-020-14612-6.

Serum neurofilament light levels in normal aging and their association with morphologic brain changes

Affiliations

Serum neurofilament light levels in normal aging and their association with morphologic brain changes

Michael Khalil et al. Nat Commun. .

Abstract

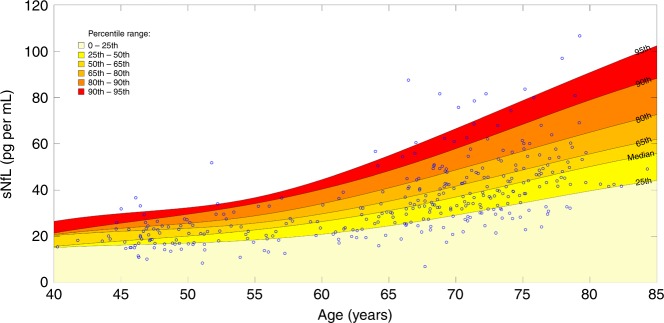
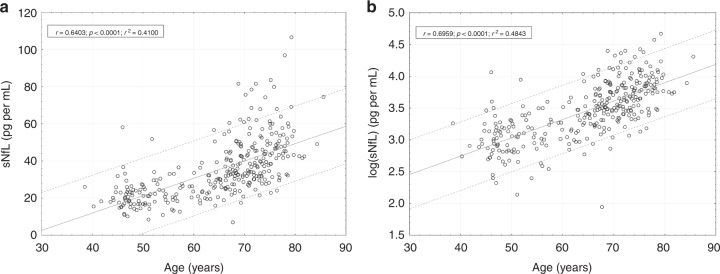
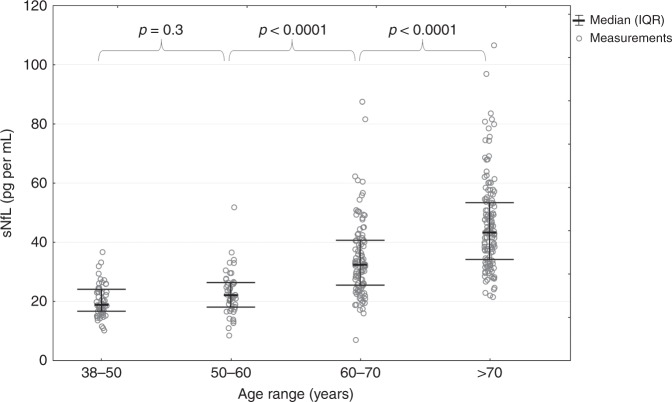
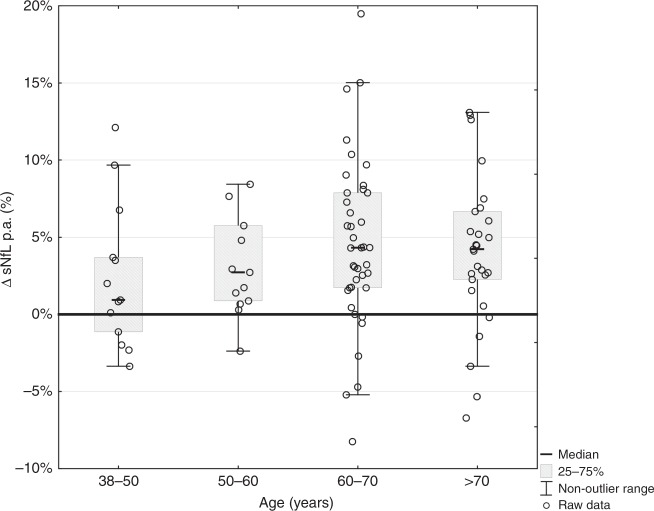
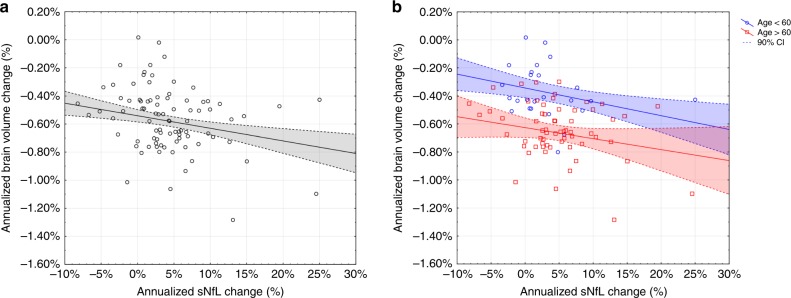
Neurofilament light (NfL) protein is a marker of neuro-axonal damage and can be measured not only in cerebrospinal fluid but also in serum, which allows for repeated assessments. There is still limited knowledge regarding the association of serum NfL (sNfL) with age and subclinical morphologic brain changes and their dynamics in the normal population. We measured sNfL by a single molecule array (Simoa) assay in 335 individuals participating in a population-based cohort study and after a mean follow-up time of 5.9 years (n = 103). Detailed clinical examination, cognitive testing and 3T brain MRI were performed to assess subclinical brain damage. We show that rising and more variable sNfL in individuals >60 years indicate an acceleration of neuronal injury at higher age, which may be driven by subclinical comorbid pathologies. This is supported by a close association of sNfL with brain volume changes in a cross-sectional and especially longitudinal manner.


Conflict of interest statement

The authors declare no competing interests.

Figures

Fig. 1
Fig. 1. Percentile ranges of sNfL.
Percentile range areas of sNfL during the course of normal aging: The spline interpolated PCTL range curves are based on the sNfL measures in each age category (see Table 2 and Table 3). Source data are provided as a Source Data file.
Fig. 2
Fig. 2. Correlation of sNfL with age.
Scatterplot of sNfL over age (a) and logarithmic transformed sNfL values (b). The dashed lines represent the 90% prediction interval, the continuous line denotes the regression line. (r = Pearson regression coefficient, p = two-sided p value). Source data are provided as a Source Data file.
Fig. 3
Fig. 3. Variance of sNfL per age groups.
Variance analysis: original sNfL values for each age category. The p values result from the Brown−Forsythe test, which analyzes the equality of the variance in two adjacent age categories. While the variance in the first two categories can be considered as equal, it is increased significantly in the age categories > 60 years. Source data are provided as a Source Data file.
Fig. 4
Fig. 4. Annualized increase of sNfL per age groups.
Annualized increase of sNfL in different age groups. Bars represent median values of proportional annual change per age group. A substantial higher increase is seen in the age groups above 60 years. sNfL serum neurofilament light, p.a. per annum. Source data are provided as a Source Data file.
Fig. 5
Fig. 5. Brain atrophy and change in sNfL.
Association between brain atrophy and change in sNfL per year in the entire cohort (a) (rs = −0.290, p < 0.01) and divided in younger (age < 60 years = blue) and older subjects (age > 60 years = red) (b). In linear regression analyses, the annualized change in sNfL was identified as independent factor for the development of brain atrophy when considering the entire cohort (β = −0.336, p < 0.001) (a) and older individuals (>60 years) (β = −0.393, p < 0.01) (b). The dashed lines represent the 90% confidence interval. Two data points are outside the scaled range, but included in the analyses. Source data are provided as a Source Data file.

References

    1. Khalil M, et al. Neurofilaments as biomarkers in neurological disorders. Nat. Rev. Neurol. 2018;14:577–589. doi: 10.1038/s41582-018-0058-z. - DOI - PubMed
    1. Engelborghs S, et al. Consensus guidelines for lumbar puncture in patients with neurological diseases. Alzheimer’s Dement. (Amst., Neth.) 2017;8:111–126. - PMC - PubMed
    1. Rissin DM, et al. Single-molecule enzyme-linked immunosorbent assay detects serum proteins at subfemtomolar concentrations. Nat. Biotechnol. 2010;28:595–599. doi: 10.1038/nbt.1641. - DOI - PMC - PubMed
    1. Disanto G, et al. Serum neurofilament light: a biomarker of neuronal damage in multiple sclerosis. Ann. Neurol. 2017;81:857–870. doi: 10.1002/ana.24954. - DOI - PMC - PubMed
    1. Gisslén M, et al. Plasma concentration of the neurofilament light protein (NFL) is a biomarker of CNS injury in HIV infection: a cross-sectional study. EBioMedicine. 2016;3:135–140. doi: 10.1016/j.ebiom.2015.11.036. - DOI - PMC - PubMed

Publication types

MeSH terms