. 2020 Feb 10;11(1):821.
doi: 10.1038/s41467-020-14442-6.

Immunological history governs human stem cell memory CD4 heterogeneity via the Wnt signaling pathway

Affiliations

Immunological history governs human stem cell memory CD4 heterogeneity via the Wnt signaling pathway

Hassen Kared et al. Nat Commun. .

Abstract

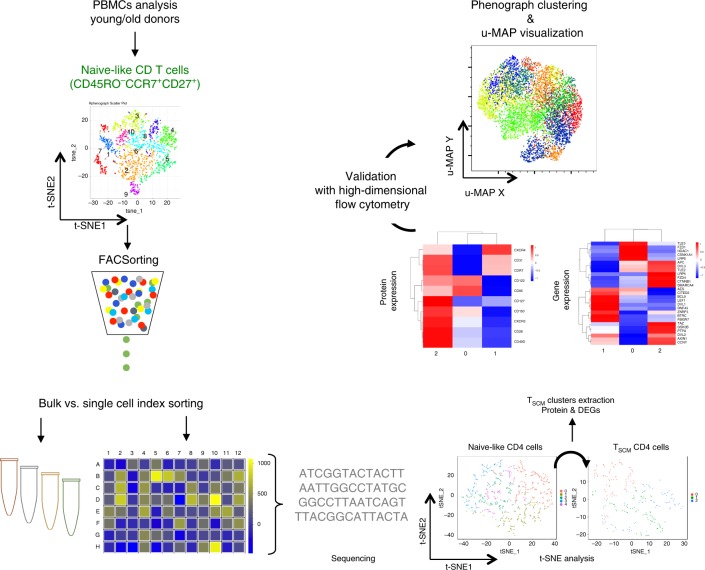
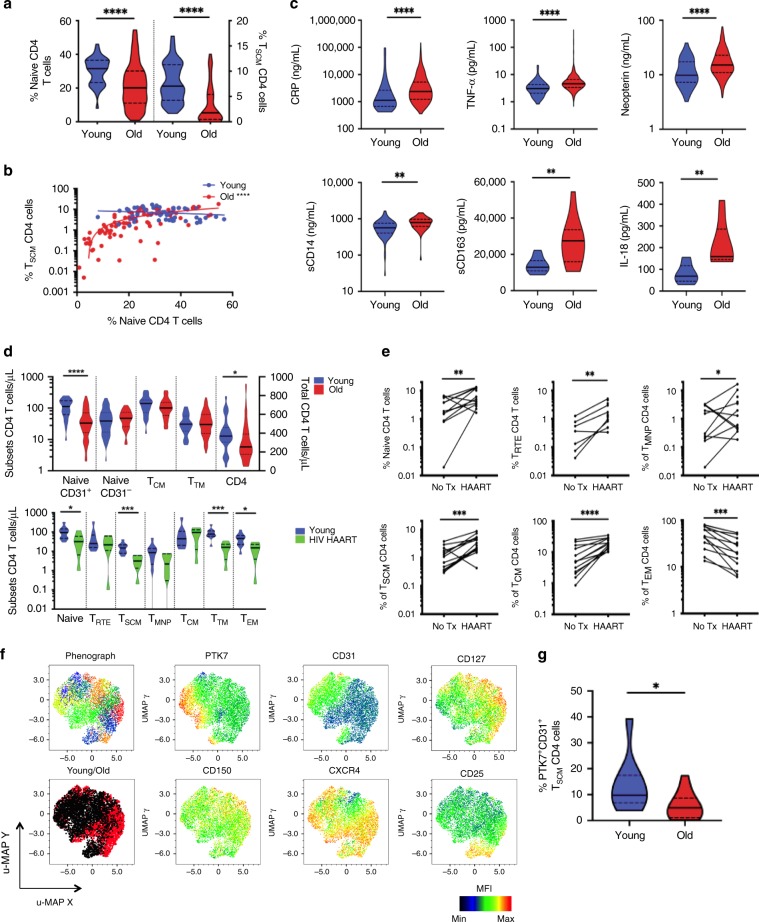
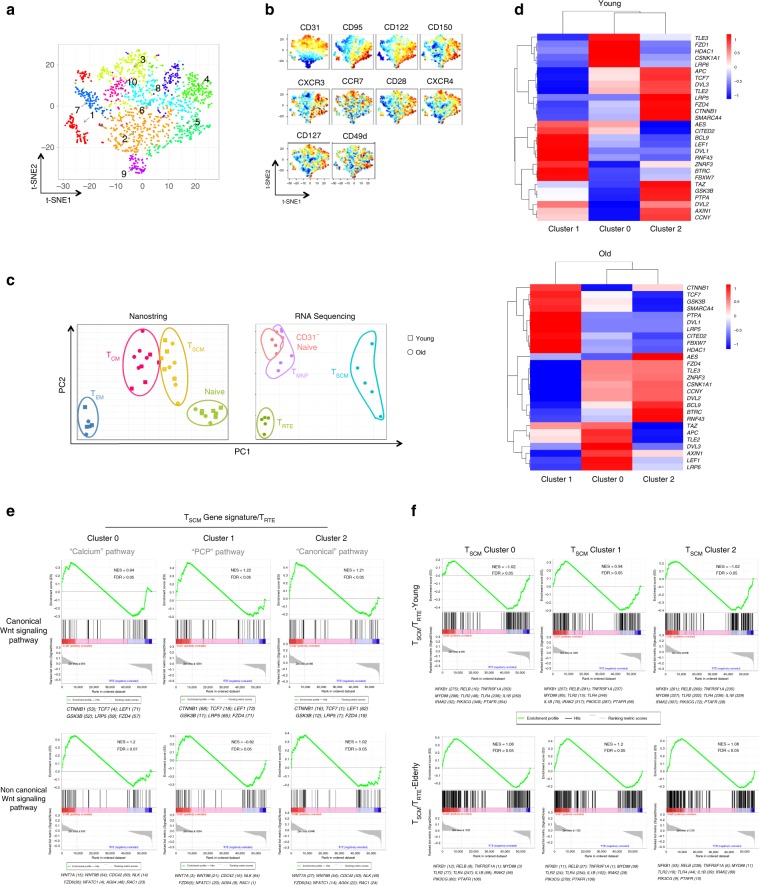
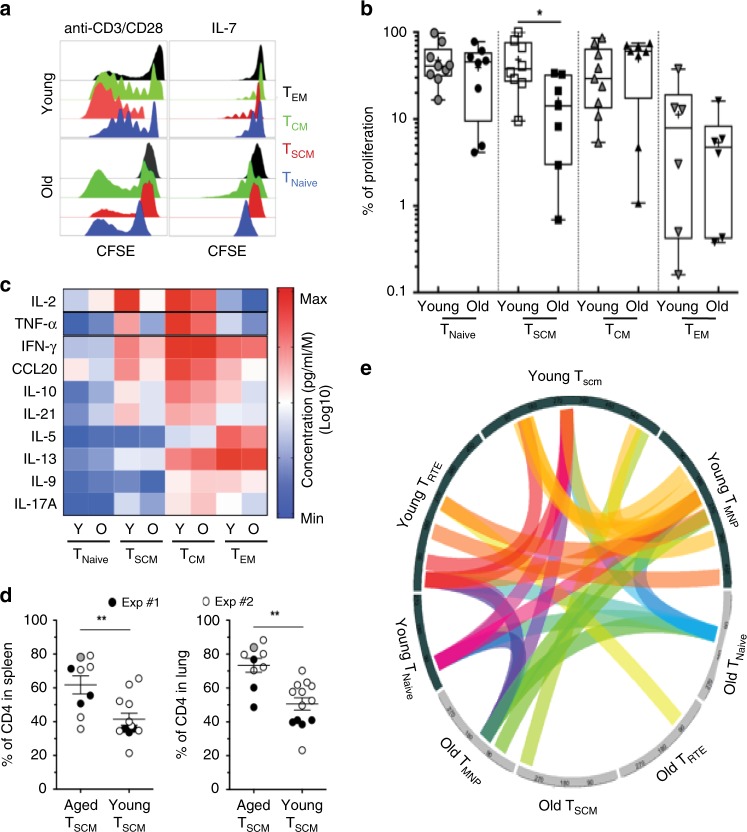
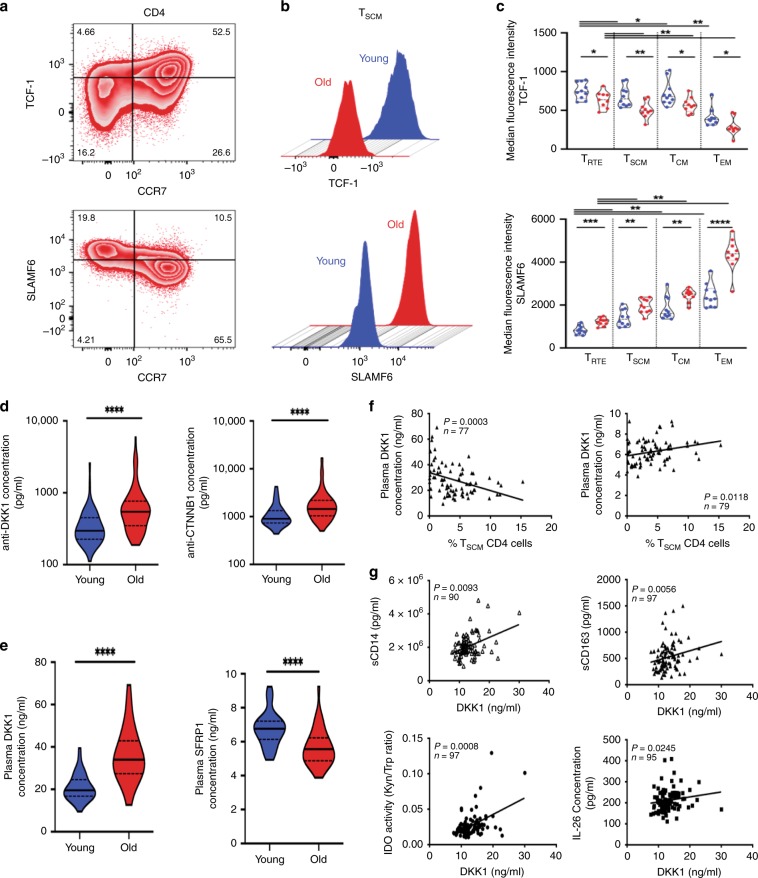
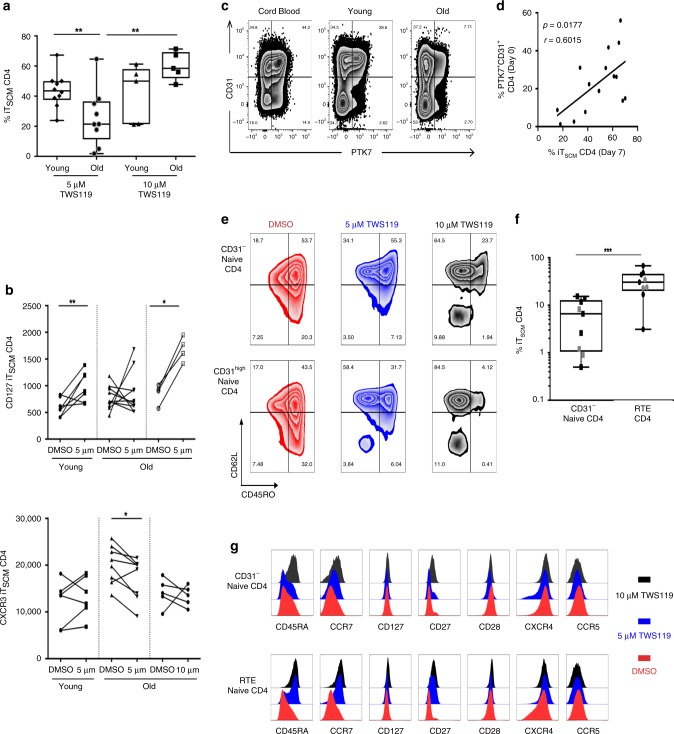
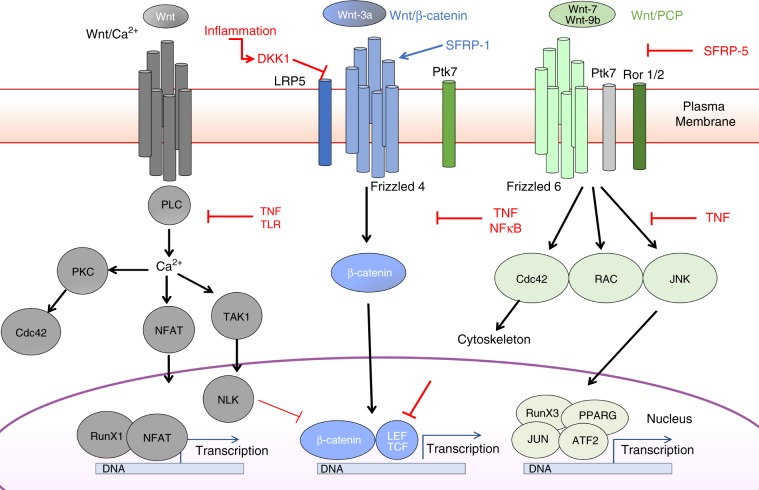
The diversity of the naïve T cell repertoire drives the replenishment potential and capacity of memory T cells to respond to immune challenges. Attrition of the immune system is associated with an increased prevalence of pathologies in aged individuals, but whether stem cell memory T lymphocytes (TSCM) contribute to such attrition is still unclear. Using single cells RNA sequencing and high-dimensional flow cytometry, we demonstrate that TSCM heterogeneity results from differential engagement of Wnt signaling. In humans, aging is associated with the coupled loss of Wnt/β-catenin signature in CD4 TSCM and systemic increase in the levels of Dickkopf-related protein 1, a natural inhibitor of the Wnt/β-catenin pathway. Functional assays support recent thymic emigrants as the precursors of CD4 TSCM. Our data thus hint that reversing TSCM defects by metabolic targeting of the Wnt/β-catenin pathway may be a viable approach to restore and preserve immune homeostasis in the context of immunological history.


Conflict of interest statement

The authors declare no competing interests.

Figures

Fig. 1
Fig. 1. Study design.
Workflow of high-dimensional analysis to characterize the heterogeneity of human CD4 TSCM cells. Arrows represent in vitro or in silico experiments, respectively. CCR7+CD45ROCD27+ CD4 T cells from young (n = 4) and elderly donors (n = 4) were index sorted and distributed as single cells in 96-well plates (two plates per donor) (1). The MFI corresponding to surface protein expression for each individual cell was recorded for CD28, CD31, CD49d, CD95, CD122, CD127, CD150, CXCR3, CXCR4, and CCR7. A library of DNA sequences was established after the RNA extraction of each individual cell (2). The analysis of single-cell RNA-seq data was reported with t-SNE to identify the clusters of cells with similar profile of gene expression (3). Levels of CD95 protein expression were overlaid on the different clusters to identify clusters that were enriched in TSCM (4). The clusters corresponding to CD4 TSCM were extracted and re-analyzed by t-SNE (5). The heterogeneity of CD4 TSCM was validated with FACS Symphony high-dimensional flow cytometry staining (6).
Fig. 2
Fig. 2. Heterogeneity of CD4 TSCM cells and Wnt signaling.
a Depletion of TSCM CD4 cells during aging. Freshly isolated PBMCs were collected and stained for flow cytometry. The statistical analysis was performed on unpaired samples (U Mann–Whitney test) (**** for p < 0.0001). b Relationship between naive T-cell subsets during aging. The frequencies of TSCM and naive T cells were compared in young and old individuals (Spearman's rank-order test, p < 0.0001, r = 0.749). c Inflammation and aging. Pro-inflammatory molecules were measured in the plasma of young and older donors (n = 99 and n = 874, respectively). The statistical analysis was performed on unpaired samples (U Mann–Whitney test) (** and **** for p < 0.01 and p < 0.0001, respectively). d Rarefaction of CD31 expressing naive CD4 T cells and TSCM CD4 cells during aging and chronic HIV infection. Staining was performed on freshly collected blood of young (n = 28) and elderly donors (n = 70). Total CD4 T cells (right Y-axis) or CD4 T-cell subsets (left Y-axis) were enumerated during aging. Absolute counts were monitored in the peripheral blood of Malaysian cohort of healthy donors (n = 10) versus cART-treated HIV-infected patients (n = 6). The statistical analysis was performed on unpaired samples (U Mann–Whitney test; *, **, ***, and **** for p < 0.05, p < 0.01, p < 0.001, and p < 0.0001, respectively). e Restoration of CD4 T-cells distribution after successful HIV therapy. Longitudinal follow-up of CD4 T-cells subsets frequency was performed before and 48 weeks after the initiation of cART. The statistical analysis was performed on paired samples (Wilcoxon signed-rank test) (**, ***, and **** for p < 0.01, p < 0.001, and p < 0.0001, respectively). f Heterogeneity of CD4 TSCM by high-dimensional single-cell flow cytometry staining. CD4 TSCM cells of 20 donors were concatenated. CD4 TSCM clusters were visualized by phenograph and by a cold to hot heatmap, representing the intensity of each marker. Their distribution during aging was represented by the overlaid populations of CD4 TSCM from young and old patients. g Decreased of “RTE-like” CD4 TSCM cluster during aging. The frequency of CD31+PTK7+ TSCM CD4 cells was quantified by flow cytometry. The statistical analysis was performed on unpaired samples (Mann–Whitney, * for p < 0.05). Source data are provided as a Source Data file for all figures except (f).
Fig. 3
Fig. 3. Heterogeneity of the TSCM and differential engagement of Wnt signaling.
a Heterogeneity of naive CD4 T cells revealed by high-dimension flow cytometry. Naive CD4 T cells of eight donors (four young and four old donors), defined as CCR7+CD45ROCD27+, were concatenated and analyzed by t-SNE. Clusters were visualized by phenograph. b Phenotype of naive CD4 T-cell clusters. The intensity of fluorescence for each marker was visualized by a normalized heatmap (gradient of increased expression from blue to red). c Preservation of specific gene signature of CD4 TSCM cells during aging. Naive, TSCM, TCM, and TEM CD4 T cells (n = 5 for all subsets by age except TEM, n = 3) were sorted, and analyzed for their gene expression by nanostring. Naive T-cell subsets were sorted as naive, TRTE, TMNP, and TSCM CD4 cells and analyzed by RNA-seq (n = 5). PCA analysis of mRNA expression was performed to evaluate the specificity and preservation of T-cell subsets signature during aging. d Heterogeneity of the CD4 TSCM and Wnt/β-catenin signaling pathway. Identification of CD4 TSCM clusters in young and old donors by scRNAseq. Single cells corresponding to CD4 TSCM in all naive CD4 T cells subsets from young (n = 946) or old donors (n = 993) were analyzed by t-SNE, and clusters were automatically identified. The expression of genes coding for the Wnt/β-catenin pathway was quantified and normalized for each cluster in young and old donors. e Canonical and noncanonical Wnt signaling signatures in CD4 TSCM clusters from young donors. The enrichment of gene expression detected in CD4 TSCM clusters for each pathway was calculated in comparison with TRTE signature. Enrichment plot of the gene set reported by GSEA as most enriched among all canonical and noncanonical signaling pathway gene sets (GO:0016055). The profile shows running enrichment score (green curve) and positions of gene set members (black vertical bars) on the rank ordered list of differential gene expression. f Inflammatory signature in CD4 TSCM clusters from young and old donors. Enrichment plot of the gene set reported by GSEA as most enriched among all inflammatory gene sets (GO:0006954). The profile was displayed as in (e).
Fig. 4
Fig. 4. Functions of TSCM CD4 cells during aging.
a Proliferation profile of CD4 T-cell subsets during aging. Representative histogram of CFSE dilution from sorted T-cell subsets collected in young or older donors and stimulated with anti-CD3/CD28 microbeads or IL-7 (10 ng/ml) during 5 days. b Alteration of proliferative potential of TSCM CD4 cells in response to TCR stimulation as measured in (a). T-cells subsets were freshly isolated from blood of young and older donors (n = 8 and 9, respectively). The statistical analysis was performed on unpaired samples (U Mann–Whitney test) (* for p < 0.05). Source data are provided as a Source Data file. c Decreased secretion of homeostatic and effector cytokines by TSCM CD4 cells during aging. Sorted CD4 T-cell subsets were polyclonally stimulated with PMA/Ionomycin. The cytokines concentration was represented by an heatmap to visualize the acquisition of effector functions during differentiation and the specific signature associated with aging (n = 6 for young and old donors). Source data are provided as a Source Data file. d Increased engraftment of human TSCM CD4 cells from aged donors in humanized NOD SCID gamma chain (NSG) mice. TSCM CD4 cells from young (n = 2) or old donors (n = 2) were differentiated from T-naive precursors, expanded in vitro before their xenotransplantation into NSG mice (n = 13 and n = 9, respectively). At 21 (Exp#1) or 28 (Exp#2) days after the human TSCM CD4 cells transfer, animals were killed and euthanized by CO2, and tissues were collected (spleen, lungs). N = 2 independent experiments were performed and labeled by the color code on the graph (filled circles: Exp#1; open circles: Exp#2; filled gray circle represents the mouse with GVHD signs and killed at day 16). The statistical analysis was performed on unpaired samples (U Mann–Whitney test) (** for p < 0.01). e Reduced CDR3 diversity in naive CD4 T cells. Naive T-cell subsets were sorted as naive, TRTE, TMNP, and TSCM CD4 cells. The extraction of mRNA was performed just after T-cell sorting, and analyzed by RNA-seq. CDR3 composition was compared between cell subsets and during aging. A connective arc represented high degree of homology (80%) between CDR3 sequences during differentiation and aging.
Fig. 5
Fig. 5. Regulation of TSCM CD4 cells homeostasis during aging.
a TCF-1 and SLAMF-6 expression in CD4 T cells. Representative zebra plots of SLAMF-6 and TCF-1 staining in CD4 T cells from a representative old individual. b TCF-1 and SLAMF-6 expression in TSCM CD4 cells during aging. Representative overlaid histograms plots of SLAMF-6 and TCF-1 expression in gated TSCM CD4 cells from young (n = 10) and older (n = 10) individuals. c Decreased expression of TCF-1 during CD4 T-cell differentiation and aging. The median fluorescence intensity of TCF-1 was measured in T-cell subsets. The statistical analysis was performed on paired (n = 20, Wilcoxon signed-rank test) or unpaired samples (n = 20, Mann–Whitney; *, **, ***, and **** for p < 0.05, p < 0.01, p < 0.001, and p < 0.0001, respectively). Source data are provided as a Source Data file. d Alternative activation of Wnt/β-catenin pathway by DKK-1 during aging. Cryopreserved plasma was used to measure autoantibodies directed against molecules involved in the Wnt/β-catenin pathway (n = 93 and n = 60 in young and old, respectively). The statistical analysis of immunone protein array data was performed on unpaired samples (U Mann–Whitney test, **** for p < 0.0001). Source data are provided as a Source Data file. e Modulation of the natural inhibitor and agonist of the Wnt/β-catenin pathway during aging. The plasmatic concentration of DKK-1 and SFRP1 was measured directly by ELISA (n = 43 and n = 37 in young and old donors, respectively). The statistical analysis was performed on unpaired samples (U Mann–Whitney test, **** for p < 0.0001). Source data are provided as a Source Data file. f Regulation of TSCM CD4 cells by DKK-1 and SFRP1. The frequency of TSCM CD4 cells correlated negatively or positively with the systemic concentration of DKK-1 and SFRP1, respectively (p = 0.0003 and p = 0.0118) (n = 77). The correlations were calculated with the Spearman’s rank-order test. Source data are provided as a Source Data file. g Inflammation and DKK-1 plasma levels. The concentration of DKK-1, sCD14, sCD163, and IL-26 was measured directly by ELISA. Plasma levels of tryptophan and L-kynurenine were measured by LC-MS/MS. The correlations were calculated with the Spearman’s rank-order test. Source data are provided as a Source Data file.
Fig. 6
Fig. 6. Regulation of TSCM CD4 cells homeostasis during aging.
a Hyporesponsiveness of the Wnt/β-catenin pathway during aging. The frequency of specifically TWS119-induced TSCM CD4 cells was evaluated by flow cytometry, and calculated after the subtraction of nonspecific DMSO-induced TSCM CD4 cells frequencies. The statistical analysis was performed on unpaired samples (U Mann–Whitney test, ** for p < 0.01). Source data are provided as a Source Data file. b CD127 expression characterizes induced-TSCM CD4 cells. The phenotype of induced-TSCM CD4 T cells was performed at day 7. The statistical analysis was performed on paired samples (Wilcoxon signed-rank test) (* and ** for p < 0.05 and p < 0.01, respectively). Source data are provided as a Source Data file. c Identification of recent thymic emigrants in cord blood or in peripheral blood of young and old donors by flow cytometry. TRTE were defined as PTK7+CD31+CD4 T cells. d Induction of TSCM CD4 cells from TRTE cells. The correlations between ex vivo TRTE and in vitro TWS119-induced TSCM CD4 cells at day 7 were calculated with the Spearman’s rank-order test (n = 15). Source data are provided as a Source Data file. e TSCM CD4 cells induction depends on CD31 expression in naive CD4 T cells. Flow cytometry staining of TWS119 dose-dependent induced-TSCM CD4 T cells derived from CD31 or CD31high naive CD4 T cells. f Increased potential of CD31high naive to TSCM CD4 cells differentiation. Frequencies of TSCM CD4 cells derived from CD31 or CD31high naive CD4 T cells in response to the stimulation of the Wnt/β-catenin pathway with low dose of TWS119 (5 μM). Young and old donors are represented with black and gray symbols, respectively. The statistical analysis was performed on paired samples (Wilcoxon signed-rank test) (***for p < 0.001). Source data are provided as a Source Data file. g Phenotype of induced TSCM from TRTE and CD31low naive CD4 T cells. Flow cytometry staining of induced-TSCM CD4 cells derived from CD31 or CD31high (TRTE) naive CD4 T cells. Histograms represented overlaid expression of individual markers after 7 days of culture in presence of vehicle alone (DMSO) or Wnt/β-catenin stimulating drug (TWS119) at 5 or 10 μM.
Fig. 7
Fig. 7. Wnt Signaling pathway in CD4 TSCM during aging and inflammation.
Graphical summary of key molecules involved in the specific signature of individual TSCM cluster identified by scRNAseq gene expression analysis. Gray, blue, and green boxes represented highlighted molecules in Wnt/calcium, Wnt/β-catenin, and Wnt/PCP, respectively. Red arrows and characters summarized the alterations of Wnt signaling observed in aged donors and/or chronic inflammation described in this study.

Similar articles

Cited by

References

    1. Fearon DT, Manders P, Wagner SD. Arrested differentiation, the self-renewing memory lymphocyte, and vaccination. Science. 2001;293:248–250. doi: 10.1126/science.1062589. - DOI - PubMed
    1. Graef P, et al. Serial transfer of single-cell-derived immunocompetence reveals stemness of CD8(+) central memory T cells. Immunity. 2014;41:116–126. doi: 10.1016/j.immuni.2014.05.018. - DOI - PubMed
    1. Demkowicz WE, Jr., Littaua RA, Wang J, Ennis FA. Human cytotoxic T-cell memory: long-lived responses to vaccinia virus. J. Virol. 1996;70:2627–2631. doi: 10.1128/JVI.70.4.2627-2631.1996. - DOI - PMC - PubMed
    1. Hammarlund E, et al. Duration of antiviral immunity after smallpox vaccination. Nat. Med. 2003;9:1131–1137. doi: 10.1038/nm917. - DOI - PubMed
    1. Capece T, et al. A novel intracellular pool of LFA-1 is critical for asymmetric CD8(+) T cell activation and differentiation. J. Cell Biol. 2017;216:3817–3829. doi: 10.1083/jcb.201609072. - DOI - PMC - PubMed

Publication types