. 2020 Feb 11;10(1):1936.
doi: 10.1038/s41598-020-58709-w.

Nanocatalytic activity of clean-surfaced, faceted nanocrystalline gold enhances remyelination in animal models of multiple sclerosis

Affiliations

Nanocatalytic activity of clean-surfaced, faceted nanocrystalline gold enhances remyelination in animal models of multiple sclerosis

Andrew P Robinson et al. Sci Rep. .

Abstract

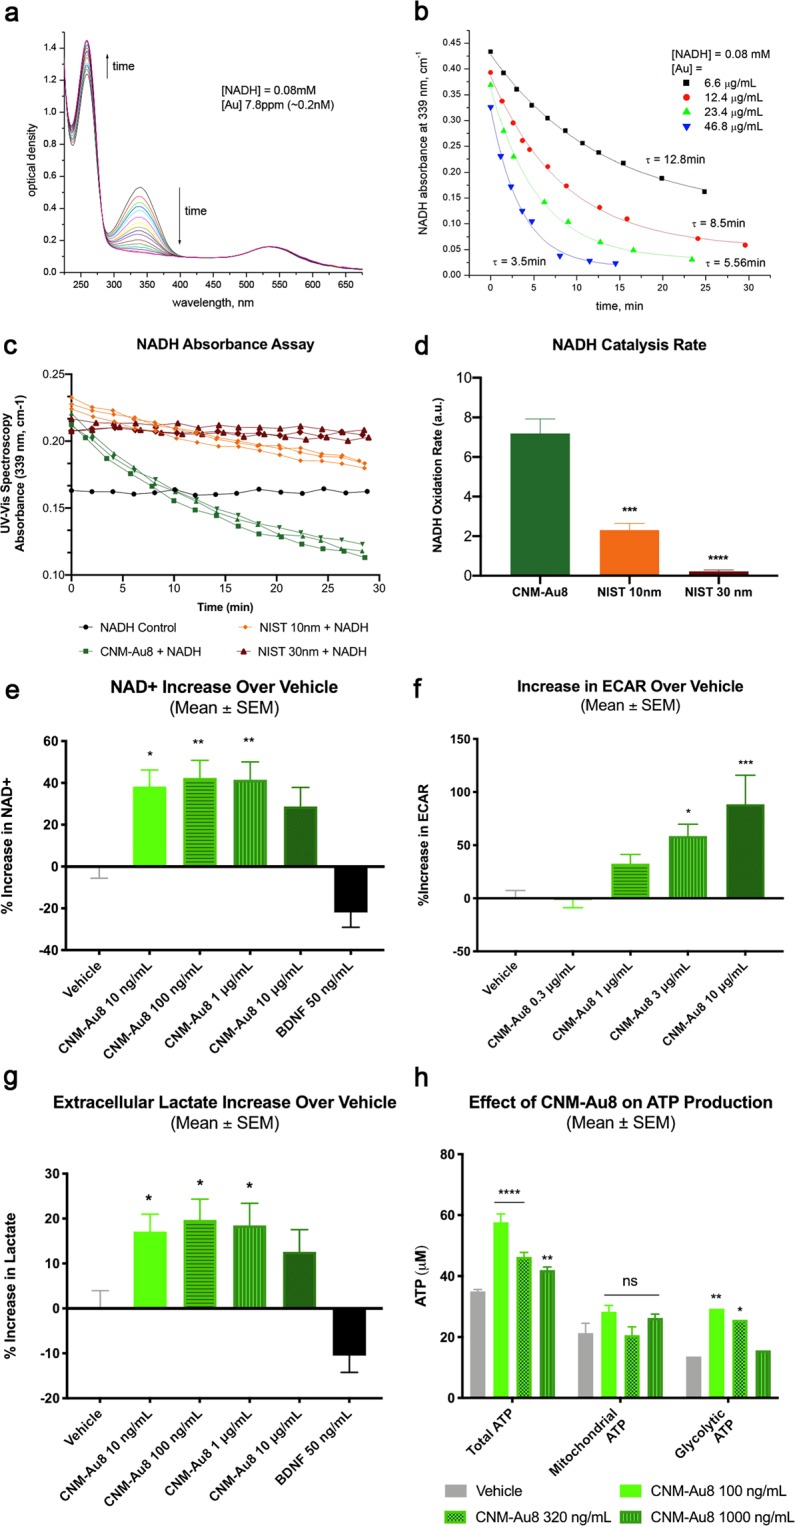
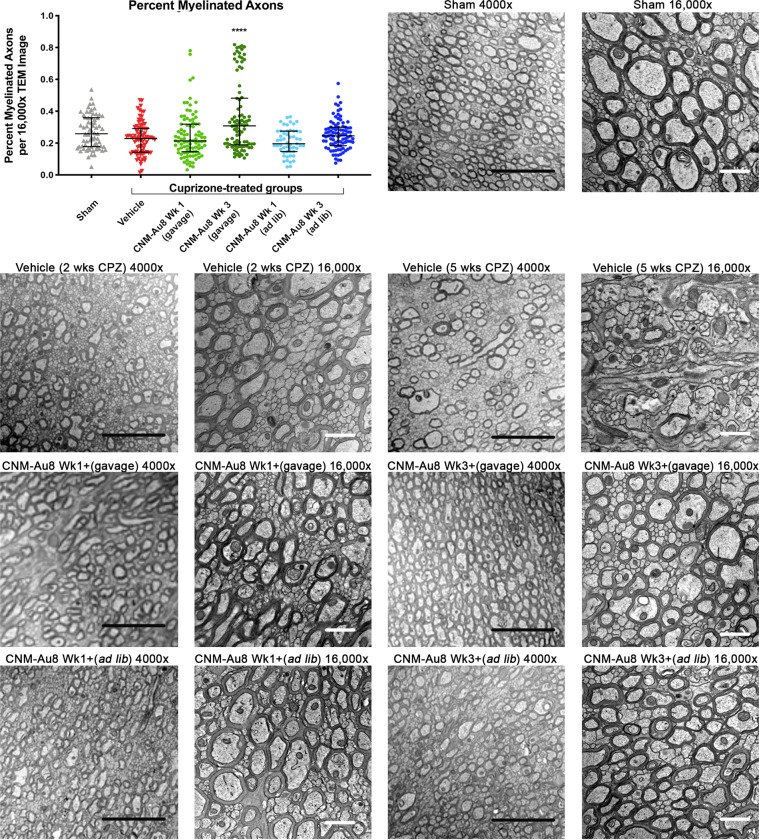
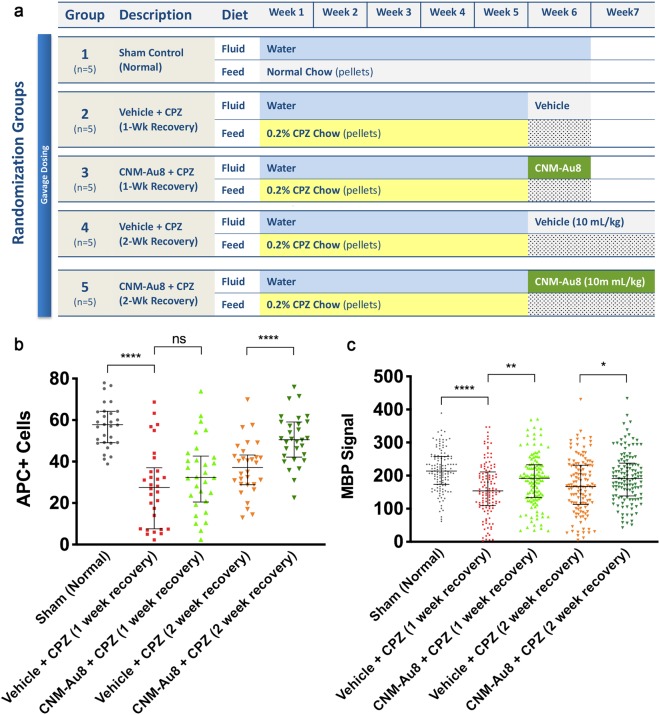
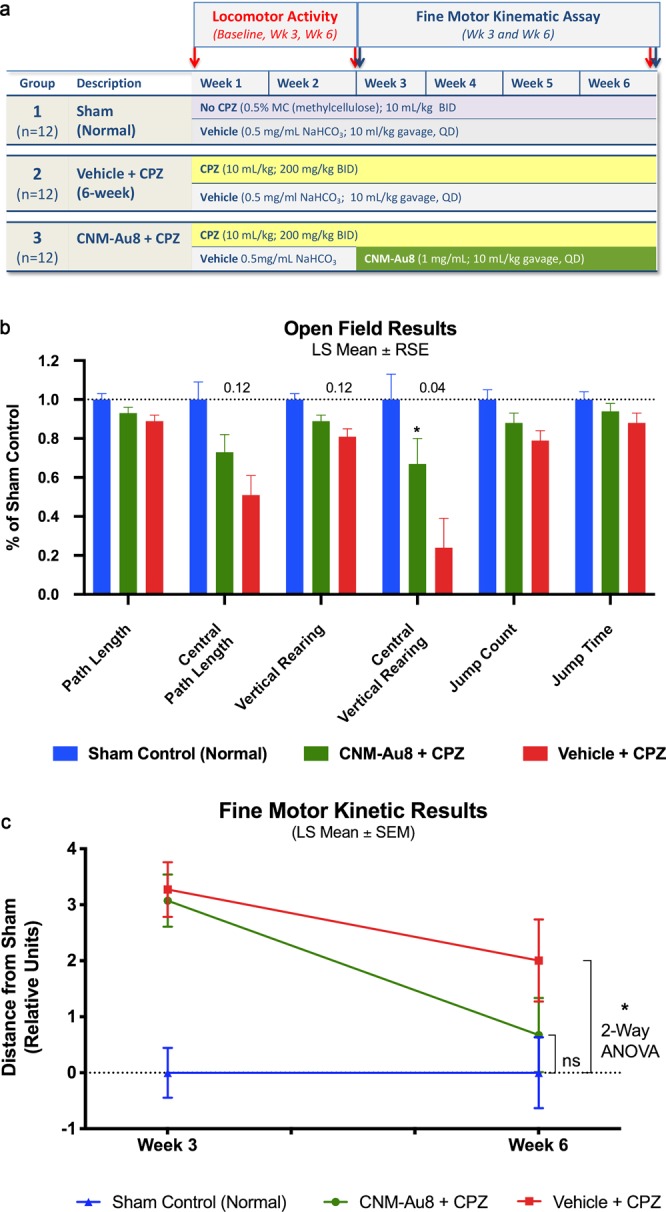
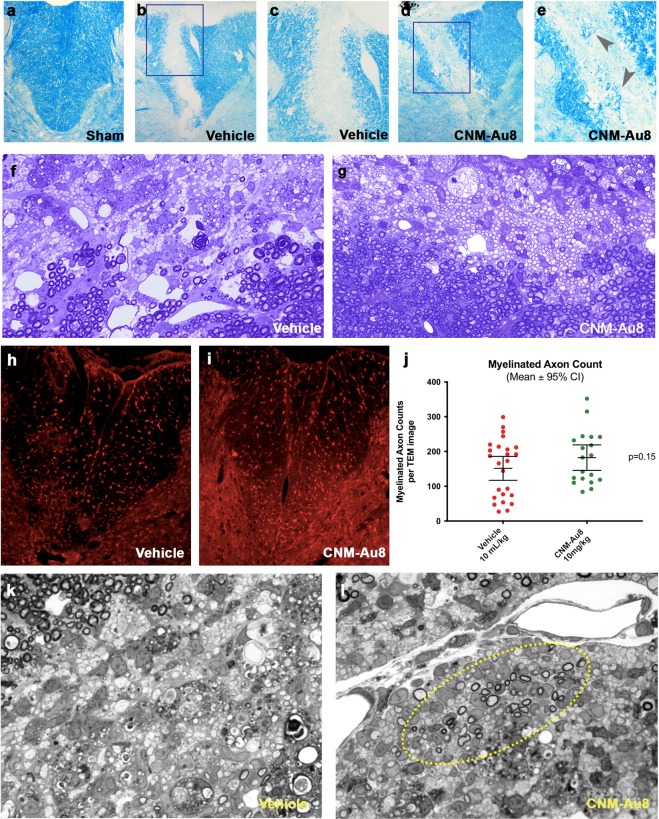
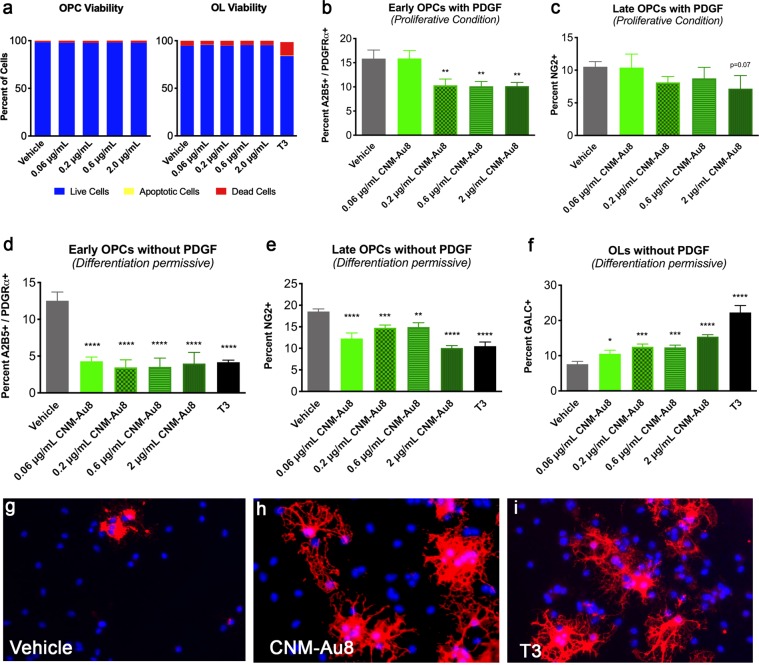
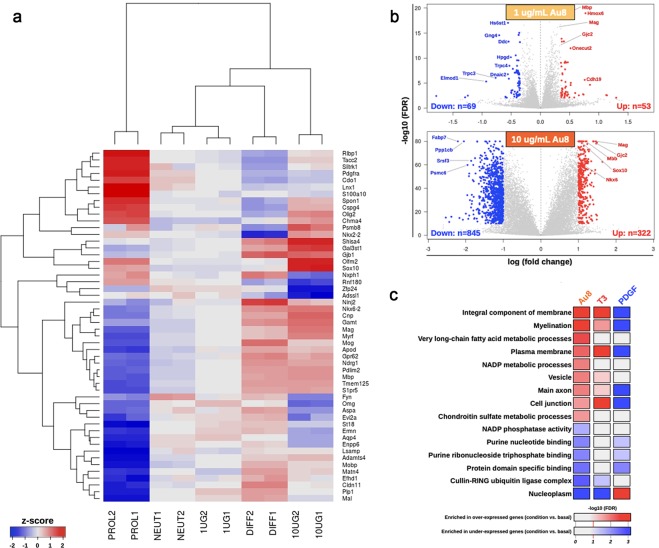
Development of pharmacotherapies that promote remyelination is a high priority for multiple sclerosis (MS), due to their potential for neuroprotection and restoration of function through repair of demyelinated lesions. A novel preparation of clean-surfaced, faceted gold nanocrystals demonstrated robust remyelinating activity in response to demyelinating agents in both chronic cuprizone and acute lysolecithin rodent animal models. Furthermore, oral delivery of gold nanocrystals improved motor functions of cuprizone-treated mice in both open field and kinematic gait studies. Gold nanocrystal treatment of oligodendrocyte precursor cells in culture resulted in oligodendrocyte maturation and expression of myelin differentiation markers. Additional in vitro data demonstrated that these gold nanocrystals act via a novel energy metabolism pathway involving the enhancement of key indicators of aerobic glycolysis. In response to gold nanocrystals, co-cultured central nervous system cells exhibited elevated levels of the redox coenzyme nicotine adenine dinucleotide (NAD+), elevated total intracellular ATP levels, and elevated extracellular lactate levels, along with upregulation of myelin-synthesis related genes, collectively resulting in functional myelin generation. Based on these preclinical studies, clean-surfaced, faceted gold nanocrystals represent a novel remyelinating therapeutic for multiple sclerosis.


Conflict of interest statement

J.Z.Z., M.M., A.R.D., K.S.H., M.T.H. and M.G.M. are employees of Clene Nanomedicine and receive salary and stock options. All other authors have no competing interests to declare.

Figures

Figure 1
Figure 1
Nanocatalysis by CNM-Au8 enhances cellular bioenergetics. (a) Changes in absorbance peaks of NADH (339 nm) and NAD+ (259 nm) demonstrate the conversion of NADH to NAD+ with time in the presence of 6.6 μg/mL CNM-Au8. Shown is an overlay of UV-Vis spectra taken at approximately 1 min intervals; total elapsed time of more than 60 minutes. Starting concentration of NADH at t = 0 was 0.08 mM. (b) Dose-dependent catalytic activity of CNM-Au8 (6.6 μg/mL black squares, 12.4 μg/mL red circles, 23.4 μg/mL green triangles, 46.8 μg/mL blue triangles) on the oxidation of NADH as measured by change in absorbance of NADH over time. (c) Catalytic activity of CNM-Au8 compared to two NIST standards, NIST 10 nm (orange) and NIST 30 nm (red), using the same starting concentrations: 3.4 μg/mL Au added to 26 μM NADH in 5.7 mM NaHCO3. No gold control (black) shows stability of 26 μM NADH during the same time frame. (d) Initial rates of catalysis for CNM-Au8, NIST 10 nm, and NIST 30 nm, calculated from curves shown in B. (e) Effect of CNM-Au8 treatment on NAD+ levels, expressed as percent change over vehicle, in primary mesencephalic cultures compared to vehicle (grey), or BDNF control. (f) Extracellular acidification rate (ECAR) of purified murine OLs in response to CNM-Au8 in the first three minutes following glucose challenge as measured in the Seahorse flux analyser, expressed as percent change over vehicle. (g) Extracellular lactate levels in media of primary rat mesencephalic cultures after 48 h treatment with CNM-Au8, expressed as percent change over vehicle. (h) Total, mitochondrial, and glycolytic intracellular ATP levels from human OL M03.13 cells treated with vehicle (grey) or CNM-Au8 (green). (dg) One-way ANOVA, corrected for multiple comparisons. (h)Two-way ANOVA. Quantities shown are group means +/− SEM. *p < 0.05; **p < 0.01; ***p < 0.001; ****p < 0.0001.
Figure 2
Figure 2
Effect of CNM-Au8 in an in vivo cuprizone model of demyelination. Scatterplot (upper left) shows a quantitation of the percent myelinated axons using 16,000x TEM images by treatment group. Six of the seven experimental groups are shown; animals treated with cuprizone and vehicle for only two weeks were not quantitated. Bars show mean and SEM of each group. ****p < 0.0001, one-way ANOVA corrected for multiple comparisons. Representative TEM images of corpus callosum axons in cross section from sham-treated Group 1 animals, cuprizone-treated animals sacrificed at Week 2 (“Vehicle (2 wks CPZ)”), cuprizone-treated animals sacrificed at Week 5 (“Vehicle (5 wks CPZ)”), cuprizone plus gavage-dosed CNM-Au8 treated animals from the prophylactic arm starting at week 1 (“Wk 1+”), cuprizone plus gavage-dosed CNM-Au8 treated animals from the therapeutic arm starting at week 3 (“Wk 3+”), cuprizone plus ad libitum-dosed CNM-Au8 treated animals from the prophylactic arm, and cuprizone plus ad libitum-dosed CNM-Au8 treated animals from the therapeutic arm. Magnifications (4000x and 16,000x) are as labelled; black scale bar = 5 μm; white scale bar = 1 μm.
Figure 3
Figure 3
CNM-Au8 promotes oligodendrocyte maturation when administered post-cuprizone treatment. (a) Experimental design schematic. (b) Quantitation of the number of APC positive cells by immunohistochemical staining of corpus callosum coronal sections from each treatment group. (c) Quantitation of the area of anti-MBP immunohistochemical staining of corpus callosum coronal sections from each treatment group. (b,c), Error bars show median and interquartile range.
Figure 4
Figure 4
Restoration of function by CNM-Au8 in open field test and fine motor kinematic analyses. (a) Schematic of this study design. (b) Quantitation of parameter measures from open field assessments of behaviour in untreated sham mice (blue bars), gavage-administered CNM-Au8 treated animals with cuprizone (green bars), and gavage-administered vehicle treated animals with cuprizone (red bars) expressed as a percentage of sham measurements at Week 6. (c) Principal component analysis of gait metrics showed no statistical difference (p = 0.47) between CNM-Au8 and sham treated groups as compared to a detectable difference in vehicle treated groups vs. sham (p = 0.032; 2-way ANOVA) by week 6. See Materials and Methods for statistical calculations.
Figure 5
Figure 5
Evidence of remyelination at seven and fourteen days post-lesion by CNM-Au8 treatment in a focal demyelination lysolecithin rodent model. Following lysolecithin lesion on Day 0, animals were sacrificed for histological and electron microscope analyses on Day 7 and Day 14, following daily gavage dosing of CNM-Au8 (10 mg/kg/da) or vehicle. (ae) Luxol Fast Blue staining of myelin in spinal cord sections of lesions at Day 7: from sham treated animals (a); lysolecithin lesioned, vehicle treated animals (b,c); and lysolecithin lesioned, CNM-Au8 treated animals (d,e), in which recovery of myelin within lesion area of CNM-Au8 treated animals (d,e) can be seen (grey arrowheads). (a,b,d) 10x magnification; (c,e): 20x magnification. (f,g) toluidine blue staining of myelin in spinal cord sections of lesions at Day 14 from vehicle (f) and CNM-Au8 (g) treated animals showing the distinct ‘honeycomb’ pattern of remyelination in CNM-Au8-treated animals; (f,g): 63x magnification. (h,i) anti-APC staining of mature OL cell bodies within spinal cord sections of lesions from vehicle (h) and CNM-Au8 (i) treated animals. Clusters of mature OLs can be observed in the lesion area of CNM-Au8 treated animals (i). (j) Quantitation of myelinated axon counts from TEM images of spinal sections of lesions by animal showed a 43% increase in myelination in treated animals over vehicle controls (p = 0.15, unpaired t-test). (k,l), Representative high resolution 100x images of spinal cord lysolecithin lesions of animals treated with vehicle (k) and with CNM-Au8. (l) Normal myelination, at the boundary of the lesion, can be observed in each panel at the upper margins of the field of view. Evidence of thinly-wrapped remyelinating axons are shown in (l) (encircled by yellow dashed line).
Figure 6
Figure 6
CNM-Au8 mediated differentiation of immunopanned primary OPCs in culture. (a) Increasing concentrations of CNM-Au8 did not affect OPC or OL viability in culture. (b,c) OPCs supplemented with 0.01 μg/mL PDGF, ‘proliferative conditions,’ do not show a proliferative response when provided with CNM-Au8 in the media compared to vehicle treated controls; cells expressing markers for early (b) and late (c) OPCs show a relative decline in numbers in response to increasing concentrations of CNM-Au8. (df) OPCs grown without PDGF, under ‘differentiation-permissive conditions,’ show a relative increase in cell numbers expressing the mature OL marker GALC (f), while showing a relative decrease in numbers of OPCs expressing early (d) and late (e) OPC markers compared to vehicle treated controls. (gi) representative images of OPCs treated with vehicle (g), 0.6 μg/mL CNM-Au8 (h) and 0.04 μg/mL T3 (i) stained with DAPI to mark cell nuclei and anti-MBP to mark OLs expressing the mature myelin marker. OPCs treated with CNM-Au8 and cells treated with the positive control T3 showed higher numbers of mature OLs with complex cytoplasmic networks indicative of differentiated OLs.
Figure 7
Figure 7
Transcriptomics analyses identified OL differentiation and myelination pathways that are upregulated in response to CNM-Au8. Isolated OPC cultures were treated with vehicle (NEUT1 and NEUT2), 1.0 (1UG1 and 1UG2) or 10.0 μg/mL (10UG1 and 10UG2) CNM-Au8, 0.01 μg/mL PDGF to induce proliferation (PROL1 and PROL2), or 0.04 μg/mL T3 (DIFF1 and DIFF2) to induce differentiation, for 72 h in duplicate. Cells were then processed for RNAseq analyses. (a) The top fifty variable genes in the dataset are displayed in the heatmap, with the name of each gene in each row labeled to the right. Samples were hierarchically clustered (dendrogram at top), demonstrating that CNM-Au8 treated cells’ transcript profiles are closer, but not overlapping, that of T3-treated cells, as compared to PDGF treated cells. (b) Volcano plots of differentially expressed genes, with the identities of upregulated genes known to play a role in differentiation and myelination indicated in red. (c), Gene ontology enrichment analysis revealed that gene pathways associated with myelination, plasma membrane regulation, and fatty acid metabolism were among those upregulated upon treatment with CNM-Au8, as well as, in part, with T3.

References

    1. Bercury KK, Macklin WB. Dynamics and mechanisms of CNS myelination. Dev. Cell. 2015;32:447–58. doi: 10.1016/j.devcel.2015.01.016. - DOI - PMC - PubMed
    1. Pfeiffer SE, Warrington AE, Bansal R. The oligodendrocyte and its many cellular processes. Trends Cell Biol. 1993;3:191–7. doi: 10.1016/0962-8924(93)90213-K. - DOI - PubMed
    1. Figlia G, Gerber D, Suter U. Myelination and mTOR. Glia. 2018;66:693–707. doi: 10.1002/glia.23273. - DOI - PMC - PubMed
    1. Philips T, Rothstein JD. Oligodendroglia: metabolic supporters of neurons. J. Clin. Invest. 2017;127:3271–3280. doi: 10.1172/JCI90610. - DOI - PMC - PubMed
    1. Mathur D, et al. Bioenergetic Failure in Rat Oligodendrocyte Progenitor Cells Treated with Cerebrospinal Fluid Derived from Multiple Sclerosis Patients. Front. Cell Neurosci. 2017;11:209. doi: 10.3389/fncel.2017.00209. - DOI - PMC - PubMed

Publication types

MeSH terms