. 2020 Feb 10;10(1):2302.
doi: 10.1038/s41598-020-58913-8.

Soil properties explain tree growth and mortality, but not biomass, across phosphorus-depleted tropical forests

Affiliations

Soil properties explain tree growth and mortality, but not biomass, across phosphorus-depleted tropical forests

Jennifer L Soong et al. Sci Rep. .

Abstract

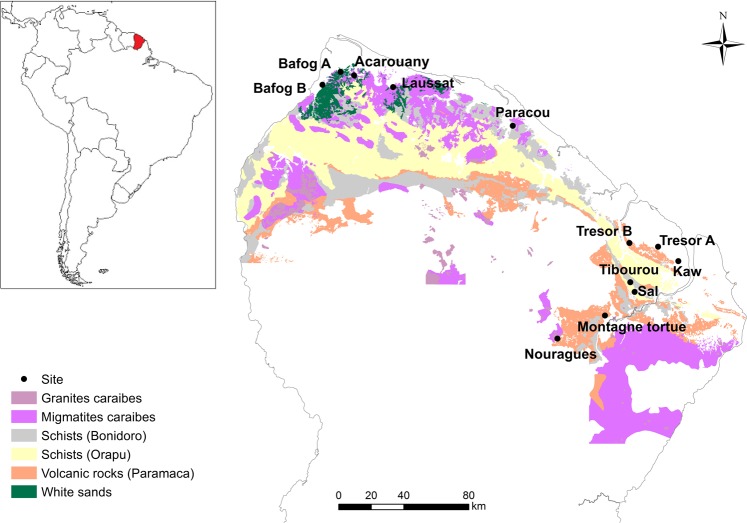
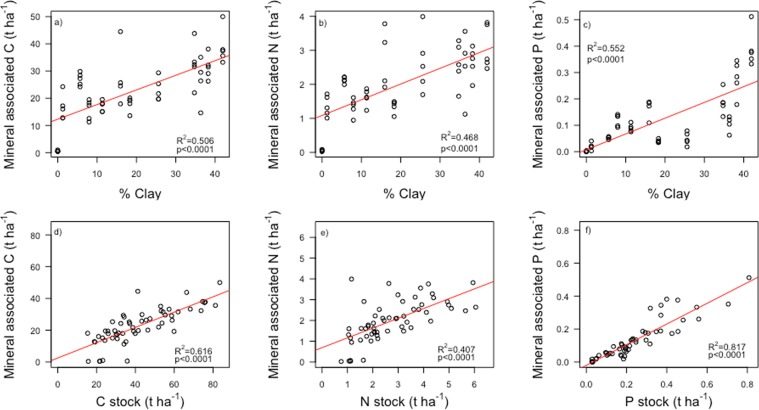
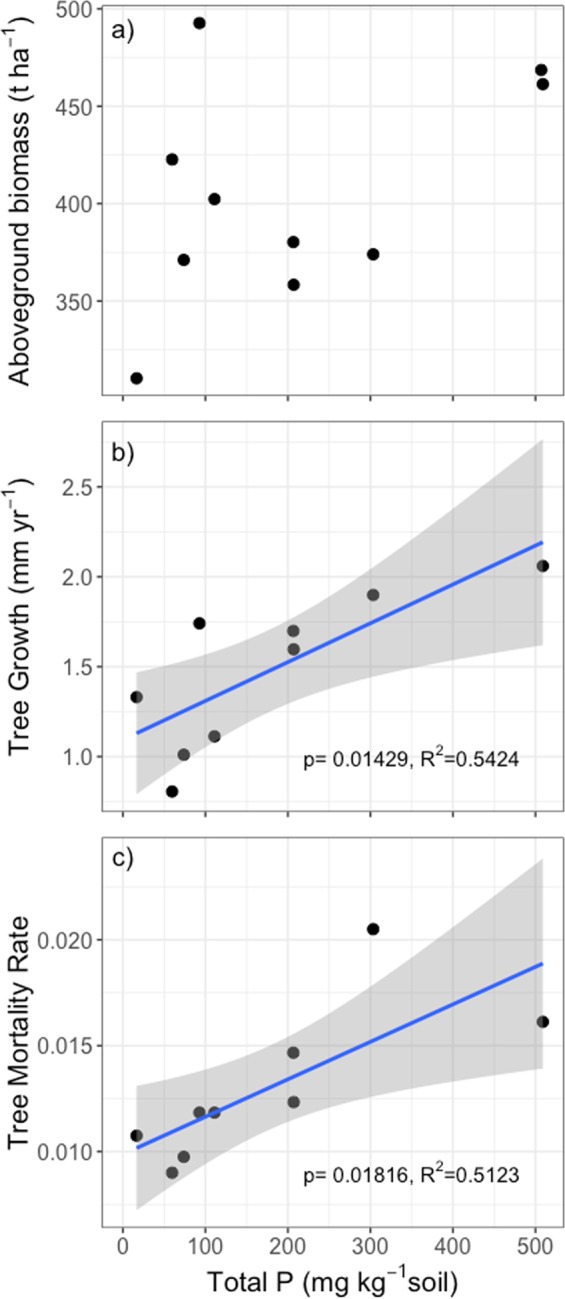
We observed strong positive relationships between soil properties and forest dynamics of growth and mortality across twelve primary lowland tropical forests in a phosphorus-poor region of the Guiana Shield. Average tree growth (diameter at breast height) increased from 0.81 to 2.1 mm yr-1 along a soil texture gradient from 0 to 67% clay, and increasing metal-oxide content. Soil organic carbon stocks in the top 30 cm ranged from 30 to 118 tons C ha-1, phosphorus content ranged from 7 to 600 mg kg-1 soil, and the relative abundance of arbuscular mycorrhizal fungi ranged from 0 to 50%, all positively correlating with soil clay, and iron and aluminum oxide and hydroxide content. In contrast, already low extractable phosphorus (Bray P) content decreased from 4.4 to <0.02 mg kg-1 in soil with increasing clay content. A greater prevalence of arbuscular mycorrhizal fungi in more clayey forests that had higher tree growth and mortality, but not biomass, indicates that despite the greater investment in nutrient uptake required, soils with higher clay content may actually serve to sustain high tree growth in tropical forests by avoiding phosphorus losses from the ecosystem. Our study demonstrates how variation in soil properties that retain carbon and nutrients can help to explain variation in tropical forest growth and mortality, but not biomass, by requiring niche specialization and contributing to biogeochemical diversification across this region.


Conflict of interest statement

The authors declare no competing interests.

Figures

Figure 1
Figure 1
Location of French Guiana in South America (insert) and location of study sites within French Guiana. Geological substrates underlying the region are indicated by color. The Paramaca series is constituted by sedimentary rocks, metamorphic rocks and volcanic rocks of different composition (e.g. andesites, basalts, dacites). White sands are low consolidated sandstones made of quartz. Map created using ArcGIS Version 10.3 https://desktop.arcgis.com/en/.
Figure 2
Figure 2
Mean soil organic carbon stocks (0–30 cm) relationship with (a) soil clay sized particle content, and (b) aboveground (Abgd) carbon stocks in woody biomass. Site TRB is missing from (b) because we lacked aboveground biomass measurements. Error bars are standard error.
Figure 3
Figure 3
Mineral associated carbon (C) Nitrogen (N), phosphorus (P), and isolated by density and size fractionation and their association with, (ac) clay (<2 µm) content of the soil, and (df) total elemental stocks in the top 15 cm of the soil. Stocks were calculated by multiplying elemental concentrations by bulk density.
Figure 4
Figure 4
(a) Bray-extractable P, (b) total P, and (c) the ratio of Bray-extractable/total P versus soil % clay sized particle content for all soil samples. Symbols represent depths (A = 0–15 cm, B = 15–30 cm).
Figure 5
Figure 5
Relative abundance of (a) arbuscular mycorrhizal (AM), and (b) ectomycorrhizal (ECM) fungi, as measured with ITS DNA sequencing, and soil total P concentrations. Symbols represent depths (A = 0–15 cm, B = 15–30 cm).
Figure 6
Figure 6
(a) Aboveground biomass (t ha−1), (b) tree growth rate (mm yr−1) for trees >10 cm diameter, and (c) tree mortality rates for trees >10 cm diameter from nine 1 ha forest plots across French Guiana plotted against soil total phosphorus concentrations in the top 0–15 cm of the soil. Blue lines are linear model fits and grey areas are 95% confidence intervals. In (a) there is no significant fit (p = 0.1676) so no fit is shown. One extra site is included in (a) because one year of aboveground biomass data was available, however multi-year dynamic growth and mortality rates were not available.
Figure 7
Figure 7
A simplified conceptual figure of the influence of soil properties on tree growth and mortality, but not biomass, across phosphorus-depleted tropical forests. Both forests have the same aboveground biomass, but different turnover rates and soil properties. At the sandy end of the soil continuum are forests with slower (narrower) nutrient cycling due to greater nutrient retention in the aboveground biomass (dark blue) based on slower growth, greater longevity, lower quality litter. At the other end of the spectrum are forests where the greater capacity of clay and (hydr)oxide-rich soils to retain phosphorus and organic matter support faster (wider) nutrient cycling forests. At clayey sites, nutrient recycling via decomposition (dark blue) is supported by a greater relative abundance of arbuscular mycorrhizal (AM) fungi.

References

    1. Pan Y, et al. A Large and Persistent Carbon Sink in the World’s Forests. Science. 2011;333:988–993. doi: 10.1126/science.1201609. - DOI - PubMed
    1. Brienen RJW, et al. Long-term decline of the Amazon carbon sink. Nature. 2015;519:344–348. doi: 10.1038/nature14283. - DOI - PubMed
    1. Quesada CA, et al. Soils of Amazonia with particular reference to the RAINFOR sites. Biogeosciences. 2011;8:1415–1440. doi: 10.5194/bg-8-1415-2011. - DOI
    1. Gill A, Finzi AC. Belowground carbon flux links biogeochemical cycles and resource-use efficiency at the global scale. Ecology Letters. 2016;19:1419–1428. doi: 10.1111/ele.12690. - DOI - PubMed
    1. Walker T, Syers J. The fate of phosphorus during pedogenesis. Geoderma. 1976;15:1–19. doi: 10.1016/0016-7061(76)90066-5. - DOI

Publication types