. 2020 Feb 10;10(1):2287.
doi: 10.1038/s41598-020-58871-1.

Nandrolone induces a stem cell-like phenotype in human hepatocarcinoma-derived cell line inhibiting mitochondrial respiratory activity

Affiliations

Nandrolone induces a stem cell-like phenotype in human hepatocarcinoma-derived cell line inhibiting mitochondrial respiratory activity

Francesca Agriesti et al. Sci Rep. .

Abstract

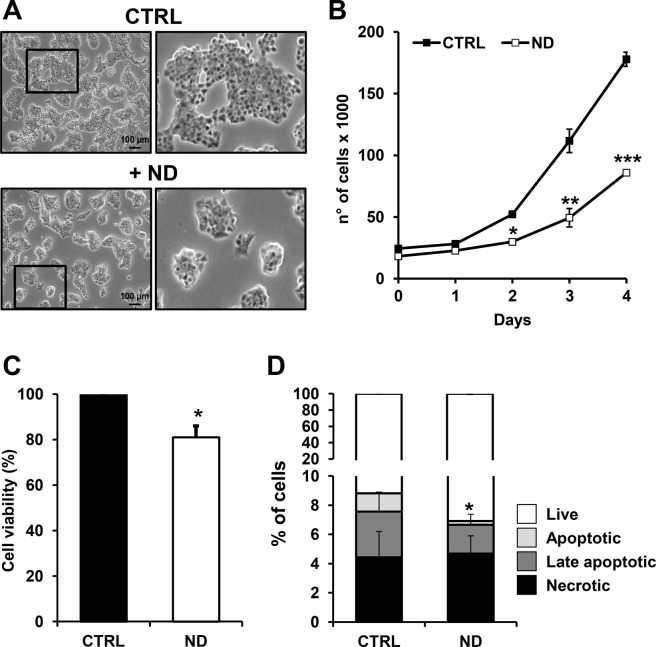
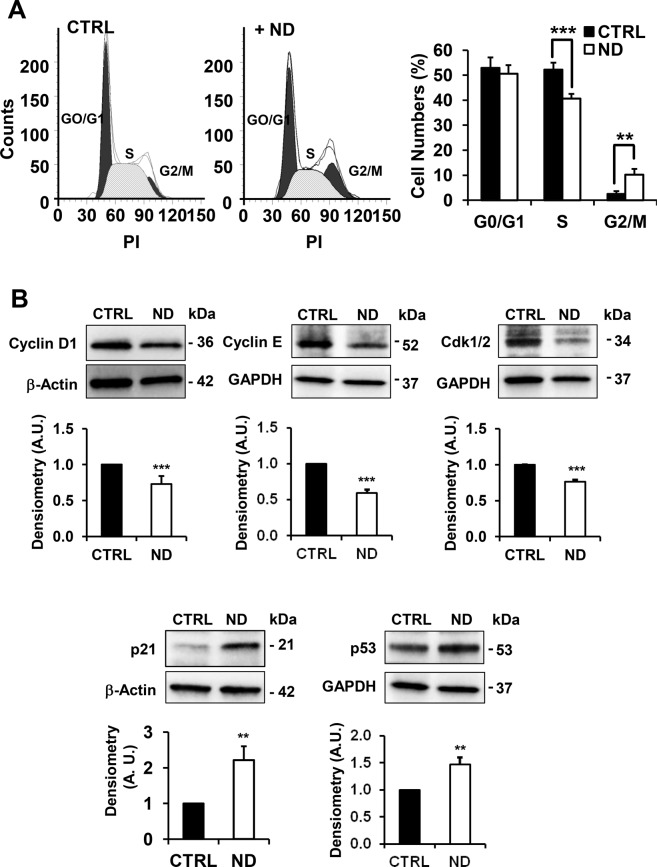
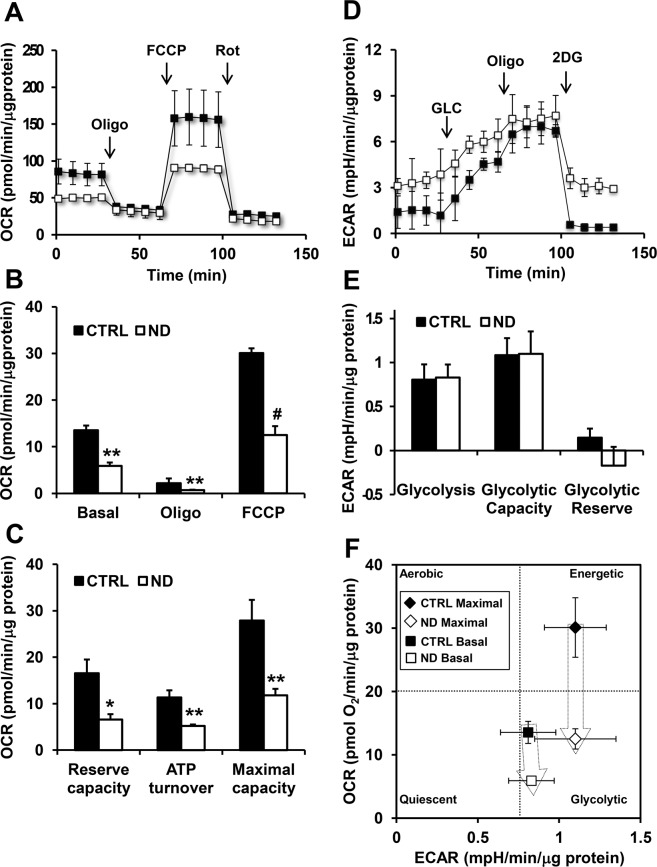
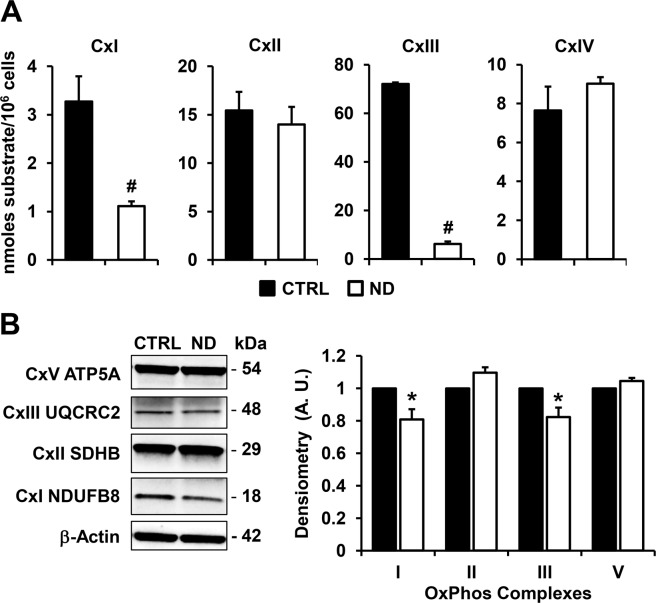
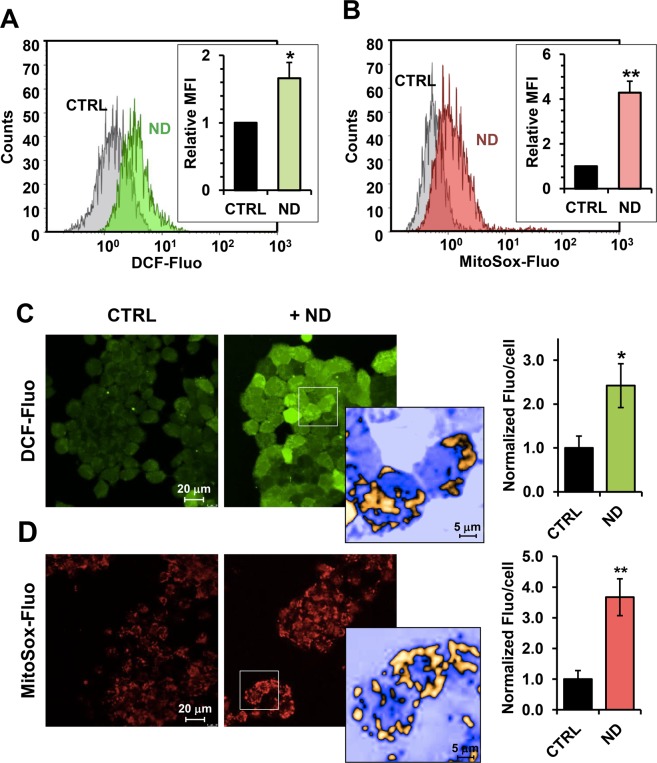
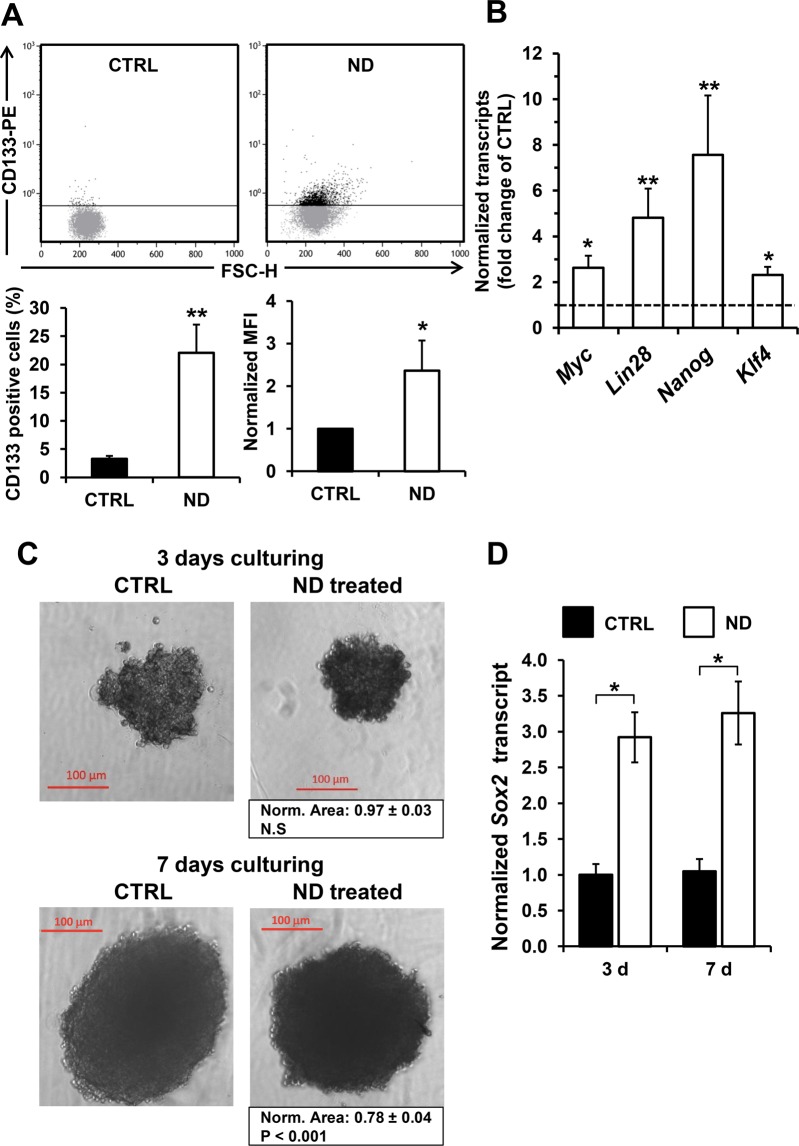
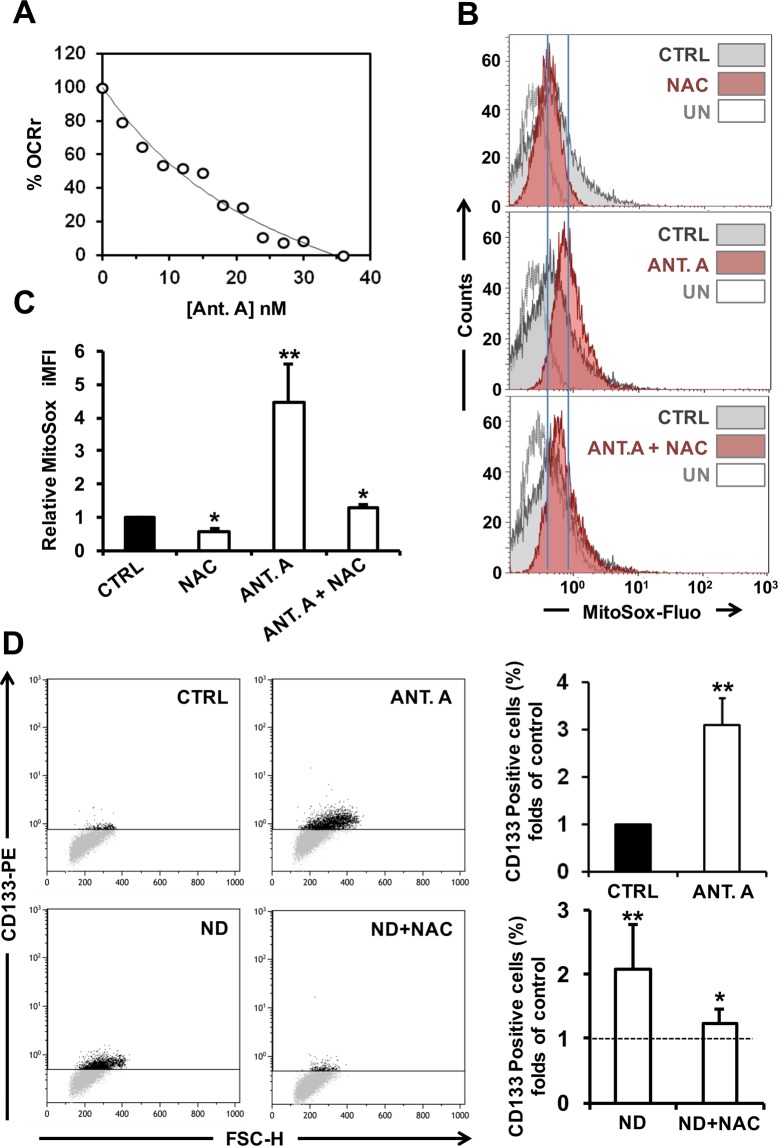
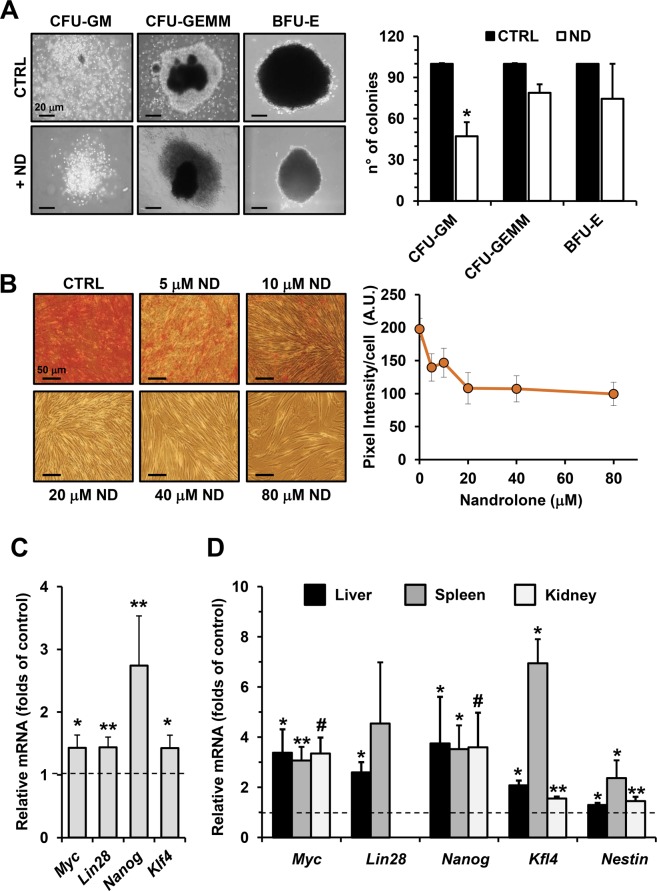
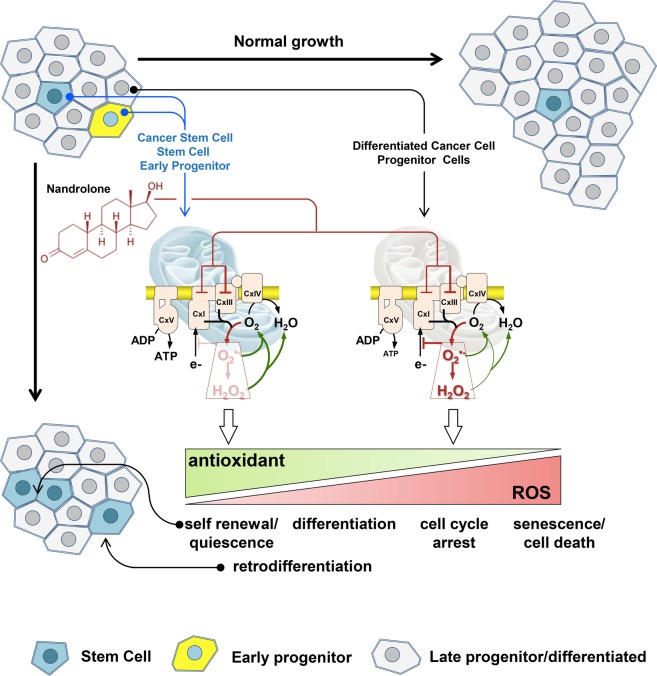
Nandrolone is a testosterone analogue with anabolic properties commonly abused worldwide, recently utilized also as therapeutic agent in chronic diseases, cancer included. Here we investigated the impact of nandrolone on the metabolic phenotype in HepG2 cell line. The results attained show that pharmacological dosage of nandrolone, slowing cell growth, repressed mitochondrial respiration, inhibited the respiratory chain complexes I and III and enhanced mitochondrial reactive oxygen species (ROS) production. Intriguingly, nandrolone caused a significant increase of stemness-markers in both 2D and 3D cultures, which resulted to be CxIII-ROS dependent. Notably, nandrolone negatively affected differentiation both in healthy hematopoietic and mesenchymal stem cells. Finally, nandrolone administration in mice confirmed the up-regulation of stemness-markers in liver, spleen and kidney. Our observations show, for the first time, that chronic administration of nandrolone, favoring maintenance of stem cells in different tissues would represent a precondition that, in addition to multiple hits, might enhance risk of carcinogenesis raising warnings about its abuse and therapeutic utilization.


Conflict of interest statement

The authors declare no competing interests.

Figures

Figure 1
Figure 1
Effect of nandrolone on cell viability. (A) Phase-contrast images of cultured HepG2 cells in ± 80 μM nandrolone for 72 h. Scale bars, 100 μm. The shown optical micro-photographs on the left are representative of several independent biological replicates yielding similar results; digital magnifications of selected areas are also shown on the right panel. (B) Cell growth curves of HepG2 seeded at the same density in presence or absence of nandrolone and counted every 24 h at the indicated times; the values shown are means of three independent ± SEM time-courses for each condition (where not visible the error bar is within the size of the symbol); *P < 0.05, **P < 0.01, ***P < 0.005 vs relative CTRLs. (C) Effect of nandrolone on cell viability assessed by MTS assay, as described in Materials and Methods. Cell viability is expressed as the percentage (%) of untreated cells. The data shown are means ± SEM of at least three independent experiments; *P < 0.05. (D) Apoptosis measurement of untreated and ND-treated cells. HepG2 cells were incubated with annexin V and propidium iodine (PI) and the internal-sample percentage of early apoptotic, late apoptotic and necrotic cells assessed by flow cytometry as detailed in Materials and Methods. The superimposed bar graph shows the average values ± SEM of three independent experiments; *P < 0.05. CTRL: ethanol-treated Control cells, ND: nandrolone-treated cells.
Figure 2
Figure 2
Effect of nandrolone on cell cycle. (A) Cell cycle analysis of HepG2 nandrolone treated cells (ND) using ModFit software (Verity Software House). Histogram plots were shown on the right. Data, expressed as percentage of total events analyzed, are the means ± SD of three independent experiments; **P < 0.01; ***P < 0.005. PI: propidium iodide. (B) Protein expression levels of key regulators of cell cycle progression, Cyclin D1, Cyclin E, Cdk1/2, p21 and p53, assayed by Western blotting in untreated and 80 μM nandrolone-treated cells for 72 h. Upper panel: a representative cropped immunoblot. Full-length blots are presented in Supplementary Fig. S1. Bottom bar histogram: densitometry analysis normalized to β-actin as means ± SEM of three independent experiment; **P < 0.01; ***P < 0.001. A.U.: arbitrary unit.
Figure 3
Figure 3
Metabolic flux analysis of Nandrolone-treated HepG2 cells. Representative oxygen consumption rates (OCR) (A) and extra cellular acidification rates (ECAR) (D) profile of HepG2 cells treated with vehicle (CTRL) or 80 μM nandrolone (ND), assayed by the Seahorse XFe96 Analyzer as described under Materials and Methods. Oligomycin (Oligo), FCCP, and Rotenone (Rot) were added at the indicated points in A. Glucose (GLC), Oligo and 2-deoxyglucose (2DG) were added at the indicated points in D. The histograms in B,E, show OCR and ECAR normalized to the protein content of the cells removed from each well at the end of the assay. OCR in B Basal, resting OCR; Oligo, OCR measured after the addition of the ATP synthase inhibitor oligomycin also referred as proton leak; FCCP, OCR measured after the addition of the uncoupler FCCP eliciting the maximal respiratory capacity. The OCR were corrected for the residual OCR measured after the addition of the CxI inhibitor rotenone (not shown). ECAR in E Glycolysis, resting ECAR, measured after the addition of glucose and corrected for the 2DG-insensitive ECAR; Glycolytic Capacity, ECAR measured after the addition of oligomycin and refers to the maximal glycolytic activity with the OxPhos inhibited; Glycolytic Reserve, difference between ECAR measured in the presence of oligomycin and under resting conditions. (C) The histograms show Reserve Capacity, ATP turnover and maximal capacity computed as described in Materials and Methods. (F) Energy map obtained plotting the basal and maximal OCR and basal and maximal ECAR measured in A,D The values are means ± SEM of three independent experiment carried out in 3 technical replicates under each condition; *P < 0.05; **P < 0.01; #P < 0.001.
Figure 4
Figure 4
Effect of nandrolone on the mitochondrial respiratory chain complexes. (A) Activity of mitochondrial respiratory chain complexes. Cells were lysed and assayed by spectrophotometric assays under condition of saturating substrates as detailed in Materials and Methods. CxI, NADH dehydrogenase; CxII, Succinate dehydrogenase; CxIII, Coenzyme Q-cytochrome c oxidoreductase; CxIV Cytochrome c oxidase. The results are expressed as nmoles of substrate transformed/min/106 cells and the bars indicate the means ± SEM of 4 independent biological replicates for each conditions; #P < 0.001. (B) Expression of the OxPhos complexes. Left panel: representative cropped immunoblot of the OxPhos complexes protein expression in untreated (CTRL) and Nandrolone-stimulated (ND) cells using a cocktail of specific antibodies as detailed in Materials and Methods, full-length blots are presented in Supplementary Fig. S3; β-actin was used as loading control. Graph bars on the right show the average (±SEM) of data resulting from densitometric analysis of three independent blots; *P < 0.01.
Figure 5
Figure 5
Nandrolone treatment results in unbalance of the cellular redox state of HepG2 cells. Nandrolone elevates ROS production in HepG2 cells. (A,B) Flow-cytometric analysis of ROS production assayed by the fluorescent peroxide probe DCF-DA (A) and the mitochondrial superoxide anion probe MitoSox (B) in untreated (grey areas) and Nandrolone-stimulated (colored areas) cells. Panel on the left: representative flow-cytometric histogram plots. The bar graph in the insets shows the mean intensity of the DCF-DA and MitoSox-related fluorescence (MFI) expressed as fold-change of the untreated cells and are means ± SEM of three independent experiments. *P < 0.05; **P < 0.01. (C,D) Representative LSCM imaging of ROS production in living HepG2 cells treated with nandrolone and assessed by DCF-DA (C) and MitoSox (D) probes respectively. An enlarged detail of the optical field (square) and rendering of nandrolone-treated cells is shown on the right of each panel (and rendered in false colors). The images are representative of three different preparations yielding similar results. The histograms on the right of panels C and D show quantification of the fluorescence/cell elaborated by the freeware software ImageJ (https://imagej.nih.gov/ij/); the values are means ± SEM of at least ten different optical fields, each containing 30–50 cells, from 3 independent experiments; *P < 0.05; **P < 0.01.
Figure 6
Figure 6
Nandrolone causes a shift toward an immature state (stem cell-like phenotype) in hepatoma cells. (A) Flow- cytometric analysis of cancer stem cell surface marker CD133 after 80 μM nandrolone treatment. Representative dot-plots of untreated (CTRL) and nandrolone-treated (ND) cells; Graph bars on the bottom show the average (±SEM) of data resulting from quantification of percentage of CD133 positive cells and from normalized mean fluorescence intensity (MFI) of six independent biological experiments; *P < 0.05; **P < 0.01. FSC-H: forward scatter height. (B) Expression of stemness transcription factors resulted up-regulated after nandrolone treatment. Quantitative real‐time‐polymerase chain reaction analysis of transcripts for Myc, Lin28, Nanog, and Kfl4 in HepG2 treated cells is shown as histograms. The values are means ± standard error of the mean (SEM) of normalized transcript levels of six independent biological experiments, *P < 0.05; **P < 0.01; #P < 0.001 versus untreated. (C) Effect of nandrolone on HepG2-derived spheroid. Cells were grown for 3 and 7 days under condition of 3D culturing (see Materials and Methods) without (CTRL) and with 80 μM nandrolone (ND treated). The micrographs are representative of two independent experiments; below the “ND treated” panels the averaged spheroid area normalized to the respective CTRL is indicated. (D) qRT-PCR analysis of the Sox2 transcript level in untreated and nandrolone-treated HepG2-derived spheroids, normalized to CTRL sample at the lower timepoint (i.e. 3 days). Experimental conditions as in panel C. Bars are averaged normalized values ± SEM of three independent preparations; *P < 0.05.
Figure 7
Figure 7
Antimycin A treatment elevates ROS production and induces an increase of CD133 positive HepG2 cells. (A) Dose-dependence effect of antimycin A (Ant. A) on cell endogenous respiratory activities. HepG2 cells were exposed to the indicated concentrations of Ant. A and the relative oxygen consumption rate (OCR) was determined. OCR is expressed as the percentage (%) of untreated cells. (B) Superoxide anion production was evaluated through flow-cytometry assessment of MitoSox Red fluorescence. HepG2 cells incubated with 10 nM Ant. A for 48 hours presented elevated levels of superoxide production (middle panel), reduced by treatment with 10 mM of the ROS scavenger NAC added 4 h before the analysis (upper and lower panel); unstained controls (UN) are also shown. The bar histogram (C) shows the mean intensity of the MitoSox-related integrated fluorescence (iMFI) expressed as fold-change of the untreated cells and are means ± SEM of three independent experiments. *P < 0.05; **P < 0.01. (D) Representative dot-plots of flow cytometric analysis of cancer stem cell surface marker CD133 expression. Cells were incubated for 48 h with 10 nM Ant. A and 80 μM Nandrolone ± 10 mM of the ROS scavenger NAC added 6 h before the analysis. The bar histogram on the right shows the percentage of CD133 positive cells expressed as fold-change of the untreated cells (indicated by dashed line) and are means ± SEM of three independent experiments. *P < 0.05; **P < 0.01 vs untreated.
Figure 8
Figure 8
Nandrolone triggers the gain of stemness in several primary non-cancerous cells model. (A) Effect of nandrolone on colony formation ability of CD34+ HS/PC in vitro. Left panel: representative images of CFU-GEMM, CFU-GM and BFU-E scored under an inverted microscope (magnification 40X) are shown. Right panel: quantitative analysis of CFU-GEMM, CFU-GM and BFU-E derived by CD34+ cells isolated form human umbelical cord blood with or without 80 μM nandrolone. ND was added to methylcellulose based medium at time of plating and colonies were detected and enumerated after 14 days of culture as described in Material and Methods. Results shown represent the mean of ± SD of two independent experiment, *P < 0.05 vs CTRL. (B) Effect of nandrolone on calcific deposition during osteogenic differentiation of dental pulp mesenchymal stem cell (DPSCs). Mineral matrix deposition was assayed by Alizarin Red (red staining) in DPSCs incubated with vehicle (CTRL) cells and cells treated with several doses of nandrolone after 21 days in osteogenic conditions. The graph on the right shows quantitative analysis of alizarin red staining carried out by a densitometric analysis (Image J software). (C) Nandrolone treatment induces stemness genes expression during osteogenic differentiation of dental pulp stem cell. Quantitative reverse transcriptase PCR analysis for Myc, Lin28, Nanog, Kfl4 in DPSCs incubated for 21 days in osteogenic medium with 80 μM nandrolone. Data are the mean ± SEM of normalized transcript levels of five independent experiment from 5 independent donors. Per each gene evaluated, fold change value of transcript level in nandrolone treated cells compared to untreated cells (indicated by dashed line) is shown, *P < 0.05; **P < 0.01. (D) Nandrolone elevates stem cells genes expression in vivo. Real time-PCR evaluation of stemness gene expression after nandrolone administration in mice model as describe in Material Methods. For each gene, relative expression levels of transcripts of nandrolone treated mice compared to animals treated with vehicle (dashed line) are shown. The graphs show normalization with the reference gene of Myc, Lin28, Nanog, Kfl4, Nestin expression in several tissues, as spleen, kidney and liver. Data are the mean ± SEM of normalized transcript levels of 3 independent biological experiment. *P < 0.05; **P < 0.01; #P < 0.001.
Figure 9
Figure 9
Proposed mechanism of the differential action of nandrolone on normal/cancer stem and differentiated cells. The hypothesis is put forward that by inhibiting the mitochondrial respiratory chain CxIII, nandrolone induces a pro-oxidative setting (red arrowed lines) that depending on the cellular antioxidant supply (green arrowed lines) establishes a differential redox signalling. A low increase of reactive oxidant species would favour self-renewal/quiescence of normal or cancer stem cells and possibly retro-differentiation of early progenitors, all equipped with a robust antioxidant armoury. Conversely, a higher pro-oxidative state, such that caused by nandrolone in late progenitor or differentiated cells will induce cell cycle arrest and possibly cell death. See Discussion for further details.

Similar articles

Cited by

References

    1. Basaria S, Wahlstrom JT, Dobs AS. Clinical review 138: Anabolic-androgenic steroid therapy in the treatment of chronic diseases. J. Clin. Endocrinol. Metab. 2001;86:5108–5117. doi: 10.1210/jcem.86.11.7983. - DOI - PubMed
    1. Pomara C, et al. Effects of Nandrolone Stimulation on Testosterone Biosynthesis in Leydig Cells. J. Cell. Physiol. 2016;231:1385–1391. doi: 10.1002/jcp.25272. - DOI - PMC - PubMed
    1. Li Z, et al. Conversion of abiraterone to D4A drives anti-tumour activity in prostate cancer. Nature. 2015;523:347–351. doi: 10.1038/nature14406. - DOI - PMC - PubMed
    1. Cops EJ, et al. Antiproliferative actions of the synthetic androgen, mibolerone, in breast cancer cells are mediated by both androgen and progesterone receptors. J. Steroid Biochem. Mol. Biol. 2008;110:236–243. doi: 10.1016/j.jsbmb.2007.10.014. - DOI - PubMed
    1. Wood RI. Reinforcing aspects of androgens. Physiol. Behav. 2004;83:279–289. doi: 10.1016/j.physbeh.2004.08.012. - DOI - PubMed

Publication types

MeSH terms