

The peripheral origin of tap-induced muscle contraction revealed by multi-electrode surface electromyography in human vastus medialis
- PMID: 32041996
- PMCID: PMC7010771
- DOI: 10.1038/s41598-020-59122-z
The peripheral origin of tap-induced muscle contraction revealed by multi-electrode surface electromyography in human vastus medialis
Abstract
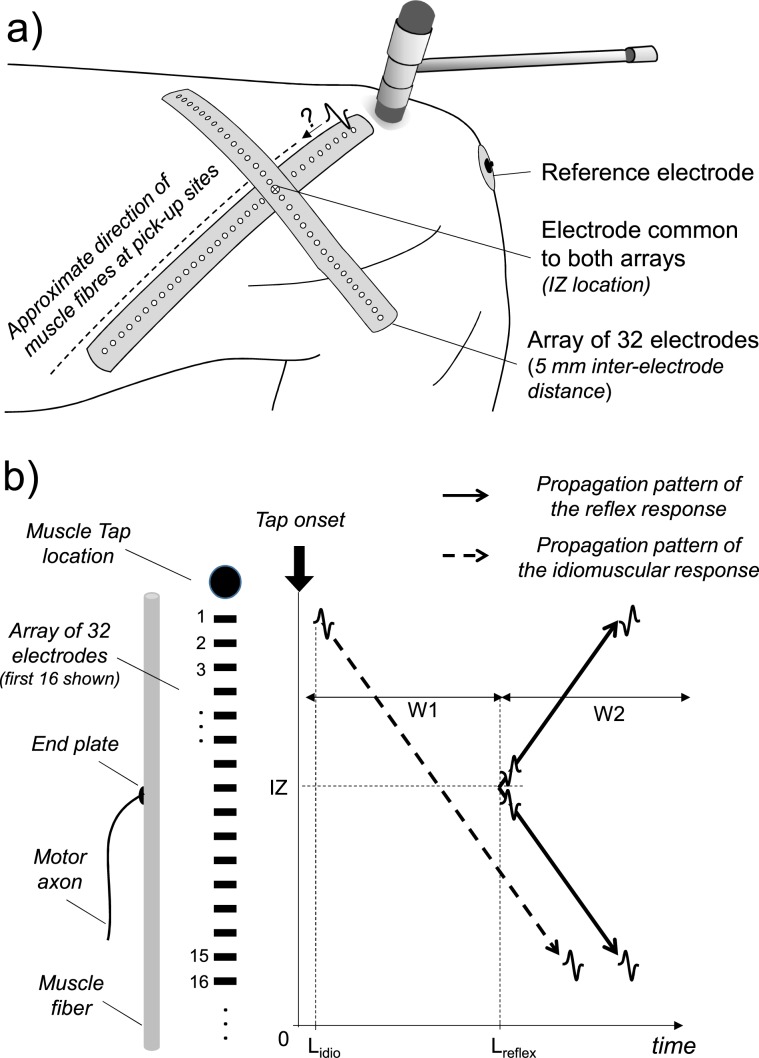
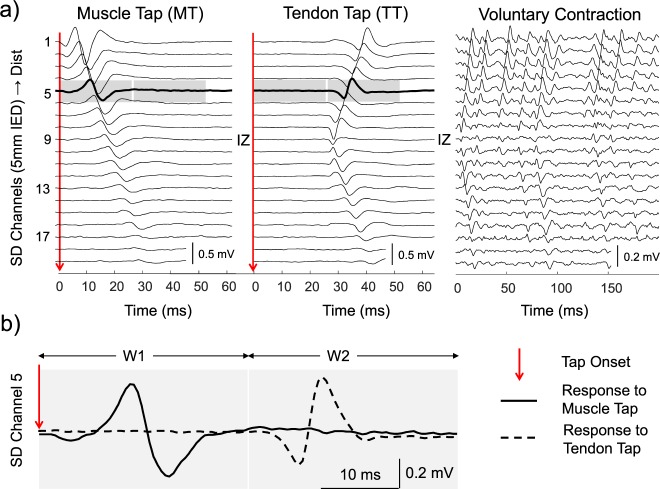
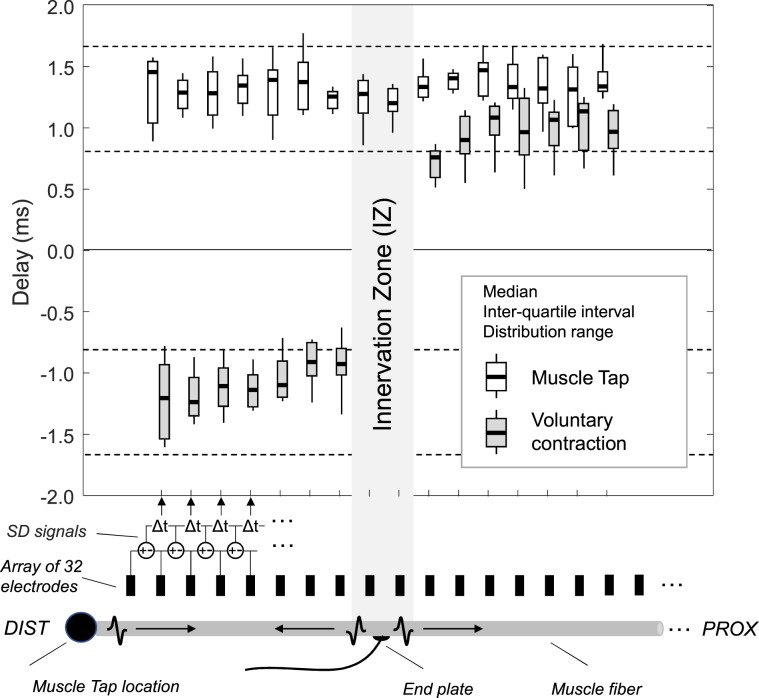
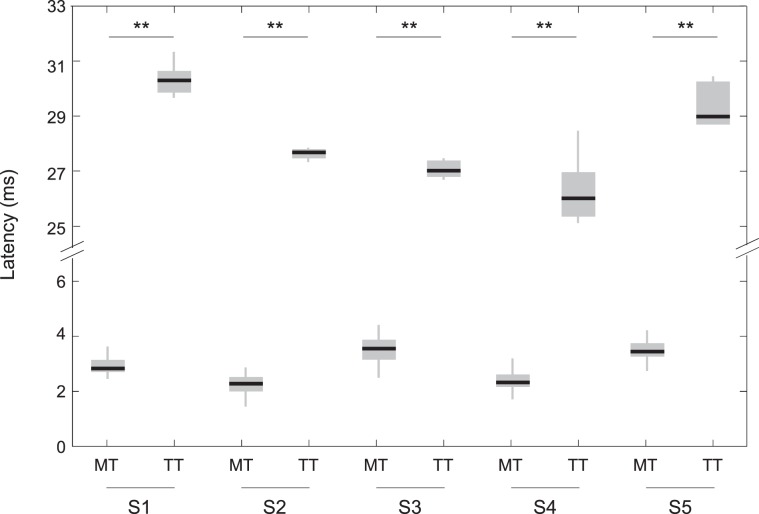
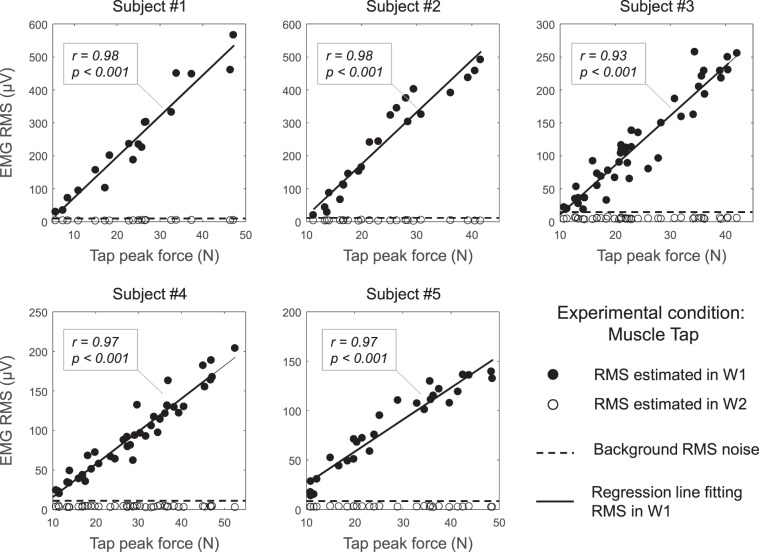
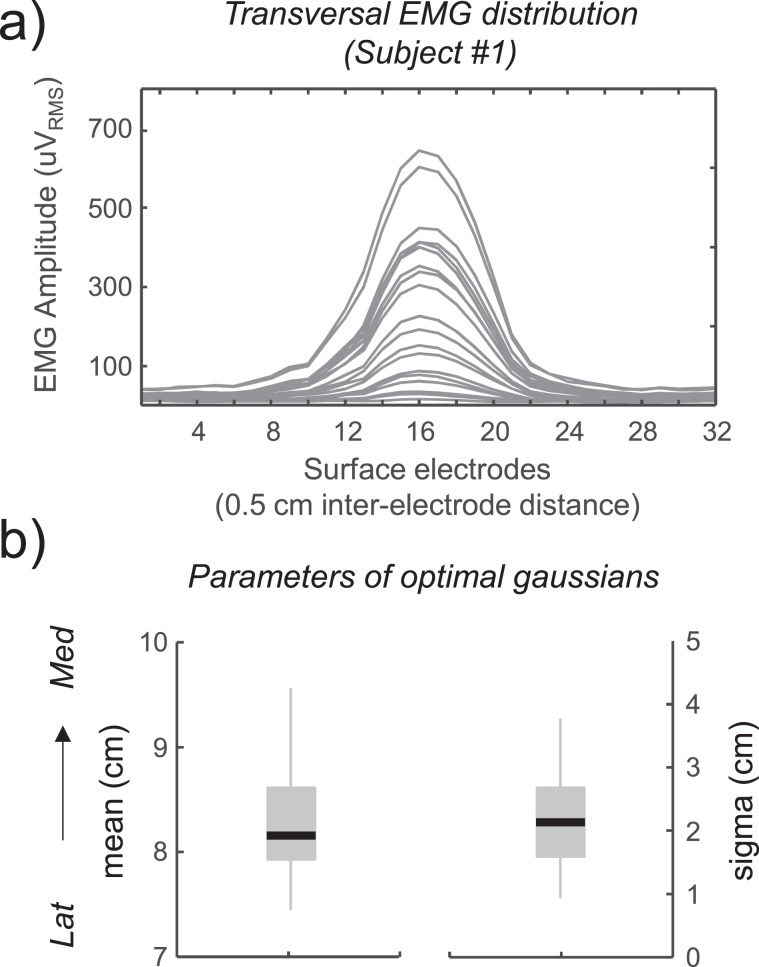
It is well established that muscle percussion may lead to the excitation of muscle fibres. It is still debated, however, whether the excitation arises directly at the percussion site or reflexively, at the end plates. Here we sampled surface electromyograms (EMGs) from multiple locations along human vastus medialis fibres to address this issue. In five healthy subjects, contractions were elicited by percussing the distal fibre endings at different intensities (5-50 N), and the patellar tendon. EMGs were detected with two 32-electrode arrays, positioned longitudinally and transversally to the percussed fibres, to detect the origin and the propagation of action potentials and their spatial distribution across vastus medialis. During muscle percussion, compound action potentials were first observed at the electrode closest to the tapping site with latency smaller than 5 ms, and spatial extension confined to the percussed strip. Conversely, during tendon tap (and voluntary contractions), action potentials were first detected by electrodes closest to end plates and at a greater latency (mean ± s.d., 28.2 ± 1.7 ms, p < 0.001). No evidence of reflex responses to muscle tap was observed. Multi-electrode surface EMGs allowed for the first time to unequivocally and quantitatively describe the non-reflex nature of the response evoked by a muscle tap.
Conflict of interest statement
The authors declare no competing interests.
Figures
Similar articles
-
Motor units in vastus lateralis and in different vastus medialis regions show different firing properties during low-level, isometric knee extension contraction.Hum Mov Sci. 2018 Apr;58:307-314. doi: 10.1016/j.humov.2017.12.012. Epub 2017 Dec 28. Hum Mov Sci. 2018. PMID: 29289349
-
Is the firing rate of motor units in different vastus medialis regions modulated similarly during isometric contractions?Muscle Nerve. 2018 Feb;57(2):279-286. doi: 10.1002/mus.25688. Epub 2017 May 29. Muscle Nerve. 2018. PMID: 28500671
-
Regional activation within the vastus medialis in stimulated and voluntary contractions.J Appl Physiol (1985). 2016 Aug 1;121(2):466-74. doi: 10.1152/japplphysiol.00050.2016. Epub 2016 Jun 30. J Appl Physiol (1985). 2016. PMID: 27365281 Free PMC article.
-
Regionalization of the stretch reflex in the human vastus medialis.J Physiol. 2017 Jul 15;595(14):4991-5001. doi: 10.1113/JP274458. Epub 2017 Jun 1. J Physiol. 2017. PMID: 28485493 Free PMC article.
-
Interpretation of EMG changes with fatigue: facts, pitfalls, and fallacies.J Electromyogr Kinesiol. 2003 Feb;13(1):13-36. doi: 10.1016/s1050-6411(02)00083-4. J Electromyogr Kinesiol. 2003. PMID: 12488084 Review.
Cited by
-
High Velocity Passive Stretching Mimics Eccentric Exercise in Cerebral Palsy and May Be Used to Increase Spastic Muscle Fascicle Length.Bioengineering (Basel). 2024 Jun 13;11(6):608. doi: 10.3390/bioengineering11060608. Bioengineering (Basel). 2024. PMID: 38927844 Free PMC article.
-
Physical and electrophysiological motor unit characteristics are revealed with simultaneous high-density electromyography and ultrafast ultrasound imaging.Sci Rep. 2022 May 25;12(1):8855. doi: 10.1038/s41598-022-12999-4. Sci Rep. 2022. PMID: 35614312 Free PMC article.
References
-
- Denny-Brown, D. & Pennybacker, J. Fibrillation and fasciculation in voluntary muscle Brain 61, 311–312 (1938).
