. 2020 Feb 10;10(1):2219.
doi: 10.1038/s41598-020-58939-y.

An optimized workflow for single-cell transcriptomics and repertoire profiling of purified lymphocytes from clinical samples

Affiliations

An optimized workflow for single-cell transcriptomics and repertoire profiling of purified lymphocytes from clinical samples

Richa Hanamsagar et al. Sci Rep. .

Erratum in

Abstract

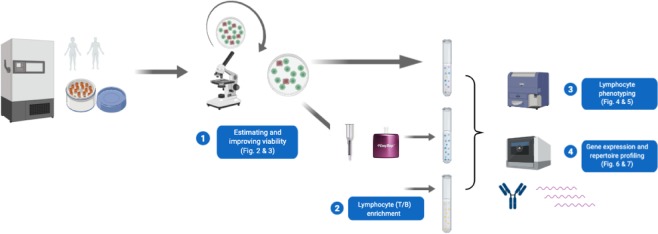
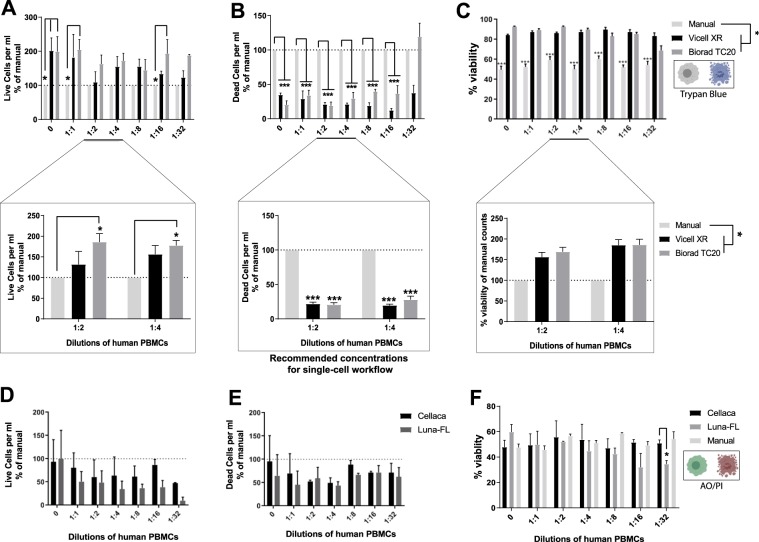
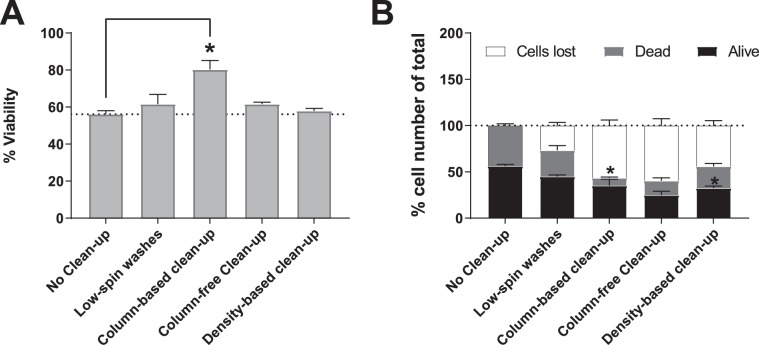
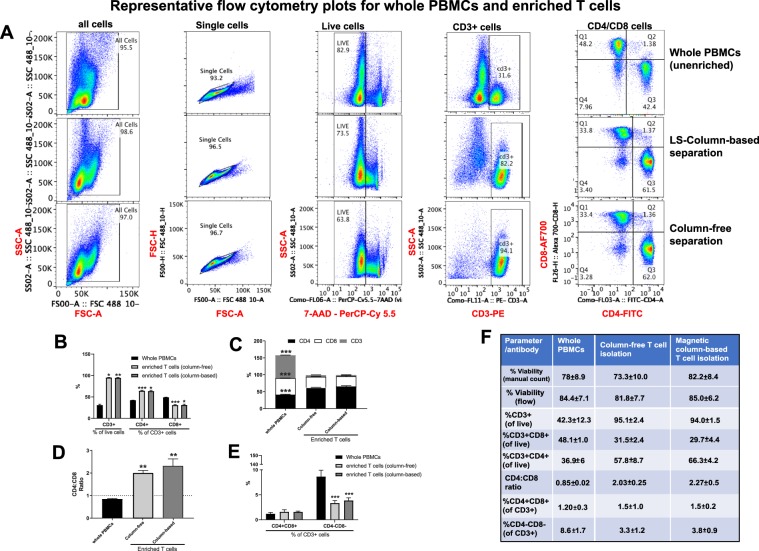
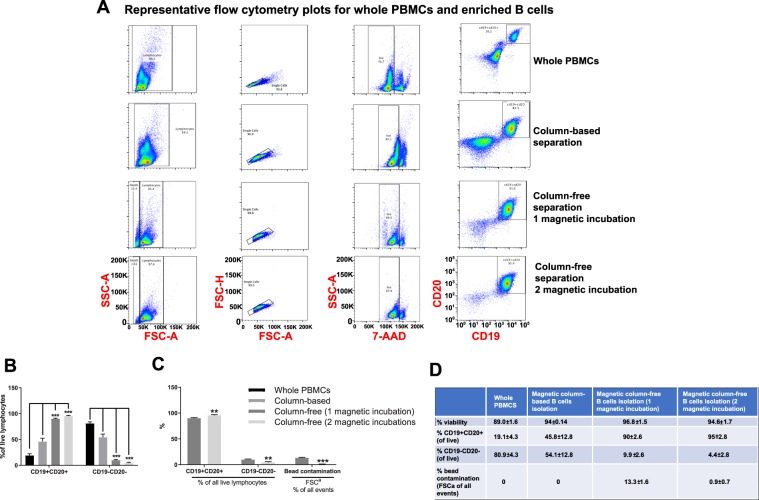
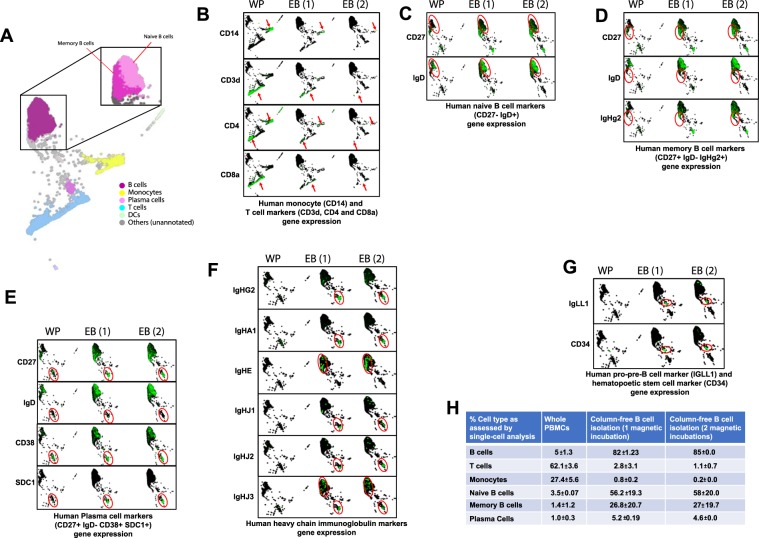
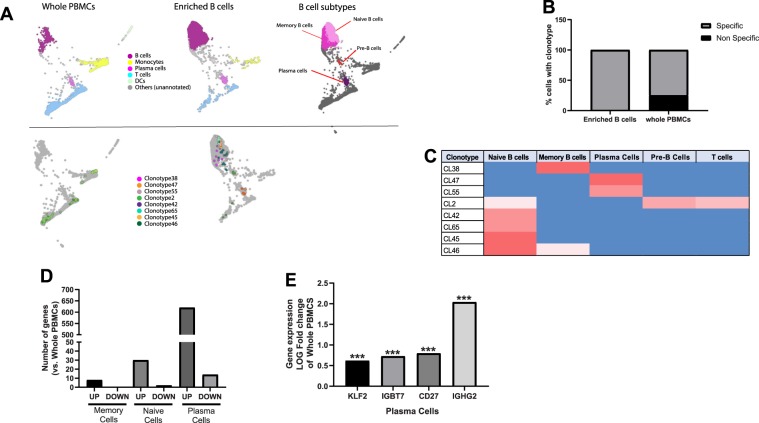
Establishing clinically relevant single-cell (SC) transcriptomic workflows from cryopreserved tissue is essential to move this emerging immune monitoring technology from the bench to the bedside. Improper sample preparation leads to detrimental cascades, resulting in loss of precious time, money and finally compromised data. There is an urgent need to establish protocols specifically designed to overcome the inevitable variations in sample quality resulting from uncontrollable factors in a clinical setting. Here, we explore sample preparation techniques relevant to a range of clinically relevant scenarios, where SC gene expression and repertoire analysis are applied to a cryopreserved sample derived from a small amount of blood, with unknown or partially known preservation history. We compare a total of ten cell-counting, viability-improvement, and lymphocyte-enrichment methods to highlight a number of unexpected findings. Trypan blue-based automated counters, typically recommended for single-cell sample quantitation, consistently overestimate viability. Advanced sample clean-up procedures significantly impact total cell yield, while only modestly increasing viability. Finally, while pre-enrichment of B cells from whole peripheral blood mononuclear cells (PBMCs) results in the most reliable BCR repertoire data, comparable T-cell enrichment strategies distort the ratio of CD4+ and CD8+ cells. Furthermore, we provide high-resolution analysis of gene expression and clonotype repertoire of different B cell subtypes. Together these observations provide both qualitative and quantitative sample preparation guidelines that increase the chances of obtaining high-quality single-cell transcriptomic and repertoire data from human PBMCs in a variety of clinical settings.


Conflict of interest statement

The authors declare no competing interests.

Figures

Figure 1
Figure 1
Optimizing single-cell sample preparation and workflow using previously frozen human PBMCs. First, we tested different methods for estimating and improving viability on freshly thawed human PBMCs. The results for these experiments are summarized in Figs. 2 and 3. Next, an aliquot of whole PBMCs was set aside. Another aliquot of PBMCs was subjected to different methods of T and B lymphocyte enrichment. Following this, the aliquot of whole PBMCs, as well as the enriched cells were stained with fluorescence antibodies and the yield and purity of enriched cells was assessed by flow cytometry. These results are summarized in Figs. 4 and 7. Finally, 10X Genomics single-cell 5′ gene expression and V(D)J repertoire profiling was performed in order to assess the differences in gene expression/repertoire data obtained from whole PBMCs vs. enriched lymphocytes, results for which are summarized in Figs. 5 and 6.
Figure 2
Figure 2
Cell viability estimation using automated TB-based counters or automated AO/PI-based counters. Human PBMCs were diluted using 0.04% BSA/PBS solution and each dilution was counted using manual hemacytometer, automated TB-based counters or automated AO/PI-based counters. (A-top) Live cells per ml, (B-top) Dead cells per ml, and (C-top) % viability for the TB-based automated methods and manual hemacytometer counts. Multiple technical replicates were performed for 1:2 and 1:4 dilutions and re-counted as above. (A-bottom) Live cells per ml, (B-bottom) Dead cells per ml, (C-bottom) % viability for the automated counters were reported as % of manual counts. Two-way ANOVA with matched samples across different dilutions, followed by Tukey’s Multiple Comparison test (n = 3–6). (D) Live cells per ml and (E) Dead cells per ml were reported at % of manual counts. (F) % viability calculated as live per ml/total per ml * 100. Matched sample, Two-way ANOVA followed by Tukey’s multiple comparison test (n = 4). For detailed statistics refer to Supplementary information.
Figure 3
Figure 3
Quantifying cell loss and viability of PBMC samples after applying viability improvement protocols. Human PBMCs were split into 5 equal parts and 4 aliquots were subjected to a different dead cell removal method each. One aliquot was kept aside as “no-cleanup control”. Cell counts were determined using manual hemacytometer before and after dead cell removal. (A) % viability pre and post-clean up (One-way ANOVA). (B) % cells lost, % dead cells and % live cells of total across different methods of clean-up. Two-way ANOVA with matched samples, followed by Tukey’s Multiple Comparison test (n = 10). (*p < 0.05). For detailed statistics refer to Supplementary information.
Figure 4
Figure 4
Comparing yield and purity of T cell enrichment methods. T cells were negatively enriched from frozen human PBMCs using either a column-based or column-free magnetic separation method. (A) Following enrichment, whole PBMCs and enriched cells were stained with antibodies for viability (7-AAD) and CD3, CD4 and CD8 surface markers. Samples were run through the BioRad ZE2 Cell analyzer. For every sample, gating was as follows: Lymphocyte gate > Singlet gate > Viability gate > CD3+ gate > CD4 and CD8. (B) Bar graph depicting % of CD3+ cells as a percent of all cells, CD4+ cells as a % of CD3+ cells and CD8+ cells as a % of CD3+ cells across all conditions. Two-way ANOVA, with Tukey’s Multiple Comparison Test. 5 p < 0.01 and ***p < 0.001. n = 3. (C) Bar graph depicting % of CD4+, CD8+ and CD3− cells in all cells across all conditions. Two-way ANOVA, with Tukey’s Multiple Comparison Test. ***p < 0.001. n = 3. (D) CD4:CD8 ratio across all conditions. One-way ANOVA, **p < 0.01, n = 3. (E) Comparison of % CD4+ CD8+ and % CD4−CD8− of CD3+ cells across all conditions. Two-way ANOVA, with Tukey’s Multiple Comparison Test. ***p < 0.001. n = 3. (F) Summary table depicting means and Standard Deviation for % viability, % CD3+ cells (of live cells) and % CD4+, CD8+, CD4+ CD8+ and CD4−CD8− of CD3+ cells for all samples pre- and post-enrichment.
Figure 5
Figure 5
Comparing yield and purity of B cell enrichment techniques. B cells were negatively enriched from frozen human PBMCs using either a column-based or column-free magnetic separation method. (A) Following enrichment, whole PBMCs and enriched cells were stained with antibodies for viability and CD19 and CD20 surface markers. Samples were run through the BioRad ZE2 Cell analyzer. For every sample, gating was as follows: Lymphocyte gate > Singlet gate > Viability gate > CD19, CD20 gate. (B) Bar graph depicting % of CD19+ CD20+ and CD19−CD20− cells of all cells across all conditions. (C) Bar graph depicting % CD19+ CD20+, CD19−CD20− cells and beads contamination of all cells in 1 magnetic incubation vs. 2 magnetic incubations using Column-free method. (D) Summary table depicting meands and standard deviations for % of B cells, non-B cells and beads as obtained from flow analysis across all conditions. Two-way ANOVA, with Tukey’s Multiple Comparison Test. **p < f 0.01 and ***p < 0.001. n = 3.
Figure 6
Figure 6
Assessing single-cell gene expression for whole PBMCs, enriched B cells (1 and 2 magnetic incubations). (A) 2D visualization of entire dataset; Inset: Memory and Naive B cells as depicted by automated cell annotation algorithm. (B) Visualization Plots for whole PBMCs, enriched B cells (1 magnetic incubation or 2 magnetic incubations), separated by condition show commonly used genes as markers for identification of monocytes and T cells: CD14, CD3D, CD4, CD8A. Arrows depict specific areas of depletion in enriched cells in 1 and 2 magnetic incubations. (C) Gene expression of CD27 and IgD to identify naïve B cells (CD27−IgD+) in red circle. (D) Gene expression of CD27, IgD and IgHg2 to identify memory B cells (CD27+ IgD−IgHg2+) in red circle. (E) Gene expression of CD27, IgD, CD38 and SDC1 to identify plasma cells (CD27+, IgD−, CD38+, SDC1+) in red circle. (F) Gene expression for heavy chain immunoglobulin markers. IgHg2 and IgHA1 are expressed in plasma cells and IgHE is expressed in memory cells of enriched B cells. IgHJ genes are detectable in enriched B cells, but not in whole PBMCs. (G) IgLL1 and CD34 gene expression as a marker for hematopoietic stem cells are visible in enriched B cells, and not in human PBMCs. (H) Summary table quantifying the mean and SD for % of different cell subtypes in single-cell dataset pre and post B cell enrichment (1 and 2 magnetic incubations) as analyzed by SPRING.
Figure 7
Figure 7
Single-cell BCR repertoire profiling of whole PBMCs, enriched B cells (1 or 2 magnetic incubations). Single-cell V(D)J repertoire profiling of whole PBMCs, enriched B cells (1 magnetic incubation or 2 magnetic incubations) on SPRING. For whole PBMCs, B cell V(D)J target enrichment was performed from the cDNA after which library was prepared. (A, top) Major cell subtypes highlighted on whole PBMCs and enriched B cells using an in-house cell-type annotation tool on SPRING. (A, bottom) BCR clonotypes distribution across whole PBMCs and enriched B cells. (B) Quantification of % of cells expressing BCRs specifically in B cells and non-specifically in non-B cells. (C) Summary of distribution of major BCR clonotypes across B cell subtypes in enriched B cell samples. (D) Number of genes with significantly different log Fold change in memory B cells, naïve B cells or plasma cells of enriched population compared with those of whole PBMCs. (E) Log fold gene expression change of select genes that are significantly upregulated in plasma cells of enriched cells compared with those of whole PBMCS. Wilcoxon Rank Sum Test, adjusted p-value is based on multiple test correction using the Bonferri method.

Similar articles

Cited by

References

    1. Zilionis R, et al. Single-Cell Transcriptomics of Human and Mouse Lung Cancers Reveals Conserved Myeloid Populations across Individuals and Species. Immunity. 2019;50:1317–1334 e1310. doi: 10.1016/j.immuni.2019.03.009. - DOI - PMC - PubMed
    1. Arazi A, et al. The immune cell landscape in kidneys of patients with lupus nephritis. Nat Immunol. 2019;20:902–914. doi: 10.1038/s41590-019-0398-x. - DOI - PMC - PubMed
    1. Vieira Braga FA, et al. A cellular census of human lungs identifies novel cell states in health and in asthma. Nat Med. 2019;25:1153–1163. doi: 10.1038/s41591-019-0468-5. - DOI - PubMed
    1. Hu Z, Ott PA, Wu CJ. Towards personalized, tumour-specific, therapeutic vaccines for cancer. Nat Rev Immunol. 2018;18:168–182. doi: 10.1038/nri.2017.131. - DOI - PMC - PubMed
    1. Jiang P, et al. Signatures of T cell dysfunction and exclusion predict cancer immunotherapy response. Nat Med. 2018;24:1550–1558. doi: 10.1038/s41591-018-0136-1. - DOI - PMC - PubMed