. 2020 Feb 10;11(1):807.
doi: 10.1038/s41467-020-14384-z.

Fasting-induced FGF21 signaling activates hepatic autophagy and lipid degradation via JMJD3 histone demethylase

Affiliations

Fasting-induced FGF21 signaling activates hepatic autophagy and lipid degradation via JMJD3 histone demethylase

Sangwon Byun et al. Nat Commun. .

Abstract

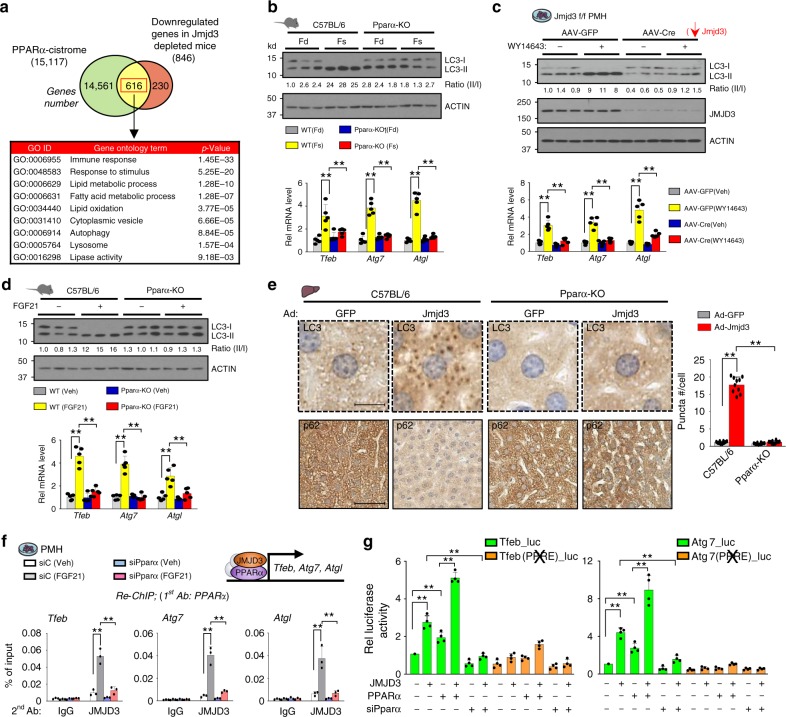
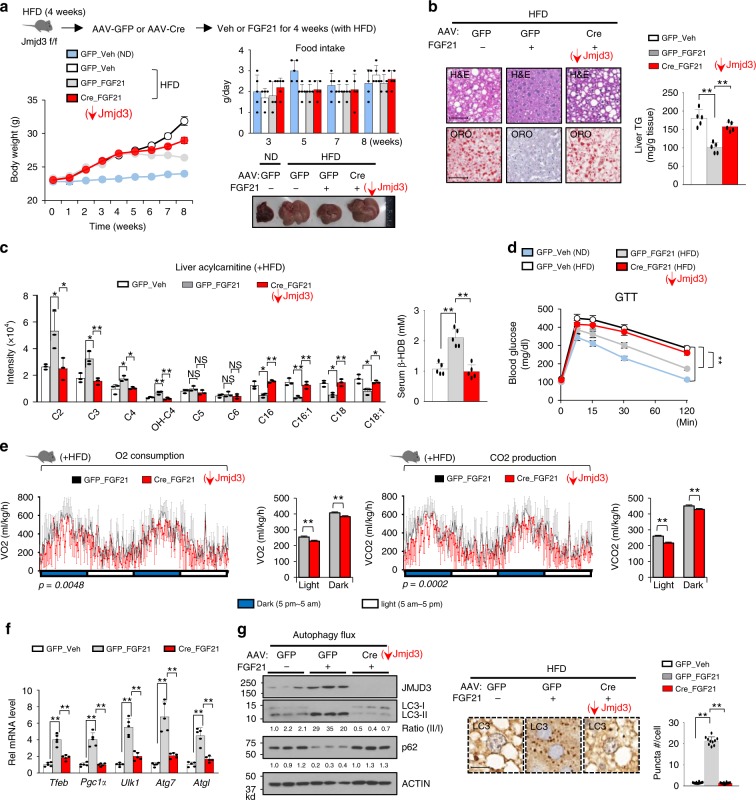
Autophagy is essential for cellular survival and energy homeostasis under nutrient deprivation. Despite the emerging importance of nuclear events in autophagy regulation, epigenetic control of autophagy gene transcription remains unclear. Here, we report fasting-induced Fibroblast Growth Factor-21 (FGF21) signaling activates hepatic autophagy and lipid degradation via Jumonji-D3 (JMJD3/KDM6B) histone demethylase. Upon FGF21 signaling, JMJD3 epigenetically upregulates global autophagy-network genes, including Tfeb, Atg7, Atgl, and Fgf21, through demethylation of histone H3K27-me3, resulting in autophagy-mediated lipid degradation. Mechanistically, phosphorylation of JMJD3 at Thr-1044 by FGF21 signal-activated PKA increases its nuclear localization and interaction with the nuclear receptor PPARα to transcriptionally activate autophagy. Administration of FGF21 in obese mice improves defective autophagy and hepatosteatosis in a JMJD3-dependent manner. Remarkably, in non-alcoholic fatty liver disease patients, hepatic expression of JMJD3, ATG7, LC3, and ULK1 is substantially decreased. These findings demonstrate that FGF21-JMJD3 signaling epigenetically links nutrient deprivation with hepatic autophagy and lipid degradation in mammals.


Conflict of interest statement

The authors declare no competing interests.

Figures

Fig. 1
Fig. 1. JMJD3 epigenetically activates hepatic autophagy-network genes.
JMJD3-floxed mice were infected with AAV-TBG-Cre or control AAV-GFP for 12 weeks, and then, fasted for 16 h. a Experimental outline (top) and the levels of JMJD3 detected by IB in the liver and intestine (bottom). b RNA-seq: heat maps of changes in mRNA levels of autophagy-related genes (n = 3 mice). c ChIP-seq: normalized H3K27-me3 peaks at hepatic genes involved in autophagic pathways (UCSC genome browser). d Venn diagram (top) of downregulated genes and genes with increased H3K27-me3 levels after liver-specific downregulation of JMJD3 and G/O analysis (bottom) of the hepatic genes that show both increased H3K27-me3 levels and decreased expression. e The mRNA levels of the indicated genes in liver of mice fasted for 16 h (Fs) or refed (Fd) for 6 h after fasted for 10 h were measured by q-RTPCR (n = 5–10 mice). f, g ChIP assays: effects of the downregulation of JMJD3 on f H3K27-me3 levels and g occupancy of JMJD3 at the indicated genes (n = 3 mice). Source data are provided as a Source Data file. All values are presented as mean ± SD. Statistical significance was measured using the eg two-way ANOVA with the Bonferroni post-test. *P < 0.05, **P < 0.01, and NS statistically not significant.
Fig. 2
Fig. 2. JMJD3 promotes hepatic autophagy, including lipophagy.
a The indicated hepatic proteins were detected by IB in JMJD3-floxed mice infected with AAV-TBG-Cre or AAV-GFP for 12 weeks and fasted for 16 h. Relative band intensities for p62 and the LC3-II/LC3-I ratios are below the blots (left, n = 5 mice). LC3 and p62 in representative images of liver sections detected by IHC (middle) and numbers of LC3 puncta/cell (right, n = 10 hepatocytes) (scale bar = 10 μm for LC3, 50 μm for p62). b Levels of the indicated hepatic proteins were determined by IB in C57BL/6 mice infected with Ad-empty (GFP) or Ad-JMJD3 for 4 weeks and fasted for 8 h (n = 3 mice). c, d Hepa1c1c7 cells were transfected with expression plasmids or JMJD3 siRNA as indicated for 72 h and cultured in HBSS for 2 h. c Representative confocal images and the average number of GFP-LC3-II puncta/cell (right, n = 10 cells) are shown (scale bar = 5 μm). d Cells were stained for lipid droplets with BODIPY (red) and imaged by confocal microscopy. Co-localization of GFP-LC3 puncta and BODIPY in the merged image is indicated by white arrows. The number of fluorescent puncta that co-localized with lipid staining (right, n = 20 cells) are shown (scale bar = 5 μm). eg C57BL/6 mice were fed a normal chow diet (ND) or high-fat diet (HFD) for 8 weeks and then were injected with adenoviruses as indicated for 4 weeks. e Hepatic levels of the indicated proteins were measured by IB (n = 3 mice). The ratios of band intensities for the LC3-I/LC3-II relative to those in the first lane are shown below the blot. f Lipids in liver sections stained with Oil Red O (ORO) and H&E (scale bar = 50 μm). g Levels of hepatic triglycerides (TG) and serum β-hydroxybutyrate (β-HDB) (n = 5 mice). Source data are provided as a Source Data file. All values are presented as mean ± SD. Statistical significance was measured using the (a, c, d) Mann–Whitney test or g two-way ANOVA with the Bonferroni post-test. *P < 0.05, **P < 0.01, and NS statistically not significant.
Fig. 3
Fig. 3. Fasting-induced FGF21 promotes hepatic autophagy.
ac FGF21 floxed or FGF21-LKO mice were fasted (Fs) for 24 h, or refed (Fd) for 24 h after fasting. a LC3 and p62 levels in liver extracts detected by IB. The ratios of the LC3-II/I and p62 band intensities are shown below the blot. (n = 3 mice). b LC3 or p62 was detected by IHC analysis. Representative images of liver sections and the average number of LC3-II puncta/cell (right, n = 10 hepatocytes) are shown (scale bar = 10 μm for LC3, 50 μm for p62). c The mRNA levels of the indicated genes measured by q-RTPCR (n = 5–8 mice). d The indicated hepatic proteins detected by IB with the ratios of the LC3-II/I with the band intensities of p62 relative to the first lane shown below the blot (n = 3 mice). e, f C57BL/6 mice were treated with FGF21 (0.1 mg/kg) for 3 h. e Effects of FGF21 on occupancy of JMJD3 (left) and H3K27-me3 levels (right) at the indicated genes (n = 3 mice). f Hepatic mRNA levels measured by q-RTPCR (n = 6–8 mice). g Effects of siRNA-mediated downregulation of FGF21 on levels of indicated proteins in PMH incubated with M199 or HBSS medium. h PMH were transfected with siFGF21 or control RNA for 48 h and infected with Ad-JMJD3 or Ad-empty for 24 h. Cells were cultured in serum-free or complete M199 medium for 12 h and levels of the indicated proteins were determined by IB (n = 2 culture dishes). Source data are provided as a Source Data file. All values are presented as mean ± SD. Statistical significance was measured using the f Mann–Whitney test or b, c, e two-way ANOVA with the Bonferroni post-test. *P < 0.05, **P < 0.01, and NS statistically not significant.
Fig. 4
Fig. 4. FGF21-induced hepatic autophagy is largely dependent on JMJD3.
ac JMJD3-floxed mice were infected with AAV-TBG-Cre or AAV-GFP for 12 weeks (n = 6 mice/group), and injected i.v. with vehicle or FGF21 (0.1 mg/kg) for 3 h. a The indicated hepatic proteins were detected by IB (n = 3 mice). b LC3 or p62 was detected in liver sections by IHC and the number of LC3-II puncta/cell were quantified (right, n = 10 hepatocytes) (scale bar = 10 μm for LC3, 50 μm for p62). c Hepatic mRNA levels of the indicated autophagy-related genes measured by q-RTPCR (n = 5 mice). d, e PMH from JMJD3-floxed mice were infected with AAV-TBG-GFP or AAV-TBG-Cre for 72 h, and treated with vehicle or FGF21 (100 ng/ml) for 12 h. d Levels of the indicated proteins measured by IB (n = 3 culture dishes). e Levels of cellular triglycerides (TG) (n = 10 culture dishes). f Hepa1c1c7 cells were transfected with GFP-LC3 plasmid and with control (siC) or JMJD3 siRNA as indicated. After 72 h, cells were supplemented with 400 μM oleic acid for 6 h before incubation in serum-free DMEM containing vehicle or 100 ng/ml FGF21 for 12 h. Cells were stained for lipid droplets with BODIPY (red) and imaged by confocal microscopy. Co-localization of GFP-LC3 puncta (green) and BODIPY in the merged images is indicated by white arrows. The average number/cell (right, n = 20 cells) of fluorescent puncta that co-localized with lipid staining is shown (scale bar = 5 μm). Source data are provided as a Source Data file. All values are presented as mean ± SD. Statistical significance was measured using the (b, c, e, f) two-way ANOVA with the Bonferroni post-test. **P < 0.01, and NS statistically not significant.
Fig. 5
Fig. 5. JMJD3 coactivates PPARα to induce hepatic autophagy.
a Venn diagram (top) for genes with PPARα cistrome detected by ChIP-seq and hepatic genes inhibited by liver JMJD3 downregulation (as shown in Fig. 1b). G/O analysis (bottom) of the overlapping genes. b WT or PPARα-KO mice were fasted (Fs) for 24 h or refed for 24 h (Fd) after fasting. Levels of LC3 in liver extracts measured by IB with the LC3-II/I ratios shown below the blot (top, n = 3 mice). The mRNA levels of indicated genes (bottom, n = 5 mice). c PMH from JMJD3-floxed mice were infected with AAV-GFP or AAV-Cre for 72 h and treated with vehicle or WY14643 for 12 h. The indicated proteins were detected by IB with the LC3-II/I ratios shown below the blot (top, n = 3 culture dishes). The mRNA levels of indicated genes (bottom, n = 5 mice). d C57BL/6 or PPARα-KO mice were fasted for 1 h and treated with vehicle or 0.1 mg/kg FGF21 for 3 h. Hepatic levels of LC3 measured by IB with the LC3-II/I ratios shown below the blot (top, n = 3). The mRNA levels of indicated genes (bottom, n = 5 mice). e LC3 and p62 detected by IHC. Representative images of liver sections (left) and the average number of puncta/cell (right, n = 10 hepatocytes) are shown (scale bar = 10 μm for LC3, 50 μm for p62). f re-ChIP: Hepatocytes were transfected with PPARα siRNA, 72 h later, cells were treated with FGF21 for 2 h. PPARα was immunoprecipitated followed by immunoprecipitation of JMJD3, and enrichment of Tfeb, Atg7, and Atgl sequences was determined (n = 3 culture dishes). g Hepa1c1c7 cells were transfected with a luciferase reporter containing the PPARα binding site or mutated site from Tfeb or Atg7 and with plasmids and siRNAs as indicated. After 36 h, the cells were treated with 50 μM WY14643 and 100 ng/ml FGF21 overnight. Luciferase activities were normalized to β-galactosidase activities (n = 4 culture dishes). Source data are provided as a Source Data file. bg Values are presented as mean ± SD. Statistical significance was measured using the g one- or bf two-way ANOVA with the Bonferroni post-test. **P < 0.01.
Fig. 6
Fig. 6. Phosphorylation of JMJD3 by FGF21-activated PKA is critical for autophagy induction.
a Experimental outline (top) and spectrum from LC-MS/MS analysis identifying a JMJD3 peptide containing phosphorylated Thr-1044 (bottom). b PMH were transfected with plasmids as indicated, and after 48 h, were treated with vehicle or FGF21 (100 ng/ml) for 30 min. p-Thr-JMJD3 levels were detected by IP/IB and input protein by IB (n = 3 culture dishes). c Hepa1c1c7 cells were transfected with JMJD3 expression plasmids and treated with vehicle or FGF21 for 30 min. Flag-JMJD3 (green) was detected by immunofluorescence (scale bar = 5 μm). d PMH were transfected with JMJD3 expression plasmids as indicated and treated with vehicle or FGF21 for 30 min for CoIP (left) or 2 h for qRT-PCR (right). PPARα in flag-JMJD3 immunoprecipitates or in input detected by IB (left) and the mRNA levels of the indicated genes (right, n = 3 culture dishes). e FGF21-floxed or -LKO mice were fasted for 24 h or refed for 24 h after fasting. Levels of proteins were detected by IB (left) and p-Thr JMJD3 were detected by IP/IB (right) (n = 3 mice). f C57BL/6 mice were treated with 0.1 mg/kg FGF21 for 3 h and then, phosphorylated levels of PKA, ERK, and JMJD3 were detected by IB (n = 3 mice). g Immunoprecipitated flag-JMJD3 was incubated with ATP, PKA, or ERK1/2 as indicated and levels of p-Thr-JMJD3 were detected by IB. h Schematic of fragments of JMJD3 that were fused to GST (top). Binding of PKA or ERK1/2 to GST-JMJD3 proteins was detected by IB (bottom). i PMH were treated with FGF21 and with vehicle or a PKA (H89,10 μM) or MEK/ERK (PD98059, 40 μM) inhibitor for 30 min. Levels of p-Thr-JMJD3 were detected by IP/IB (top) and quantified (bottom, n = 4 culture dishes). Source data are provided as a Source Data file. d, i Values are presented as mean ± SD. Statistical significance was measured using (d, i) two-way ANOVA with the Bonferroni post-test. **P < 0.01, and NS statistically not significant.
Fig. 7
Fig. 7. FGF21-mediated reversal of defective autophagy and hepatosteatosis in obese mice is dependent on JMJD3.
JMJD3-floxed mice fed a HFD for 4 weeks were injected with the indicated viruses and then treated with vehicle or FGF21 every 2 days for 4 weeks with continued feeding of a HFD. af n = 5 mice/group, g n = 3 mice/group. a Experimental outline (top), body weights, food intakes, and images of liver. b Neutral lipids in liver sections stained with H&E and Oil Red O detected by IHC (left) and liver TG levels (right) (scale bar = 50 μm). c Levels of liver acylcarnitine species (left) and serum β-hydroxybutyric acid (β-HDB) (right). d Glucose tolerance test (GTT). e O2 consumption (left) and CO2 production (right) rates measured by indirect calorimetry. f Relative mRNA levels of the indicated hepatic proteins. g Levels of the indicated proteins in liver extracts from mice measured by IB with the LC3-II/I ratio and p62 band intensities shown below the blot (left), liver sections with LC3 detected by IHC (middle), and the number of LC3-II puncta/cell (right, n = 10 hepatocytes) (scale bar = 10 μm). Source data are provided as a Source Data file. ag Values are presented as mean ± SD. Statistical significance was measured using the (b, c, e line graph, f, g) one-way or d two-way ANOVA with the Bonferroni post-test, and (e, bar graph) Student’s t-test. *P < 0.05, **P < 0.01, and NS statistically not significant.
Fig. 8
Fig. 8. Expression of KLB in obese mice restores FGF21 signaling and autophagy.
a Mice that had been fed a ND or HFD for 12 weeks were treated i.v. for 3 h with 0.1 mg/kg FGF21, and hepatic levels of the indicated proteins were detected by IB (left, n = 3 mice). The ratios of band intensities for the indicated proteins are shown (right). b Mice were fed a HFD for the times indicated and mRNA levels of Klb, JMJD3, Fgfr1, and Fgfr4 were measured by q-RTPCR (n = 3 mice). c Mice fed a HFD for 8 weeks were injected with AAV-TBG-KLB or AAV-TBG-GFP. Four weeks later, the mice were treated i.v. with vehicle or 0.1 mg/kg FGF21 for 3 h, and hepatic protein levels of the indicated proteins were detected by IB (n = 2 mice). Source data are provided as a Source Data file. a, b Values are presented as mean ± SD. Statistical significance was measured using the a two-way ANOVA with the Bonferroni or b one-way ANOVA with the Dunnett post-test *P < 0.05, **P < 0.01, and NS, statistically not significant.
Fig. 9
Fig. 9. Expression of JMJD3, TFEB, and autophagy genes is reduced in NAFLD patients.
Liver samples from normal, simple steatosis and NASH-fibrosis patients were analyzed. a The mRNA levels of the indicated genes measured by q-RTPCR (n = 15 individuals). b Levels of the indicated proteins in liver samples detected by IB (left, n = 4 normal, n = 5 patients, 3 to 4 pooled samples/lane) and quantified (right). c LC3, JMJD3, and ATG7 were detected in liver sections by IHC. LC3 puncta are indicated by yellow arrows (scale bar = 10 μm for LC3, 50 μm for JMJD3 and ATG7). Source data are provided as a Source Data file. a, b Values are presented as mean ± SD. Statistical significance was measured using the a, b one-way ANOVA with the Bonferroni post-test. *P < 0.05, **P < 0.01, and NS statistically not significant. d Model: in response to fasting, JMJD3 is phosphorylated at Thr-1044 by FGF21 signaling-activated PKA in mouse hepatocytes, which promotes its nuclear localization and interaction with the nuclear receptor PPARα to epigenetically induce transcription of genes involved in autophagy and lipid degradation, including Atg7, Ulk1, Atgl, Tfeb, and Pgc-1α, and as a positive feed-forward loop, JMJD3 and FGF21 expression. Induced hepatic FGF21 sustains the activation of the FGF21-JMJD3-autophagy axis in an autocrine manner when fasting continues.

Similar articles

Cited by

References

    1. Levine B, Klionsky DJ. Development by self-digestion: molecular mechanisms and biological functions of autophagy. Dev. Cell. 2004;6:463–477. doi: 10.1016/S1534-5807(04)00099-1. - DOI - PubMed
    1. Mizushima N, Komatsu M. Autophagy: renovation of cells and tissues. Cell. 2011;147:728–741. doi: 10.1016/j.cell.2011.10.026. - DOI - PubMed
    1. Singh R, et al. Autophagy regulates lipid metabolism. Nature. 2009;458:1131–1135. doi: 10.1038/nature07976. - DOI - PMC - PubMed
    1. Levine B, Kroemer G. Autophagy in the pathogenesis of disease. Cell. 2008;132:27–42. doi: 10.1016/j.cell.2007.12.018. - DOI - PMC - PubMed
    1. Yang L, Li P, Fu S, Calay ES, Hotamisligil GS. Defective hepatic autophagy in obesity promotes ER stress and causes insulin resistance. Cell Metab. 2010;11:467–478. doi: 10.1016/j.cmet.2010.04.005. - DOI - PMC - PubMed

Publication types

MeSH terms