

The effect of group size, age and handling frequency on inter-male aggression in CD 1 mice
- PMID: 32042065
- PMCID: PMC7010790
- DOI: 10.1038/s41598-020-59012-4
The effect of group size, age and handling frequency on inter-male aggression in CD 1 mice
Abstract
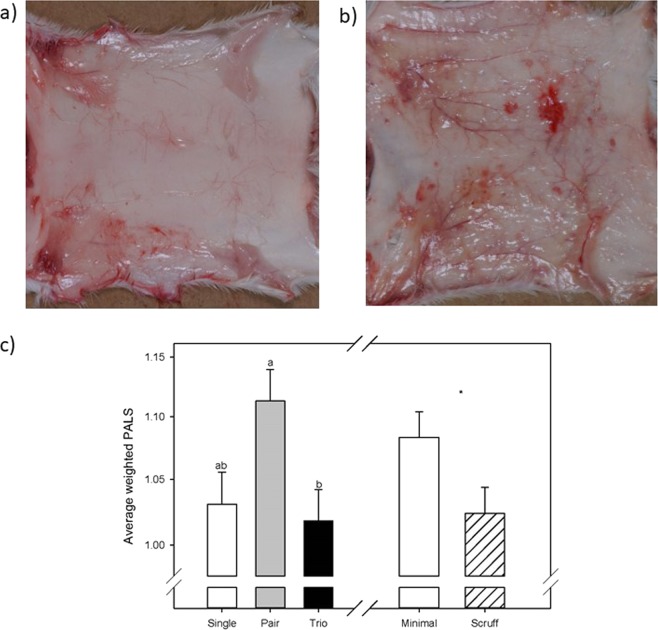
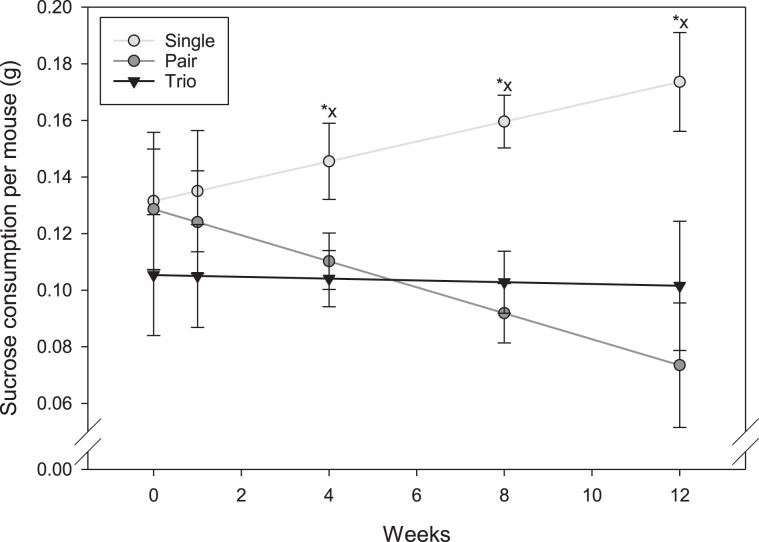
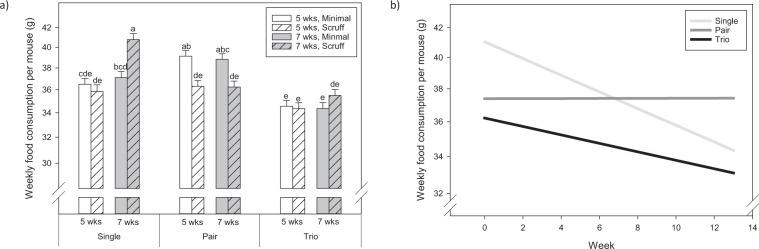
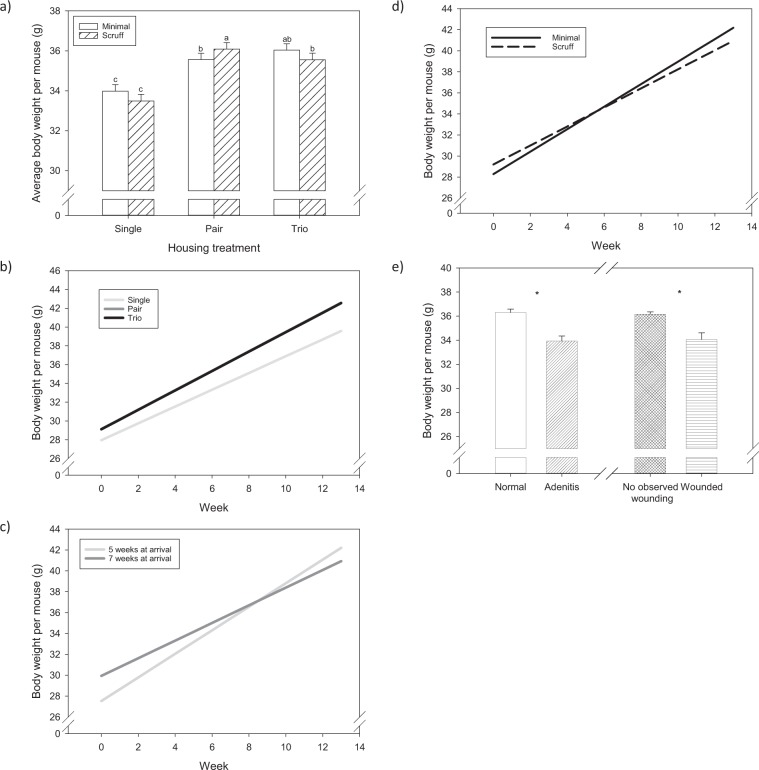
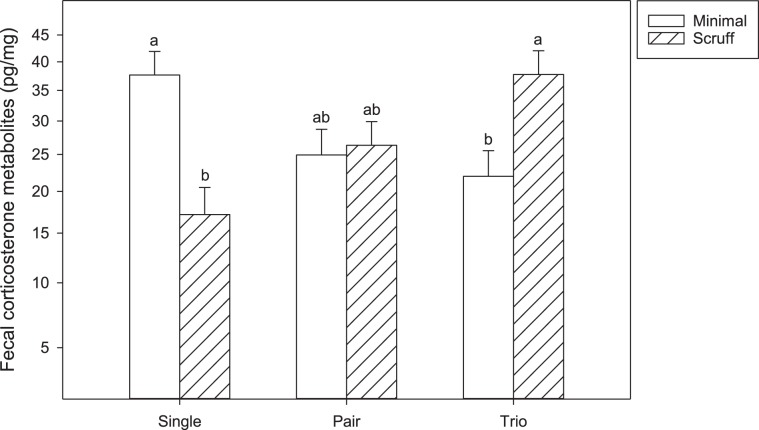
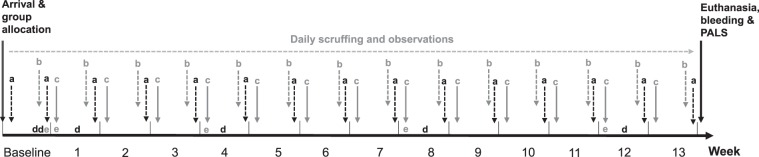
Aggression in male mice often leads to injury and death, making social housing difficult. We tested whether (1) small group size, (2) early age of allocation to a group decreases aggression and 3) manipulation increases aggression in male mice. A 14wk study was performed to assess the following conditions in male CD-1/ICR mice: group size (1, 2, or 3), age at grouping (5 or 7wks), and manipulation (daily scruffing or minimal weekly handling). Wounds, body weights, food consumption, nest scores, sucrose consumption, fecal corticosterone and blood for hematology were collected. At the end of the study, mice were euthanized and pelted to assess wounding with the pelt aggression lesion scale (PALS). No signs of acute or chronic stress were observed in any of the groups. Trio housed mice showed less bite wounds than pair housed mice. In general, mice in larger groups ate less but weighed more. Individually housed mice, however, had high nest scores, low body weights, and increased sucrose and food consumption. These results suggest that even when nesting material is provided, individual mice may be experiencing thermal stress. Based on this data, CD-1 mice can successfully be housed for up to 14wks and groups of 3 may be the best for reducing even minor levels of aggression (i.e. wounding).
Conflict of interest statement
The authors declare no competing interests.
Figures
Similar articles
-
Effect of three different forms of handling on the variation of aggression-associated parameters in individually and group-housed male C57BL/6NCrl mice.PLoS One. 2019 Apr 12;14(4):e0215367. doi: 10.1371/journal.pone.0215367. eCollection 2019. PLoS One. 2019. PMID: 30978250 Free PMC article.
-
Long-term effects of husbandry procedures on stress-related parameters in male mice of two strains.Lab Anim. 2004 Apr;38(2):169-77. doi: 10.1258/002367704322968858. Lab Anim. 2004. PMID: 15070457
-
Assessing the effect of compounds from plantar foot sweat, nesting material, and urine on social behavior in male mice, Mus musculus.PLoS One. 2022 Nov 2;17(11):e0276844. doi: 10.1371/journal.pone.0276844. eCollection 2022. PLoS One. 2022. PMID: 36322597 Free PMC article.
-
Peculiar response of adolescent mice to acute and chronic stress and to amphetamine: evidence of sex differences.Behav Brain Res. 2002 Mar 10;130(1-2):117-25. doi: 10.1016/s0166-4328(01)00420-x. Behav Brain Res. 2002. PMID: 11864727 Review.
-
Effects of group housing on sow welfare: a review.J Anim Sci. 2015 May;93(5):1999-2017. doi: 10.2527/jas.2014-8742. J Anim Sci. 2015. PMID: 26020296 Review.
Cited by
-
The epidemiology of fighting in group-housed laboratory mice.Sci Rep. 2020 Oct 6;10(1):16649. doi: 10.1038/s41598-020-73620-0. Sci Rep. 2020. PMID: 33024186 Free PMC article.
-
Exploring Refinement Strategies for Single Housing of Male C57BL/6JRj Mice: Effect of Cage Divider on Stress-Related Behavior and Hypothalamic-Pituitary-Adrenal-Axis Activity.Front Behav Neurosci. 2021 Oct 28;15:743959. doi: 10.3389/fnbeh.2021.743959. eCollection 2021. Front Behav Neurosci. 2021. PMID: 34776890 Free PMC article.
-
Effects of Group Size on Behavior, Reproduction, and mRNA Expression in Brains of Brandt's Voles.Brain Sci. 2023 Feb 12;13(2):311. doi: 10.3390/brainsci13020311. Brain Sci. 2023. PMID: 36831854 Free PMC article.
-
Who's the Boss? Assessing Convergent Validity of Aggression Based Dominance Measures in Male Laboratory Mice, Mus Musculus.Front Vet Sci. 2021 Jul 9;8:695948. doi: 10.3389/fvets.2021.695948. eCollection 2021. Front Vet Sci. 2021. PMID: 34307534 Free PMC article.
-
Postweaning Grouping as a Strategy to Reduce Singly Housed Male Mice.Animals (Basel). 2020 Nov 17;10(11):2135. doi: 10.3390/ani10112135. Animals (Basel). 2020. PMID: 33212955 Free PMC article.
References
-
- Olsson IAS, Westlund K. More than numbers matter: The effect of social factors on behaviour and welfare of laboratory rodents and non-human primates. Applied Animal Behaviour Science. 2007;103:229–254. doi: 10.1016/j.applanim.2006.05.022. - DOI
-
- Brown RZ. Social Behavior, Reproduction, and Population Changes in the House Mouse (Mus-Musculus L) Ecological Monographs. 1953;23:217–240. doi: 10.2307/1943592. - DOI
-
- Crowcroft, P. Mice all over, (Foulis, 1966).
-
- Wolff RJ. Mating-Behavior and Female Choice - Their Relation to Social-Structure in Wild Caught House Mice (Mus-Musculus) Housed in a Semi-Natural Environment. Journal of Zoology. 1985;207:43–51. doi: 10.1111/j.1469-7998.1985.tb04914.x. - DOI
Publication types
MeSH terms
LinkOut - more resources
Full Text Sources
Research Materials
