. 2020 Jun;4(6):613-621.
doi: 10.1038/s41562-020-0823-z. Epub 2020 Feb 10.

Conservatives and liberals have similar physiological responses to threats

Affiliations

Conservatives and liberals have similar physiological responses to threats

Bert N Bakker et al. Nat Hum Behav. 2020 Jun.

Abstract

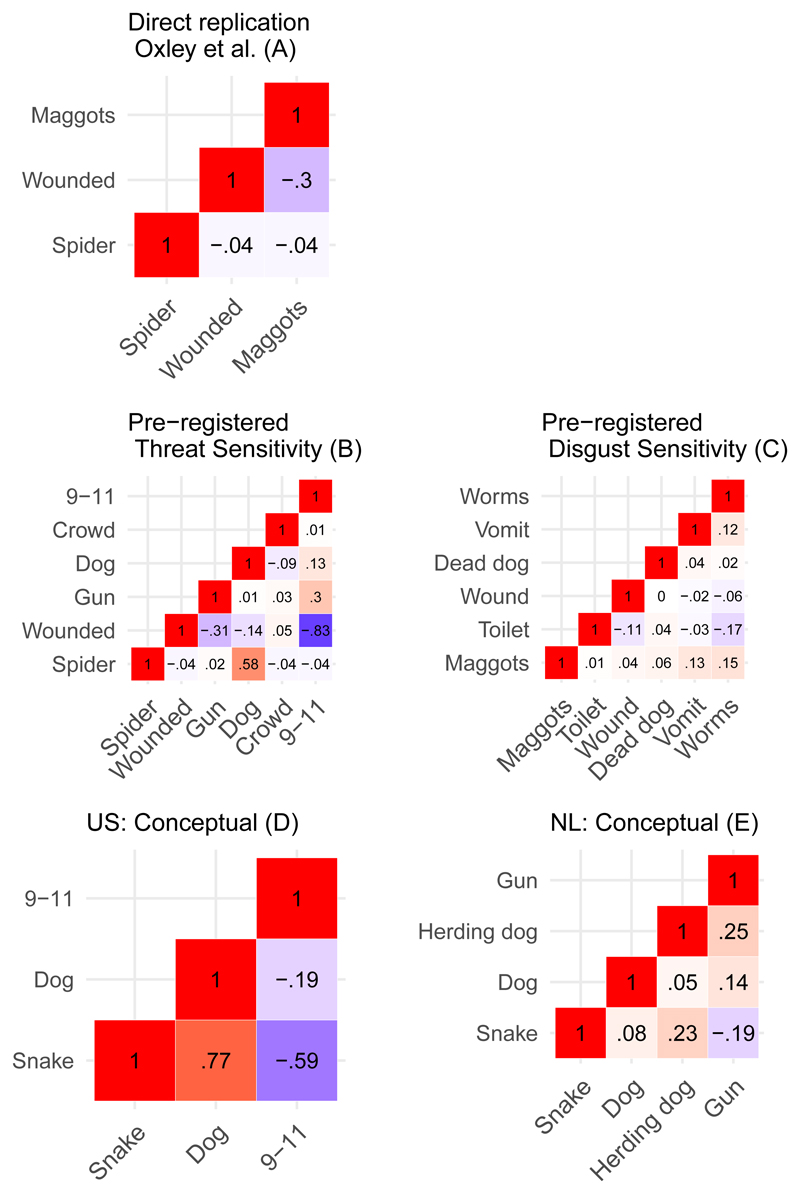
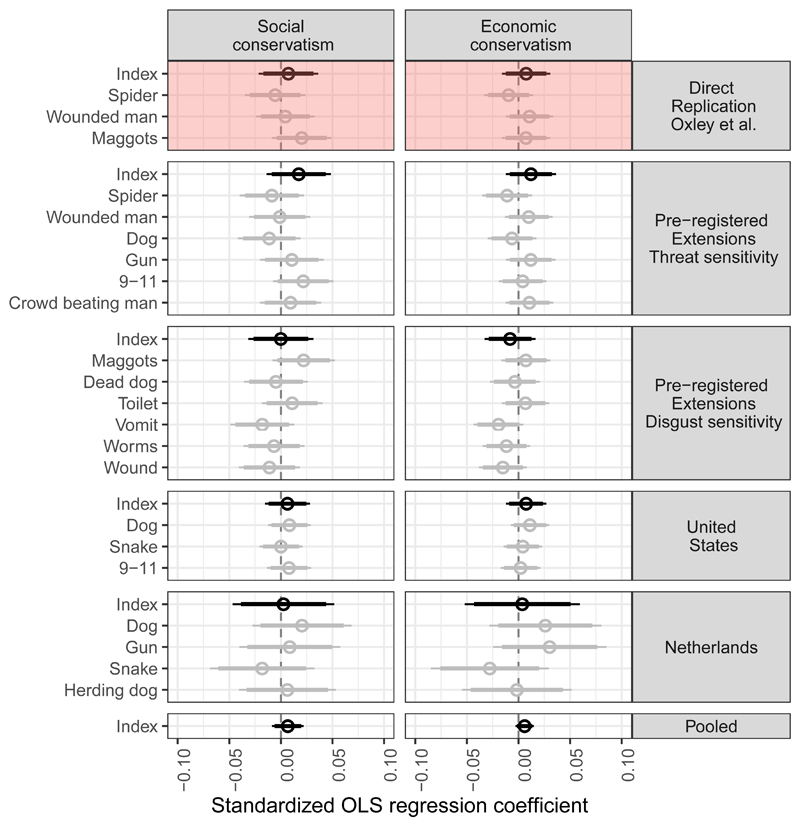
About a decade ago, a study documented that conservatives have stronger physiological responses to threatening stimuli than liberals. This work launched an approach aimed at uncovering the biological roots of ideology. Despite wide-ranging scientific and popular impact, independent laboratories have not replicated the study. We conducted a pre-registered direct replication (n = 202) and conceptual replications in the United States (n = 352) and the Netherlands (n = 81). Our analyses do not support the conclusions of the original study, nor do we find evidence for broader claims regarding the effect of disgust and the existence of a physiological trait. Rather than studying unconscious responses as the real predispositions, alignment between conscious and unconscious responses promises deeper insights into the emotional roots of ideology.


Conflict of interest statement

Competing interests

The authors declare no competing interests.

Figures

Figure 1
Figure 1. Assessment of a latent threat sensitivity dimension.
Correlation matrices with the Pearson correlation coefficients between the physiological responses (skin conductance response) to the threatening images in the pre-registered replication of Oxley et al. (panel A, N=202), the pre-registered extensions for threat sensitivity (panel B, N=202) and disgust sensitivity (panel C, N=202) as well as the conceptual replications in the U.S. (panel D, N=352) and the Netherlands (panel E, N=81). Darker red background means that the correlation is strongly positive, darker blue strongly negative and white means that the correlation is close to zero. Frequentist inferential statistics are reported in full in the Supplementary Table 9 (Panel A), Supplementary Table 10 (Panel B), Supplementary Table 11 (Panel C), Supplementary Table 12 (Panel D) and Supplementary Table 13 (Panel E).
Figure 2
Figure 2. Associations between threat sensitivity and social and economic conservatism.
Plot of the standardized OLS regression coefficients of the models where social conservatism (left-hand panel) and economic conservatism (right-hand panel) are regressed on threat sensitivity controlling for the covariates that Oxley et al. used. The dot is the point estimate with 90% (thick) and 95% (thin) confidence intervals. The results for the composite index are provided in black and those for the individual items in grey. The results from the pre-registered direct replication (N=202) are provided in row 1 (shaded), this is followed by the pre-registered extensions for threat sensitivity (row 2, N=202), the pre-registered extensions for disgust sensitivity (row 3, N=202) and the conceptual replications in the US (row 4, N=352) and the Netherlands (row 5, N=81) and finally row 6 contains the results from the pooled analyses (N=635). Regression output with all frequentist inferential statistics and the samples size per model can be found in Supplementary Results: Direct replication Oxley et al. (Supplementary Table 14 & Table 15), pre-registered extensions threat sensitivity (Supplementary Table 16 - Table 18), pre-registered extensions disgust sensitivity (Supplementary Table 19 - Table 21), United States (Supplementary Table 22 & Table 23), Netherlands (Supplementary Table 24 & Table 25) and the pooled analyses (Table 26).

References

    1. Oxley DR, et al. Political Attitudes Vary with Physiological Traits. Science. 2008;321:1667–1670. - PubMed
    1. Adorno TW, Frenkel-Brunswik E, Levinson DJ, Sanford RN. The authoritarian personality. 1950
    1. Jost JT, Glaser J, Kruglanski AW, Sulloway FJ. Political Conservatism as Motivated Social Cognition. Psychological bulletin. 2003;129:339–375. - PubMed
    1. Wilson GD. The psychology of conservatism. Academic press; London: 2013.
    1. Altemeyer B. Enemies of freedom: Understanding right-wing authoritarianism. Jossey-Bass; 1988.

Publication types