. 2020 Feb;27(2):168-178.
doi: 10.1038/s41594-020-0372-1. Epub 2020 Feb 10.

Cell fitness screens reveal a conflict between LINE-1 retrotransposition and DNA replication

Affiliations

Cell fitness screens reveal a conflict between LINE-1 retrotransposition and DNA replication

Daniel Ardeljan et al. Nat Struct Mol Biol. 2020 Feb.

Abstract

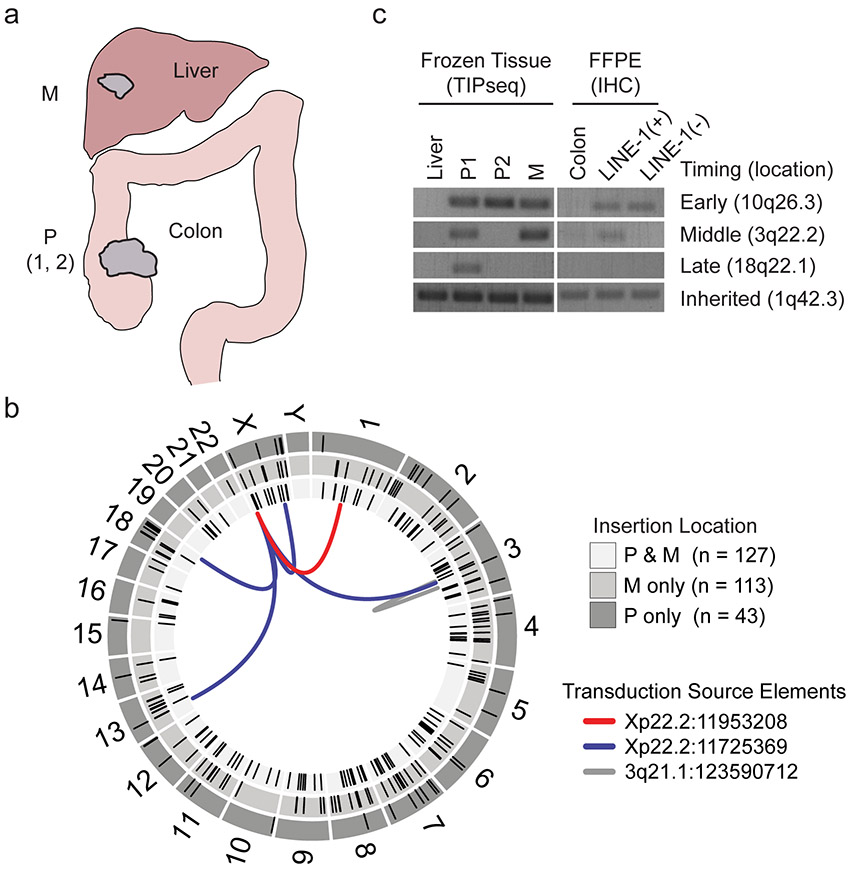
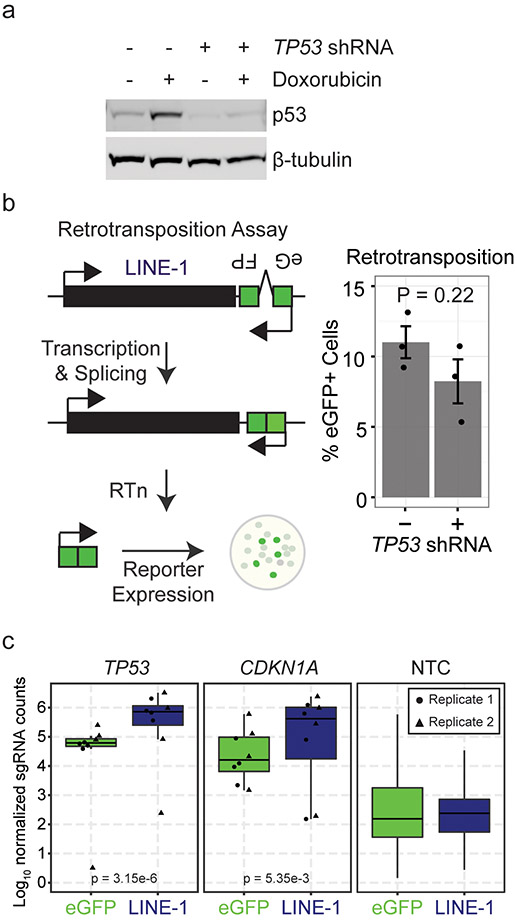
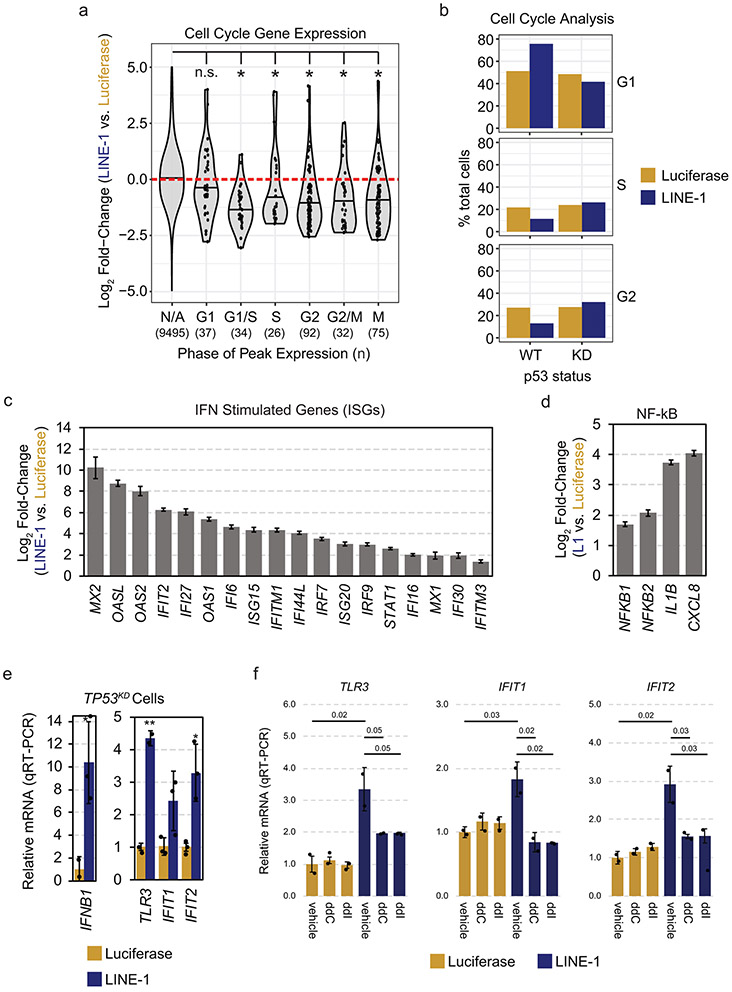
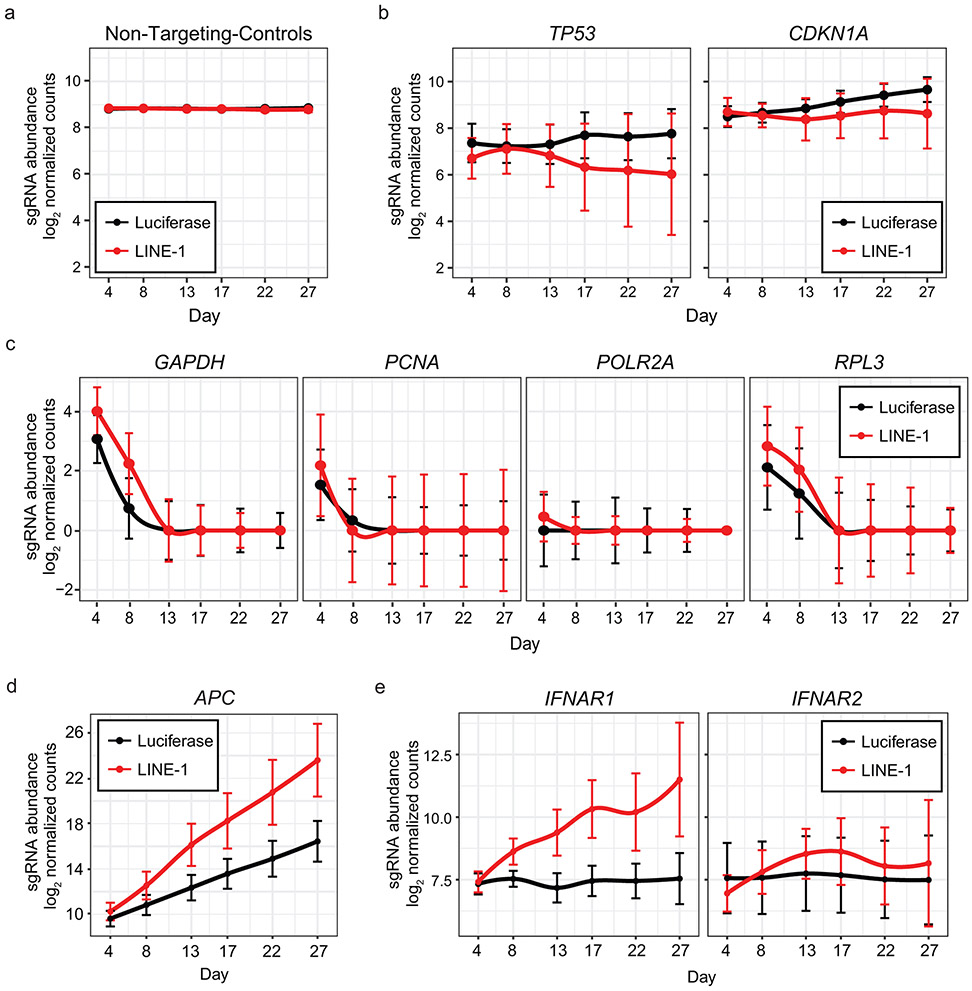
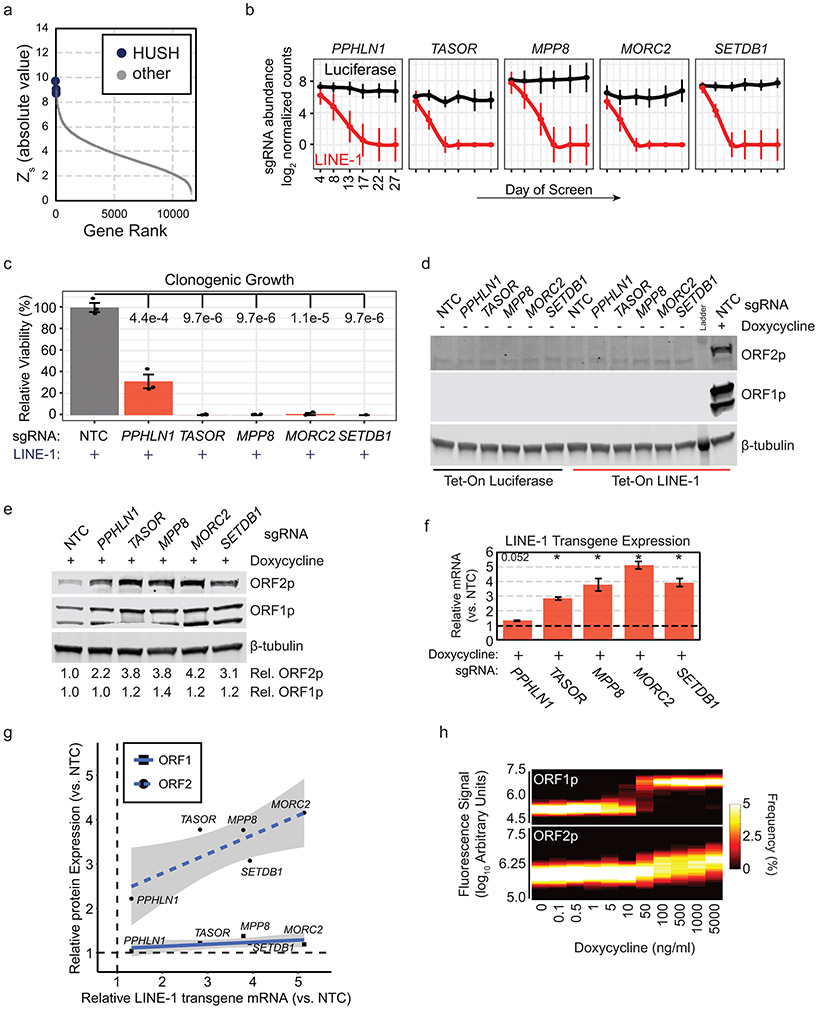
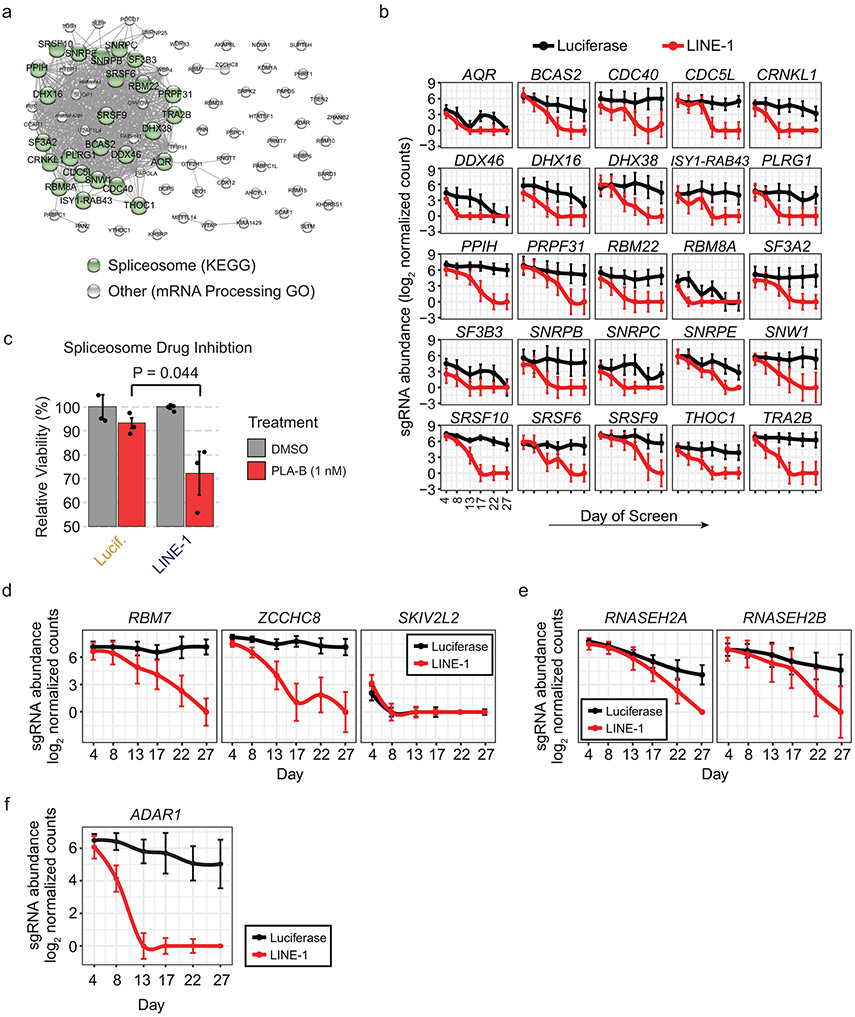
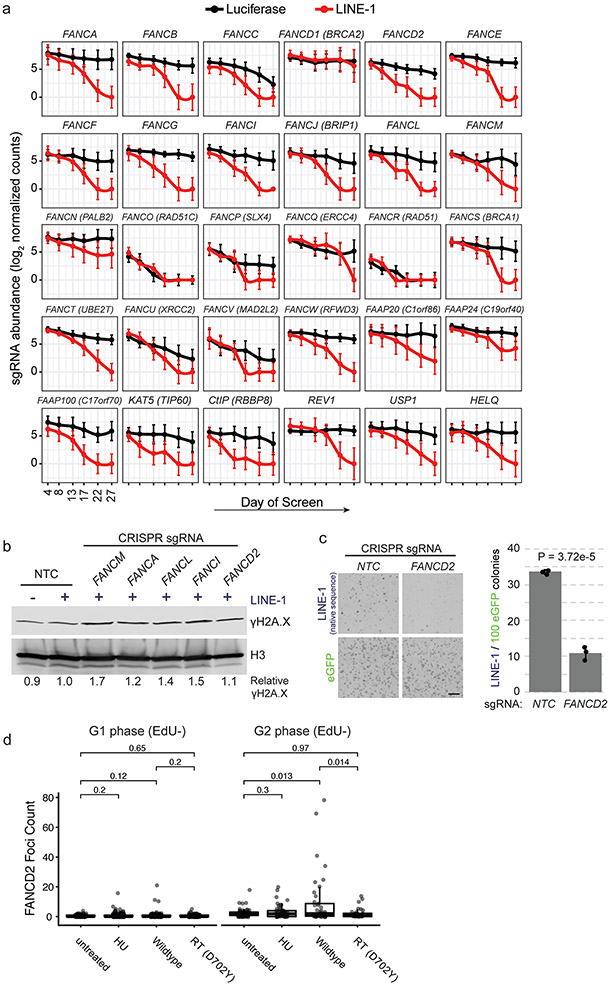
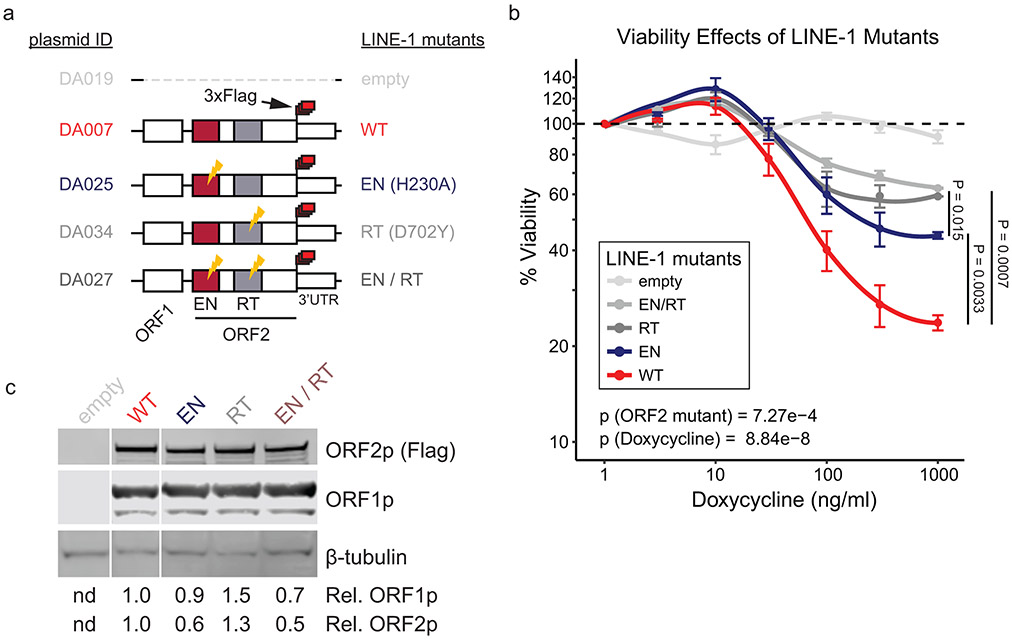
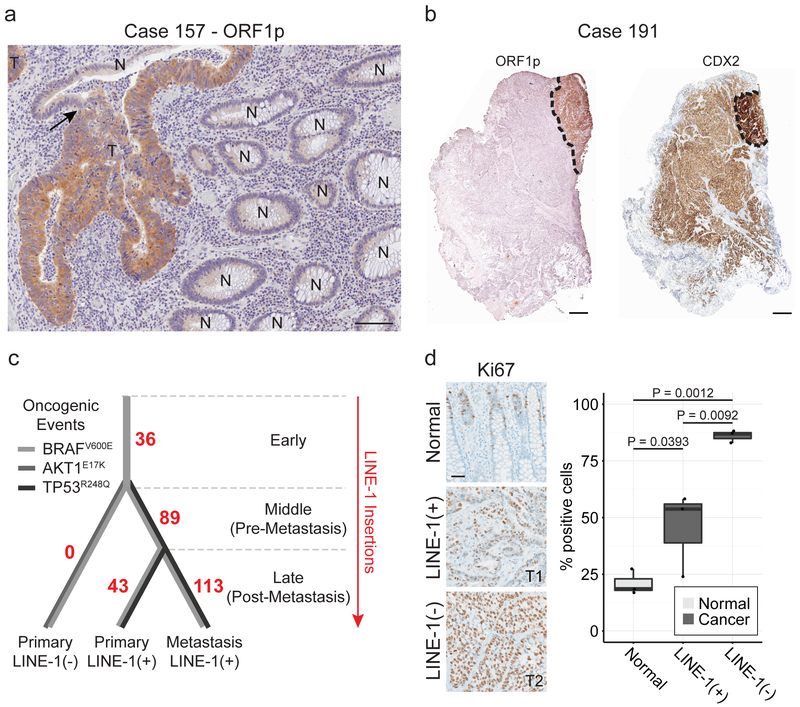
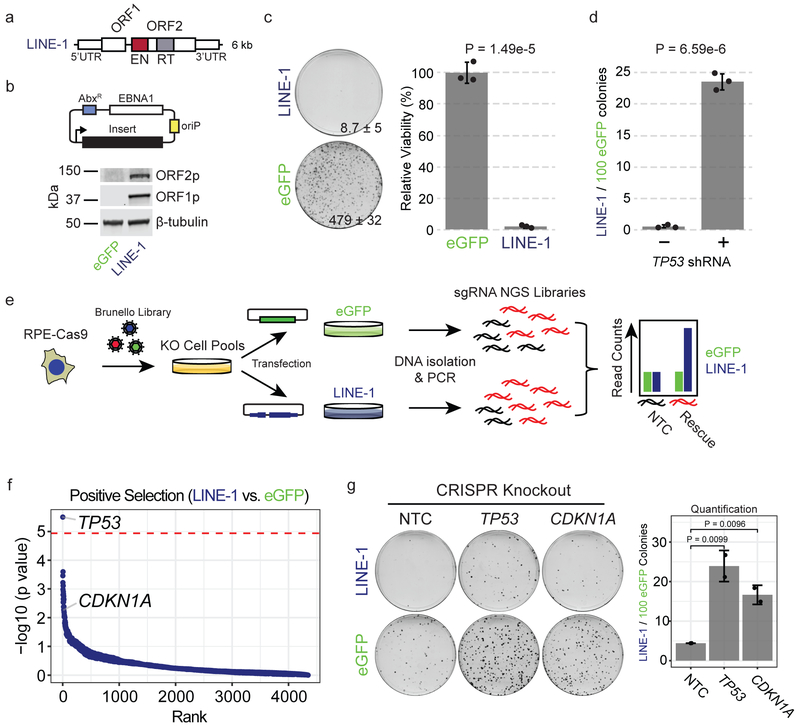
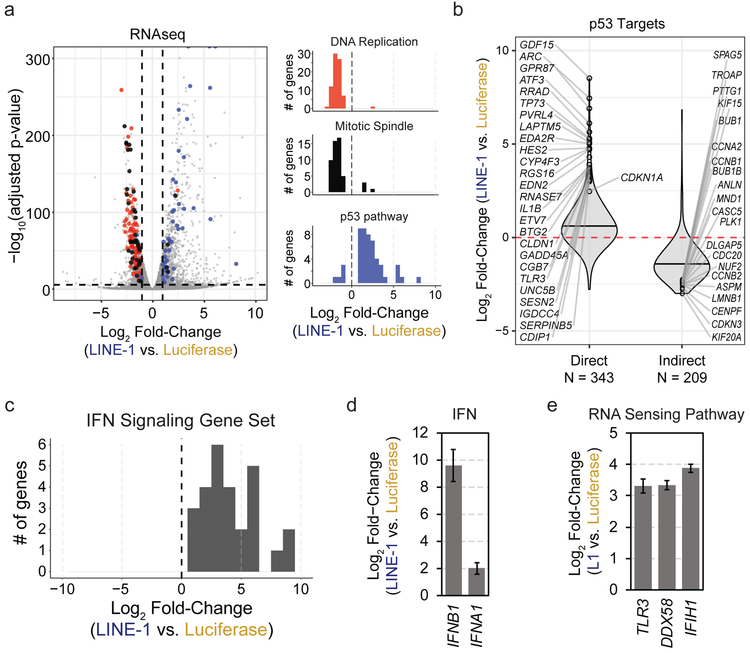
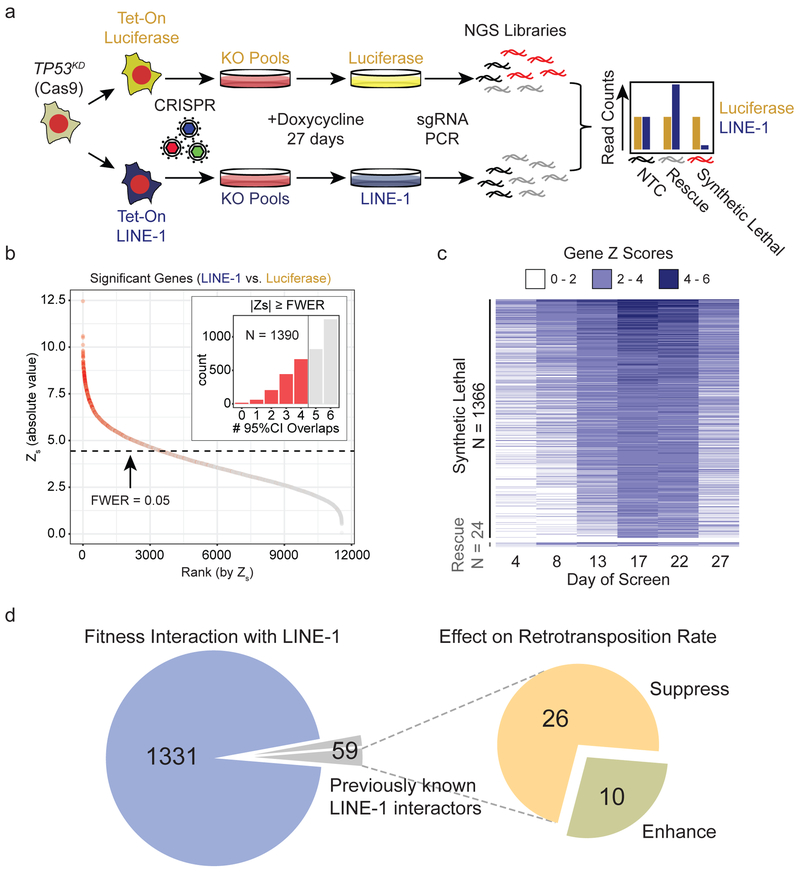
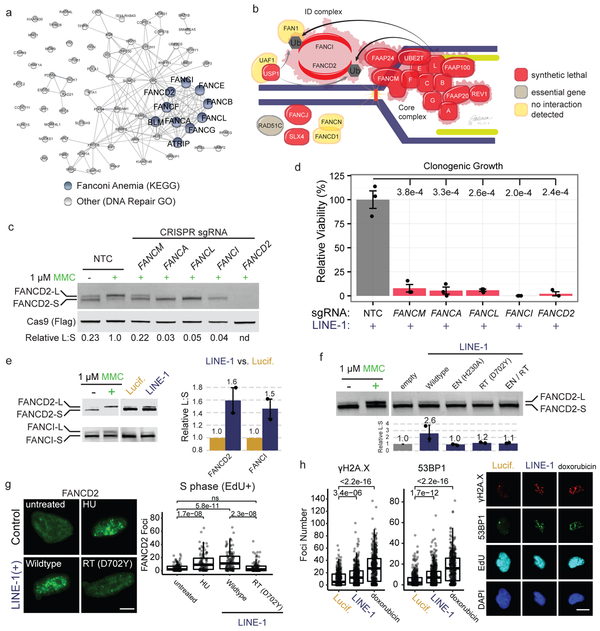
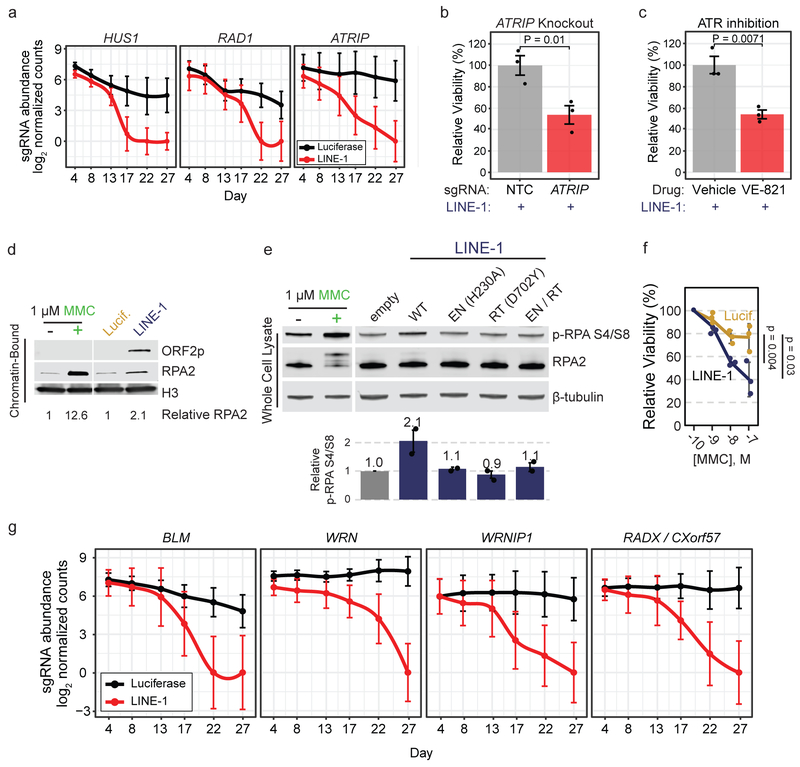
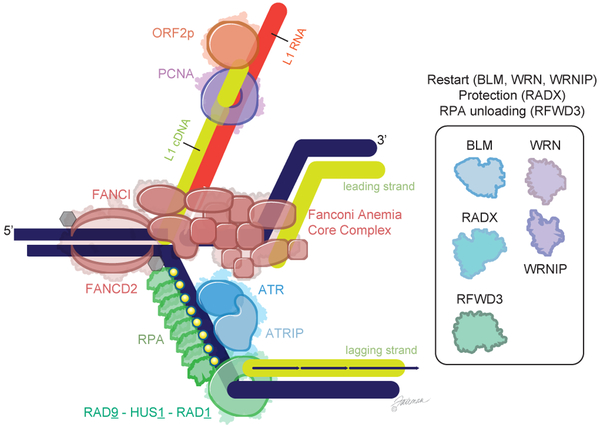
LINE-1 retrotransposon overexpression is a hallmark of human cancers. We identified a colorectal cancer wherein a fast-growing tumor subclone downregulated LINE-1, prompting us to examine how LINE-1 expression affects cell growth. We find that nontransformed cells undergo a TP53-dependent growth arrest and activate interferon signaling in response to LINE-1. TP53 inhibition allows LINE-1+ cells to grow, and genome-wide-knockout screens show that these cells require replication-coupled DNA-repair pathways, replication-stress signaling and replication-fork restart factors. Our findings demonstrate that LINE-1 expression creates specific molecular vulnerabilities and reveal a retrotransposition-replication conflict that may be an important determinant of cancer growth.


Figures

Extended Data Fig. 1
Extended Data Fig. 1. LINE-1 heterogeneity in colon cancer
(a) Tissues collected for transposon insertion profiling by sequencing (TIP-seq) mapping of tumor-specific LINE insertions. Fresh frozen tissue was collected from two sites in the primary tumor in the colon and one site in the metastatic tumor in the liver. Normal tissue was collected from the liver. The liver metastasis exhibited ORF1p immunoreactivity as well (data not shown). (b) Circos plot detailing TIP-seq results and whether insertions were found in the primary (P only), metastasis (M only) or in both (P & M). In the validation process, we identified 11 3’ transduction events, 6 of which mapped to two LINE-1 sequences on Xp22.2 and one on 3q21.1 that are known to be highly active tumor alleles. As expected, the majority of this tumor’s de novo insertions were intronic or intergenic and not near known tumor suppressors or oncogenes. (c) We genotyped the insertions using hemi-specific PCR in genomic DNA obtained from dissected histology slides and compared to the allele’s presence in bulk frozen tissue used for TIP-seq. In all samples, we detected an inherited LINE-1 on 1q42.3, indicating that our PCR conditions were sufficient to detect LINE-1 elements. An early de novo insertion on 10q26.3 was found in all frozen tissue samples (primary and metastasis) and both CDX2-high and CDX2-dim slide-dissected samples. An insertion on 3q22.2 is present in the primary tumor subclonally and in the metastasis and therefore occurred before metastasis but after dedifferentiation of the CDX2-dim clone. An insertion on 18q22.1 occurred after metastasis to the liver had occurred, since it was found in the primary CDX2-high clone and not in the metastasis.
Extended Data Fig. 2
Extended Data Fig. 2. LINE-1 effects on cell growth and retrotransposition.
(a) Demonstration of effective TP53 knockdown. RPE cells were treated with TP53 shRNA lentivirus (DA079) or control lentivirus (DA081). The Western blot shows the p53 response to treatment with the DNA intercalator doxorubicin (200 ng/ml for 24 hours). (b) Left, the retrotransposition reporter assay. LINE-1 is expressed from a plasmid with an antisense eGFP in the 3’UTR that is interrupted by a sense intron. During transcription, the intron is spliced, reconstituting the coding potential of the eGFP reporter. The eGFP reporter carries with it a CMV promoter and is inserted into the genome by LINE-1. Expression of eGFP from the genome allows for fluorescence-based quantification of retrotransposition rate by flow cytometry. Right, reporter assay performed in RPE with TP53 knockdown or control ±SEM, n=3 independent experiments. P value was calculated by two-sided T test. (c) Normalized median read counts of sgRNAs targeting TP53 and CDKN1A in cells expressing either LINE-1 (navy blue) or eGFP (green) control compared to non-targeting-controls (NTC). Individual sgRNAs are indicated by circles or triangles. Results from two biological replicates are depicted.
Extended Data Fig. 3
Extended Data Fig. 3. LINE-1 RNAseq analysis.
(a) Genes regulated by cell cycle were curated from CycleBase v3.081 and differential expression values were plotted. S, G2, and M phase genes were significantly downregulated in LINE-1(+) cells. Unpaired two-sided T tests were used for statistical testing. N/A = not applicable. *p-values vs. N/A: G1 = not significant (n.s.), G1/S = 1.7e-9, S = 1.5e-2, G2 = 2.1e-13, G2/M = 5.2e-6, M = 3.4e-10. (b) Flow cytometry was used to assess cell cycle by quantifying DNA content using a PI DNA stain in Tet-On LINE-1 or Tet-On luciferase cells induced with 1 μg/ml doxycycline for 48 hours. LINE-1(+) cells with wildtype (WT) p53 accumulated in G1 phase (2n DNA copy number), whereas TP53 knockdown (KD) resulted in more even cell cycle proportions. These data are from one experiment. (c) Relative fold-change of interferon-stimulated genes in LINE-1 compared to luciferase-expressing cells measured by RNAseq. Error bars indicate SEM. (d) RNAseq analysis revealed upregulation of NF-kB and several target genes in LINE-1(+) cells. Error bars indicate SEM. (e) Differential expression of IFNB1 (right) and interferon-stimulated genes (left) in p53-knockdown cells expressing LINE-1 or luciferase for 72 hours. Measured by qRT-PCR. Error bars indicate SD, n=3 biological replicates. * p < 0.05, ** p < 0.001. (f) Differential expression of TLR3, IFIT1, and IFIT2 with the addition of 5μM zalcitabine (ddC) or 5μM didanosine (ddI) in p53-knockdown cells expressing LINE-1 or luciferase for 72 hours. Measured by qRT-PCR, n=3 independent experiments. P values indicated within the plots.
Extended Data Fig. 4
Extended Data Fig. 4. TP53-Knockdown Screen Supplement
(a) Behavior of non-targeting-control sgRNAs in the screen over time. Data points indicate the median sgRNA count per replicate and error bars the 95% confidence interval. (b) Behavior of TP53- and CDNK1A-targeting sgRNAs. Median values are depicted with 95% Confidence Intervals. There is no appreciable change in TP53 sgRNA representation between LINE-1(+) and luciferase control cells, indicating loss of p53 function due to the shRNA. CDNK1A sgRNAs do not differ between groups as well, suggesting that CDKN1A effects are contingent on p53 function. (c) Examples of essential gene knockouts that deplete from both LINE-1(+) and luciferase(+) cells. Median values are depicted with 95% Confidence Intervals. (d) Knockout of APC provides a growth advantage to LINE-1(+) cells. Median values are depicted with 95% Confidence Intervals. (e) Knockout of the interferon alpha and beta receptor subunit 1 (IFNAR1) but not subunit 2 (IFNAR2) provides a growth advantage in LINE-1(+) cells. Median values are depicted with 95% Confidence Intervals.
Extended Data Fig. 5
Extended Data Fig. 5. HUSH knockout is synthetic lethal due to derepression of the LINE-1 transgene.
(a) Gene screen ranks by Zs scores. HUSH genes are in blue. (b) HUSH complex sgRNA performance during the screen. All knockouts drop out early from LINE-1(+) cells (red) and do not affect growth of luciferase(+) cells (black). Median values are depicted with 95% Confidence Intervals. (c) 12-day clonogenic growth assay in cells expressing LINE-1 (doxycycline-induced) with targeted knockouts of HUSH components compared to non-targeting-control (NTC). n=3 independent experiments. Error bars indicate ±SEM. P values calculated by one-sided T test. (d) Western blot comparing ORF1p and ORF2p expression in HUSH knockout cells or non-target-controls (NTC) that have not been treated with doxycycline compared to NTC with 24 hours of 1 μg/ml doxycycline treatment. ORF1p and ORF2p protein expression are only detected in NTC-treated cells with doxycycline added to the culture media. The double banding pattern for ORF1p is consistently seen with codon-optimized LINE-1. (e) Western blot comparing ORF1p and ORF2p expression 24 hours after 1 μg/ml doxycycline treatment in HUSH knockouts compared to NTC. The ORF2p antibody cannot distinguish between endogenous or transgenic LINE-1 expression. (f) qRT-PCR analysis of LINE-1 transgene expression in HUSH knockouts compared to NTC (induced with 1 μg/ml doxycycline). Because the LINE-1 transgene is codon-optimized, qRT-PCR is specific for the transgene and does not amplify endogenous LINE-1 sequences. *p < 0.001. (g) Linear regression plot of LINE-1 transgene expression and ORF1p and ORF2p protein expression in HUSH knockouts compared to NTC. Shaded area indicates 95% confidence interval for regression line. Both ORF1p and ORF2p increase in expression with higher transgene mRNA expression, although the increase in ORF1p is minimal compared to that observed with ORF2p. (h) Heatmap of immunofluorescence imaging depicting the proportion of cells expressing ORF1p and ORF2p at different levels in HEK293T cells expressing Tet-On LINE-1 (pDA055) at increasing doses of doxycycline.
Extended Data Fig. 6
Extended Data Fig. 6. RNA processing gene knockouts sensitize cells to LINE-1
(a) StringDB network plot of the 81 mRNA processing genes identified by this screen. Edges indicate known protein-protein interactions. This network is enriched for spliceosome machinery (green nodes). (b) Screen behavior of significant genes belonging to the spliceosome KEGG GO term. Median sgRNA counts are depicted with 95% Confidence Intervals. (c) Clonogenic assay (12 days) comparing growth of luciferase(+) and LINE-1(+) cells (induced with 1 μg/ml doxycycline) treated with 1 nM pladienolide B (PLA-B) or vehicle (DMSO). n=3 independent experiments. Error bars indicate SEM. P value calculated by unpaired one-sided T test. (d) Behavior of nuclear exosome complex genes in the screen. Median values are depicted with 95% Confidence Intervals. (e) Behavior of RNASEH2 component sgRNAs in the screen. Median values are depicted with 95% Confidence Intervals. (f) Behavior of ADAR1 sgRNAs in the screen. Median values are depicted with 95% Confidence Intervals.
Extended Data Fig. 7
Extended Data Fig. 7. The Fanconi Anemia Pathway is required for growth of LINE-1(+) cells
(a) Behavior of sgRNAs targeting Fanconi Anemia pathway genes in the screen. Median values are depicted with 95% Confidence Intervals. (b) Western blot of DNA damage marker γH2A.X in chromatin-bound protein fractions of LINE-1(+) cells with or without perturbations to the FA pathway. H3 was used as loading control. γH2A.X levels were quantified and graphed relative to NTC-treated, LINE-1(+) cells. (c) Clonogenic assay (day 10). TP53KD cells constitutively expressing Cas9 are treated with lentivirus encoding non-targeting-control (NTC) or FANCD2 sgRNA and then transfected with eGFP (pDA083) or the native LINE-1 sequence L1RP (pDA077). Left, representative images of colonies. Scale bar = 1 cm. Right, data are presented as the rate of LINE-1 per 100 eGFP colonies ± SD to control for transfection efficiency across samples, n=3 independent experiments. P value obtained by unpaired two-sided T test. (d) Quantification of FANCD2 foci in G1 and G2 phase (EdU-) HeLa cells. Number of cells per group: G1 untreated (n=104), G1 HU (n=352), G1 wildtype LINE-1 (n=186), G1 RT (D702Y) (n=138), G2 untreated (n=60), G2 HU (n=58), G2 wildtype LINE-1 (n=42), G2 RT (D702Y) (n=32). Two-sided T tests were used for statistical comparisons. HU = hydroxyurea. RT = reverse transcriptase. ns = not significant.
Extended Data Fig. 8
Extended Data Fig. 8. Viability assays with LINE-1 mutants
(a) Tet-On constructs for wildtype and mutant LINE-1 expression. (b) Viability of HEK293T cells after 4 days expressing LINE-1 or a mutant at increasing doxycycline doses. A multivariate ANOVA (Viability ~ ORF2 * doxycycline) was performed in R to calculate p values for ORF2 mutant status and doxycycline dose. Tests of viability differences among ORF2 mutants were further performed using two-sided T tests at the 1000 ng/ml doxycycline dose. N=6 replicates per doxycycline dose. (c) Western blot of ORF1p and ORF2p 24 hours after inducing protein expression with 1000 ng/ml doxycycline.
Figure 1.
Figure 1.. Heterogeneous LINE-1 expression in colon cancer.
(a) ORF1p immunohistochemistry stain of formalin-fixed paraffin-embedded (FFPE) colon cancer tissue. LINE-1 immunostaining is seen in tumor (T) and not in normal colonic epithelium (N). The arrow indicates a transition from normal to tumor within a gland. Scale bar = 50 μm. (b) Immunohistochemistry stain of FFPE colon cancer tissue from patient case 191. Left, low magnification of ORF1p intensely-positive and negative tumor sectors. Right, low magnification of CDX2, a colon epithelium marker. LINE-1(+) cells express higher CDX2 and are gland-forming whereas LINE-1(−) cells express lower CDX2 and do not form glands. Scale bars = 500 μm. (c) Phylogenetic tree of the tumor subclones in case 191 based on TIP-seq and known tumor driver alleles. The number of de novo LINE insertions is indicated along the line edges (red). We genotyped by Sanger sequencing known tumor driver alleles and found an AKT1E17K mutation in the CDX2-dim cells and a TP53R248Q mutation in CDX2-high cells (both primary and metastatic sites). All tumor specimens possessed a BRAFV600E allele regardless of LINE-1 expression status. The color of the lines indicates the presence or absence of known tumor driver alleles. (d) Ki67 quantification of normal epithelium, LINE-1(+) glandular cancer, and LINE-1(−) solid cancer in case 191. The percent of positive cells was calculated as the number of Ki67+ nuclei divided by the total number of epithelial cell nuclei. Three independent high-powered fields were counted per tissue morphology, and results were compared with ANOVA and two-sided T tests. Scale bar = 100 μm.
Figure 2.
Figure 2.. LINE-1 inhibits cell growth in RPE by activating the p53-p21 pathway.
(a) LINE-1 sequence. The 5’ untranslated region (UTR) is a CpG-rich RNA polymerase II promoter. Open reading frame (ORF) 1 and ORF2 are separated by a 63 bp linker sequence. ORF2 has endonuclease (EN, red) and reverse transcriptase (RT, gray) domains. (b) Above, episomal pCEP4 mammalian expression vector for eGFP (pDA083) or LINE-1 (pDA077). AbxR = antibiotic selection marker, EBNA1 = Epstein-Barr Nuclear Antigen 1, oriP = EBNA-1 replication origin. Below, western blot of ORF1p and ORF2p from RPE cells transfected with each plasmid. Uncropped blot is shown in Supplementary Data 1. (c) Clonogenic assay (day 12). Cells are transfected with eGFP (pDA083) or LINE-1 (pDA077). Representative plates with number of colonies indicated ± SD. Quantification to the right is normalized to eGFP-expressing cells set at 100%, with n=3 independent experiments. P value calculated by two-sided unpaired T test. (d) Clonogenic assay (day 12). Cells are treated with lentivirus encoding TP53 shRNA (+) or control vector (−). Data presented as the rate of LINE-1 per 100 eGFP colonies ± SEM, n=3 independent experiments. P value obtained by unpaired two-sided T test. (e) Positive Selection CRISPR-Cas9 knockout screen workflow using the Brunello CRISPR knockout library. RPE-Cas9 = RPE cells constitutively expressing Cas9 protein. KO = knockout. sgRNA = single-guide RNA. NGS = Next-Generation Sequencing. NTC = Non-targeting-control. (f) Screen enrichment rank vs. significance values of gene knockouts that rescue growth of LINE-1(+) cells. The red line is the FWER-adjusted genome-wide significance level. Low ranks indicate rescue of LINE-1(+) cells. (g) CRISPR knockout of TP53 or CDKN1A significantly rescue growth of RPE compared to non-targeting-control (NTC). Representative plates with all data presented as LINE-1 / 100 eGFP colonies ± SEM. n=2 biological replicates. P value obtained by unpaired one-sided T test.
Figure 3.
Figure 3.. LINE-1 activates a p53 and IFN response.
(a) Left: Volcano plot of differentially expressed genes. Vertical dashed lines indicate fold-change of −1 or 1 (log2) and the horizontal dashed line indicates a FWER-controlled p-value of 0.05. Right: histograms of gene set enrichment analysis results. Gene set names are indicated above each plot. The number of genes is indicated on the y-axis and the x-axis indicates differential expression bins. Individual genes comprising these datasets are highlighted in the volcano plot according to the colors of the bars in the histograms. Data derived from n=3 independent replicates. (b) Violin plots illustrating differential expression of p53 transcriptional targets. Direct and indirect target genes are curated from published reports (see Methods References). Horizontal bars mark median values. The number of genes in each group are indicated below the plot. (c) Histogram of gene set enrichment results of interferon (IFN) signaling genes. The number of genes is indicated on the y-axis and the x-axis indicates differential expression. (d) Relative fold-change of interferon B1 (IFNB1) and A1 (IFNA1) in LINE-1(+) compared to luciferase(+) cells measured by RNAseq. Error bars indicate SEM. (e) RNAseq analysis revealed upregulation of the RNA sensing pathway involving Toll-like receptor 3 (TLR3), RIG-I (DDX58), and MDA5 (IFIH1) in LINE-1(+) cells. Error bars indicate SEM.
Figure 4.
Figure 4.. Mapping LINE-1 fitness interactions in TP53-deficient cells.
(a) TP53KD cells are RPE-Cas9 cells stably transduced with shRNA to knockdown p53 and then engineered to express luciferase (pDA094) or codon-optimized LINE-1 (pDA095) in a doxycycline-inducible manner (Tet-On). Tet-On cells were transduced with the Brunello CRISPR KO library at a multiplicity of infection of 0.3 and puromycin-selected for 8 days before inducing expression of LINE-1 or luciferase for 27 days. Cell pools were sampled at 4-5 day intervals and analyzed for sgRNA representation with MAGeCK. Count data are normalized to reads that align to 1,000 built-in non-targeting-control (NTC) sgRNAs (black). NGS = Next Generation Sequencing. KO = Knockout. (b) Genes shown as rank ordered plot of Stauffer Z scores (Zs) with a family-wise error rate (FWER) of 0.05. Inset indicates the number of 95% confidence interval overlaps over all time points between LINE-1 and luciferase groups among gene knockouts that meet the FWER threshold (red) versus those that do not (gray). (c) Heatmap of 1,390 significant genes depicting the Z scores over time, ranked by Zs. There are 1,366 synthetic lethal interactions and 24 rescue interactions. Most knockouts achieved detectable effects by 17-22 days into the screen, evidenced by increasing gene Z scores during these time points. (d) Overlap of genes with LINE-1 fitness interactions observed in the present study with genes previously known to interact with LINE-1 proteins physically or by modifying retrotransposition. Previously known LINE-1 interactors were identified by Liu et al., 2018, Moldovan et al., 2015, Taylor et al., 2013, and Goodier et al., 2013.
Figure 5.
Figure 5.. The Fanconi Anemia (FA) pathway is essential in p53-deficient cells.
(a) Network of 75 DNA repair genes identified in the screen is enriched for Fanconi anemia genes (blue nodes). Edges indicate known physical interactions. (b) Model of FA complexes responding to a DNA lesion (vertical line) encountered by a replication fork (blue line, genomic DNA; green line, nascent DNA). Genes are color coded based on the performance of their knockouts. (c) Western blot of FANCD2 response to 24-hour treatment with 1 μg/ml mitomycin C (MMC). Cells are treated with FA member sgRNAs or non-targeting-control (NTC). FANCD2 monoubiquitination assessed as the ratio of FANCD2-L (long) to FANCD2-S (short) band intensities (relative L:S ratio) graphed relative to NTC, MMC-treated cells. nd = not determined. (d) Clonogenic growth assay of LINE-1(+) RPE cells with sgRNAs targeting the same genes as in (C). n=3 independent experiments. P value calculated with a one-sided T test. (e) Representative western blot of FANCD2 and FANCI following 72 hour expression of LINE-1 or luciferase in RPE. MMC treatment reveals L (monoubiquitinated) and S (non-ubiquitinated) protein bands. Quantification at right of n=2 independent experiments ± SEM.. (f) Representative western blot of FANCD2 following 72 hour expression of wildtype or mutant LINE-1 in HeLa cells. Quantification below of n=2 independent experiments ± SEM. Effect of wildtype LINE-1 as assessed by ANOVA (p = 0.0143). (g) Left, representative images of FANCD2 foci (green) in EdU+ nuclei. Scale bar = 6 μm. Right, quantification of FANCD2 foci in EdU+ HeLa cells. Number of cells per group: untreated, n=134; HU, n=105; wildtype, n=109; RT (D702Y), n=101. HU = hydroxyurea. RT = reverse transcriptase. ns = not significant. (h) Left, γH2A.X and 53BP1 focus quantification in EdU+ TP53KD cells. Number of cells per group: Lucif., n=326; LINE-1, n=358; doxorubicin, n=431. Two-sided T tests were used for statistical comparisons in panels g and h. Right, representative images of γH2A.X (red), 53BP1 (green), EdU (cyan), and DAPI (blue). Scale bar = 12 μm. Uncropped blot images of panels c, e and f are shown in Supplementary Data 1.
Figure 6.
Figure 6.. LINE-1 activity induces replication stress.
(a) Median count of sgRNAs targeting replication stress signaling genes ATRIP and the 9-1-1 complex (HUS1 and RAD1) during the screen. Error bars indicate 95% confidence intervals. (b) Clonogenic assay of LINE-1(+) RPE cells (induced with 1 μg/ml doxycycline) with CRISPR-knockout of ATRIP compared to non-targeting-control (NTC). Error bars indicate SEM, n=3 independent experiments. P value is calculated with an unpaired two-sided T test. (c) Clonogenic assay of LINE-1(+) RPE cells (induced with 1 μg/ml doxycycline) with drug inhibition of ATR kinase by 1 μM VE-821 compared to vehicle (DMSO). Error bars indicate SEM, n=3 independent experiments. P value is calculated with an unpaired two-sided T test. (d) Western blot of RPA2 occupancy on chromatin induced by LINE-1 compared to luciferase control after 72 hours of expression in RPE. Chromatin-bound protein lysates were used. 1 μM MMC was used as a control to verify that these cells respond to replication stress. (e) Western blot of p-RPA S4/S8 after 72 hours of wildtype or mutant LINE-1 expression in HeLa cells. Relative signal intensity for n=2 independent experiments ±SEM is quantified. 1 μM MMC was used as a replication stress control and produces a gel shift in total RPA2 that is more subtly produced by WT LINE-1, which is the the hyperphosphorylated protein. Statistical significance is assessed by ANOVA (p = 0.0007). (f) MMC dose-response clonogenic assay of LINE-1(+) cells or control. Molar concentration indicated on x-axis. Data are plotted as the mean viability relative to 100 pM ±SD, n=3 independent experiments. Two-sided T tests were used to compare relative viability at each dose. (g) Median count of sgRNAs targeting fork protection (RADX) and fork restart (BLM, WRN, WRNIP1) genes. Median values are depicted with 95% Confidence Intervals. Uncropped blot images of panels d and e are shown in Supplementary Data 1.
Figure 7.
Figure 7.. Model of LINE-1-induced replication stress.
Collision of a replication fork, comprised of genomic DNA (dark blue) and newly synthesized DNA (green), with a LINE-1 insertion intermediate—an RNA:DNA hybrid made of LINE-1 mRNA (red) and LINE-1 cDNA (green). The LINE-1 insertion intermediate is recognized by the Fanconi Anemia pathway core complex and recruits and activates FANCD2 and FANCI, which are then monoubiquitinated. The stalled fork leads to an accumulation of RPA, which recruits ATR-ATRIP and the 9-1-1 (RAD9-HUS1-RAD1) complex, key replication stress signaling proteins. These coordinate the cell response to the replication stress, including phosphorylation of RPA. Failure to resolve this collision reduces cell fitness. A similar conflict could occur upstream of the lagging strand as well.

References

    1. Mathias SL, Scott AF, Kazazian HH Jr., Boeke JD & Gabriel A Reverse transcriptase encoded by a human transposable element. Science 254, 1808–10 (1991). - PubMed
    1. Feng Q, Moran JV, Kazazian HH Jr. & Boeke JD Human L1 retrotransposon encodes a conserved endonuclease required for retrotransposition. Cell 87, 905–16 (1996). - PubMed
    1. Hohjoh H & Singer MF Cytoplasmic ribonucleoprotein complexes containing human LINE-1 protein and RNA. EMBO J 15, 630–9 (1996). - PMC - PubMed
    1. Woodcock DM, Lawler CB, Linsenmeyer ME, Doherty JP & Warren WD Asymmetric methylation in the hypermethylated CpG promoter region of the human L1 retrotransposon. J Biol Chem 272, 7810–6 (1997). - PubMed
    1. Liu N et al. Selective silencing of euchromatic L1s revealed by genome-wide screens for L1 regulators. Nature 553, 228–232 (2018). - PMC - PubMed

Methods-only References

    1. Lambrus BG et al. A USP28-53BP1-p53-p21 signaling axis arrests growth after centrosome loss or prolonged mitosis. J Cell Biol 214, 143–53 (2016). - PMC - PubMed
    1. Lambrus BG et al. p53 protects against genome instability following centriole duplication failure. J Cell Biol 210, 63–77 (2015). - PMC - PubMed
    1. Grabundzija I et al. Comparative analysis of transposable element vector systems in human cells. Mol Ther 18, 1200–9 (2010). - PMC - PubMed
    1. Doench JG et al. Optimized sgRNA design to maximize activity and minimize off-target effects of CRISPR-Cas9. Nat Biotechnol 34, 184–191 (2016). - PMC - PubMed
    1. Langmead B, Trapnell C, Pop M & Salzberg SL Ultrafast and memory-efficient alignment of short DNA sequences to the human genome. Genome Biol 10, R25 (2009). - PMC - PubMed

Publication types