

doi: 10.1038/s41593-020-0588-8.
Epub 2020 Feb 10.
Myelin degeneration and diminished myelin renewal contribute to age-related deficits in memory
Affiliations
- PMID: 32042174
- PMCID: PMC7306053
- DOI: 10.1038/s41593-020-0588-8
Item in Clipboard
Myelin degeneration and diminished myelin renewal contribute to age-related deficits in memory
Nat Neurosci.
2020 Apr.
Abstract
Cognitive decline remains an unaddressed problem for the elderly. We show that myelination is highly active in young mice and greatly inhibited in aged mice, coinciding with spatial memory deficits. Inhibiting myelination by deletion of Olig2 in oligodendrocyte precursor cells impairs spatial memory in young mice, while enhancing myelination by deleting the muscarinic acetylcholine receptor 1 in oligodendrocyte precursor cells, or promoting oligodendroglial differentiation and myelination via clemastine treatment, rescues spatial memory decline during aging.
Conflict of interest statement
Competing interests
The authors declare no competing interests.
Figures
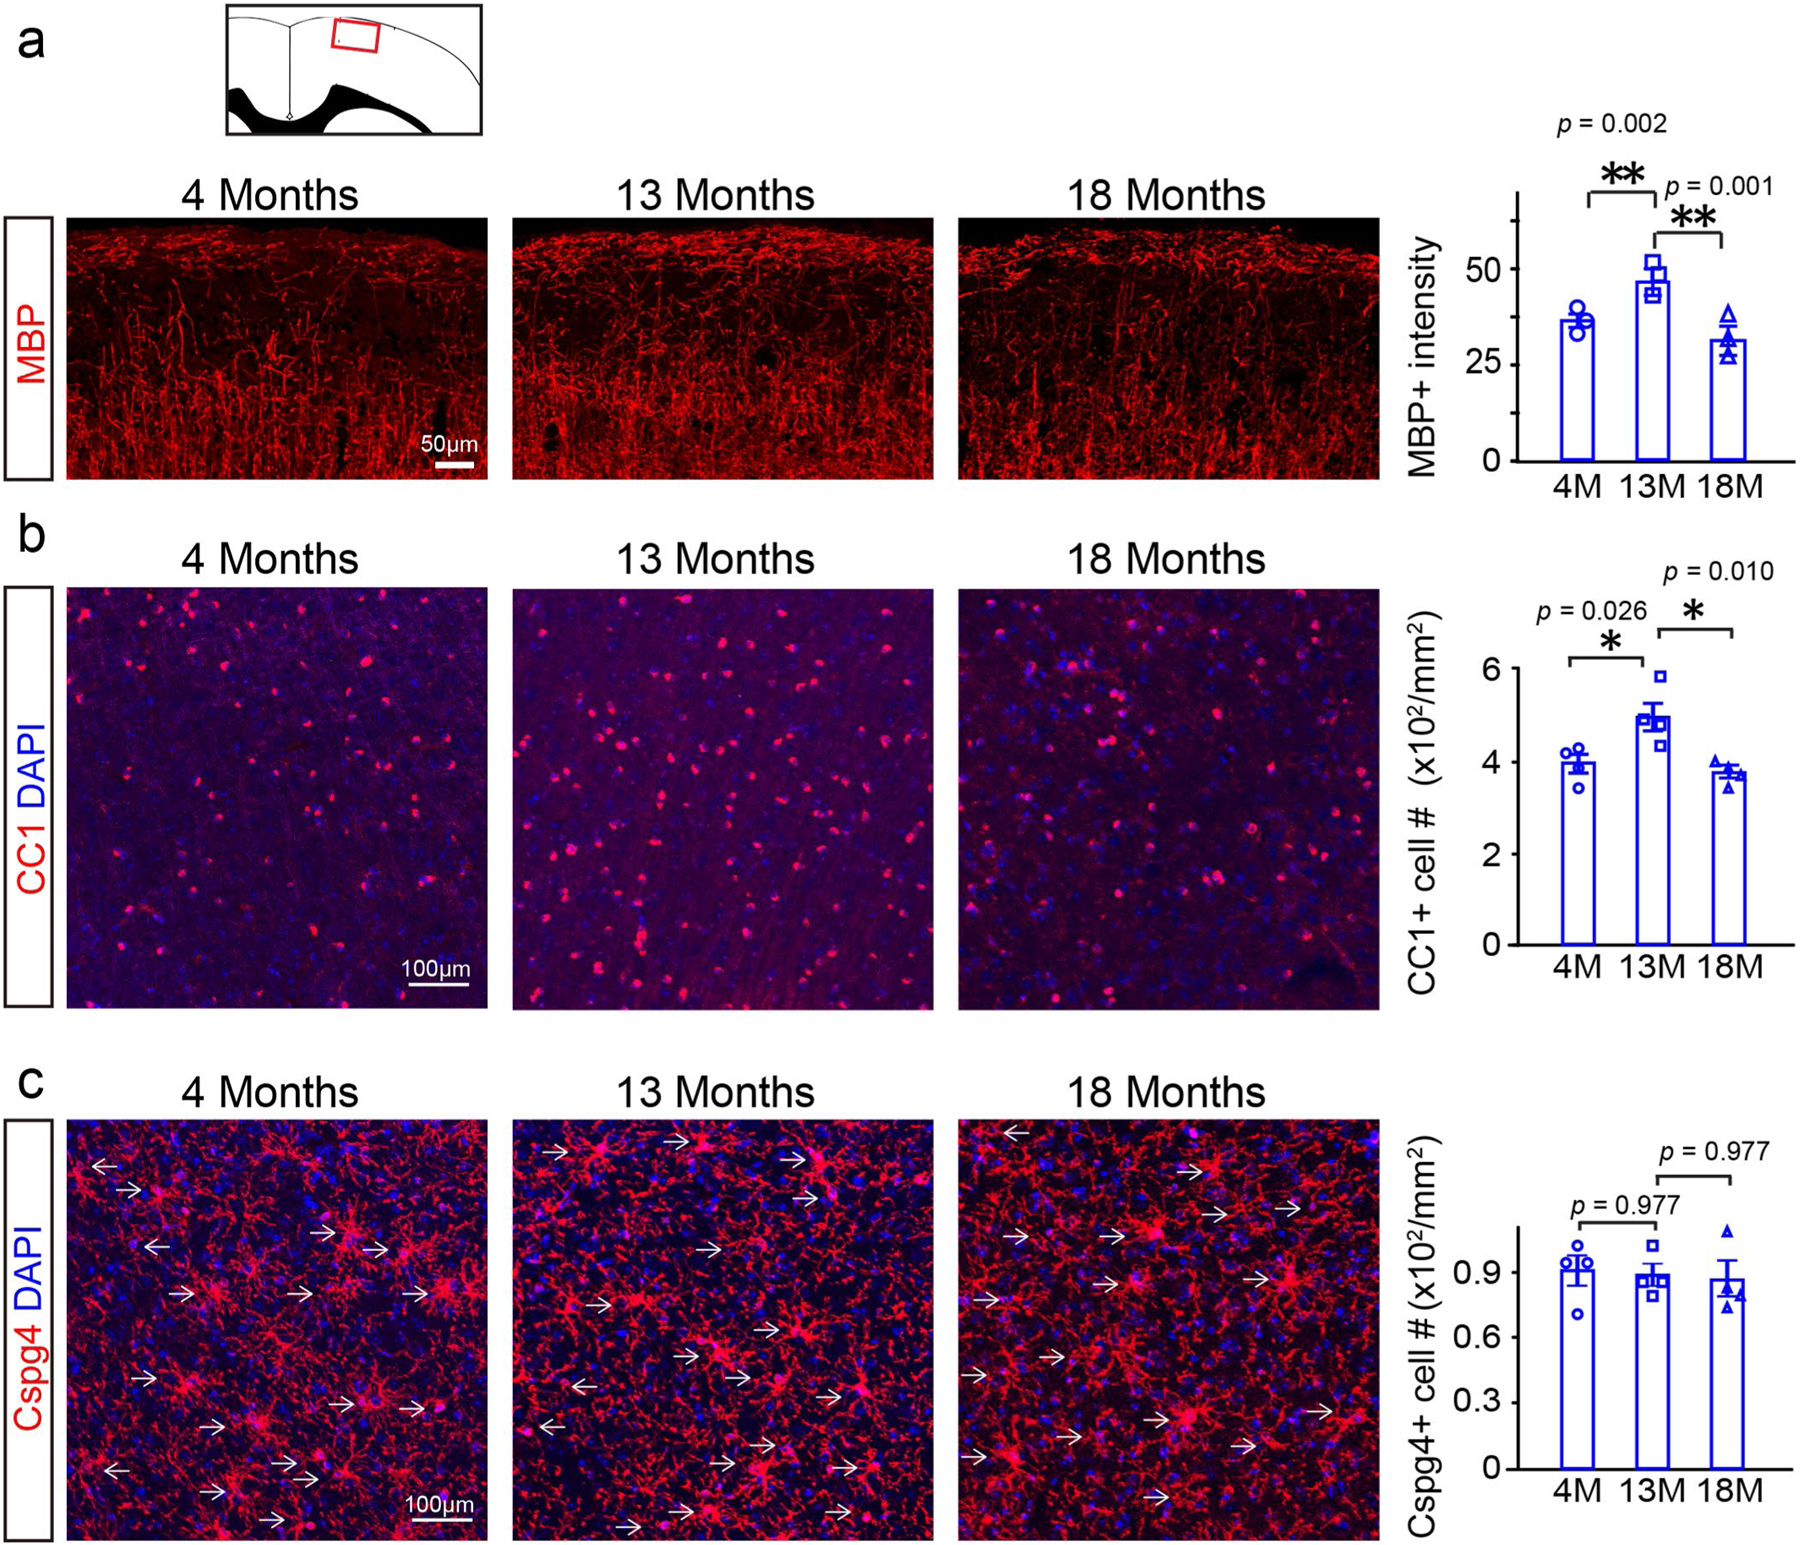
a, Representative images and quantification of mean MBP intensity, n = 3 biologically independent mice, one-way ANOVA followed by post hoc Tukey test was used (F(2,6) = 31.35, p < 0.001, TUKEY (4 M versus 13 M): p = 0.002, TUKEY (13 M versus 18 M): p = 0.001). Scale bar = 50 μm; b, Representative images and quantification of CC1 positive cells, n = 4 biologically independent mice, one-way ANOVA followed by post hoc Tukey test was used (F(2,9) = 8.466, p = 0.009, TUKEY (4 M versus 13 M): p = 0.026, TUKEY (13 M versus 18 M): p = 0.010), scale bar = 100 μm; c, Representative images and quantification of Cspg4 positive cells, n = 4 biologically independent mice, one-way ANOVA followed by post hoc Tukey test was used (F(2,9) = 0.086, p = 0.919), scale bar = 100 μm. Points represented individual animals. Error bars represent mean ± s.e.m. *p < 0.05, **p < 0.01.
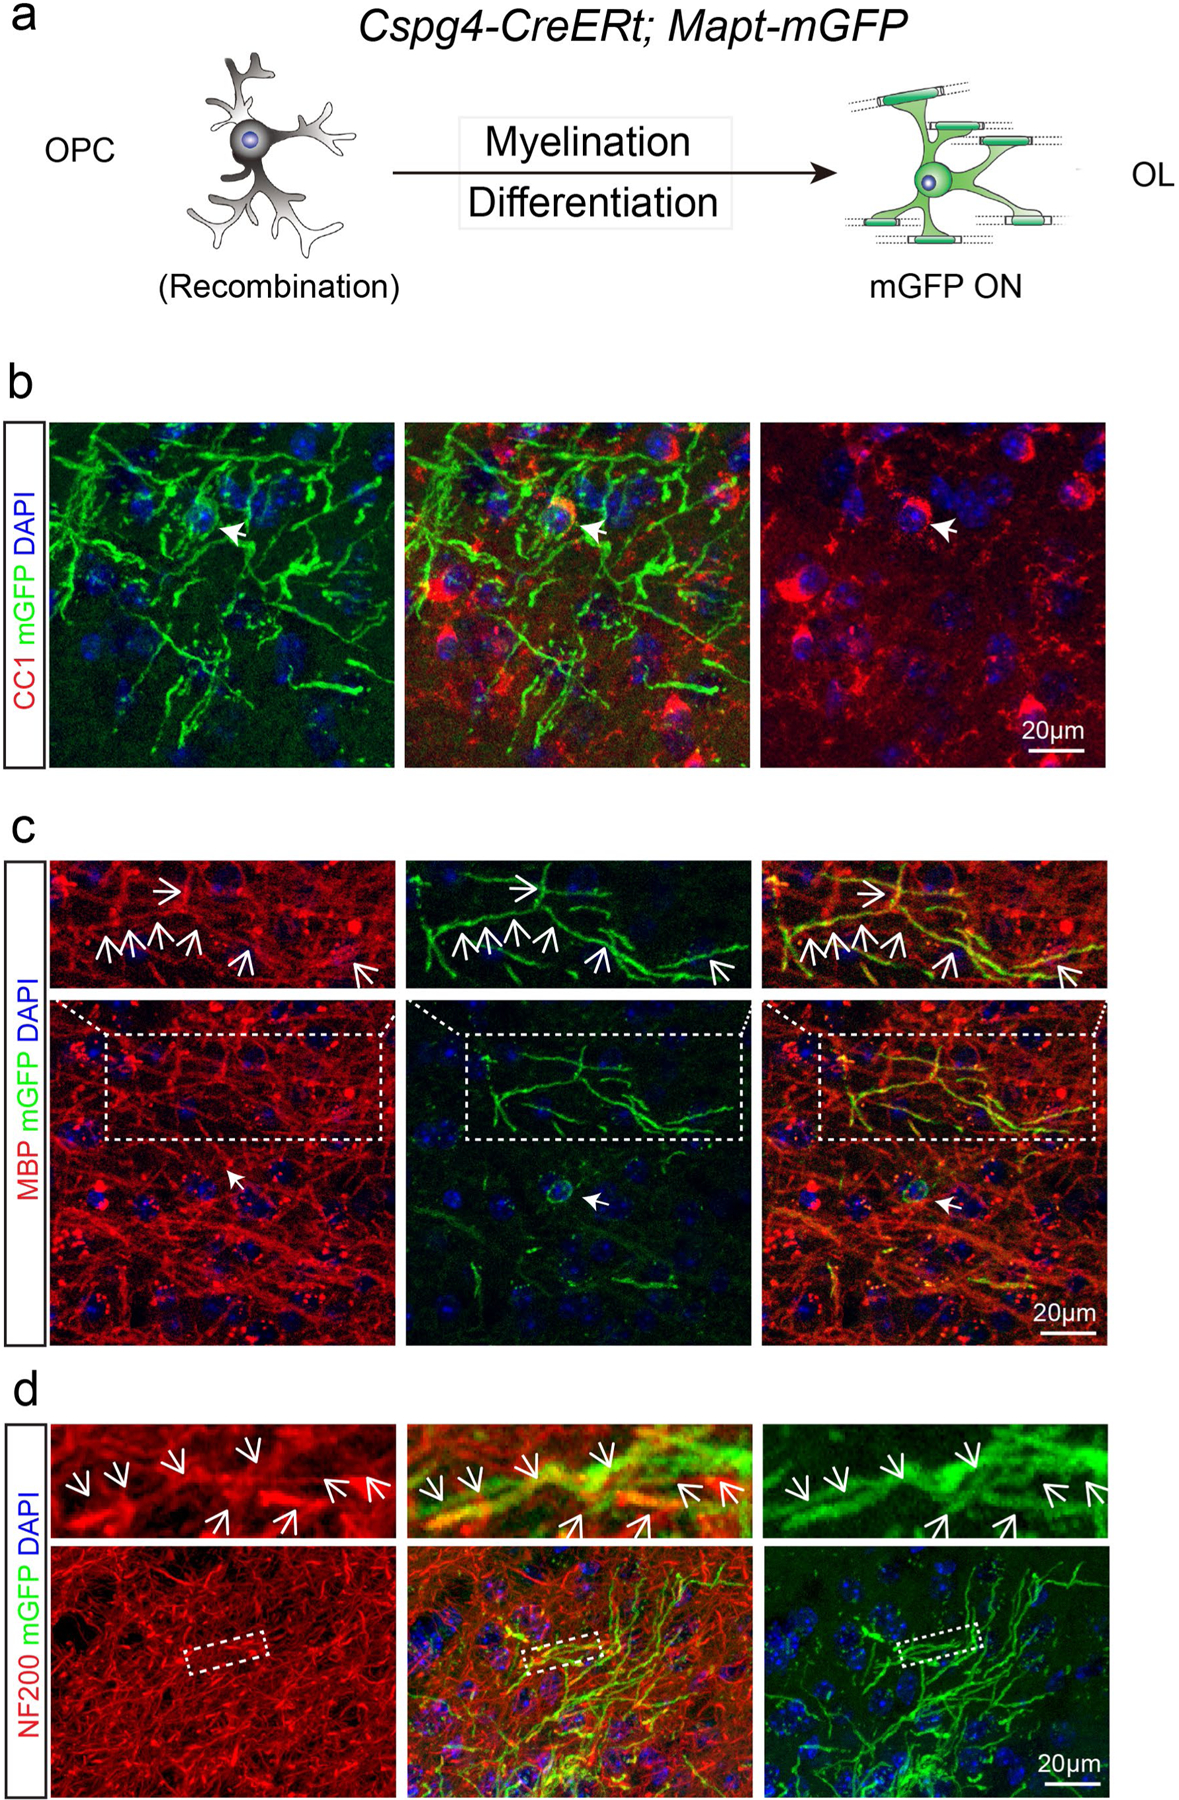
a, Schematic illustration showing mGFP expression in the Cspg4-CreERt; Mapt-mGFP mice; b–d, Immunostaining indicates that mGFP positive cell bodies are CC1 positive (b) and mGFP positive segments are co-localized with MBP (c) and associated with NF200 positive axons (d). These experiments were repeated 3 times independently with similar results, scale bar = 20 μm.
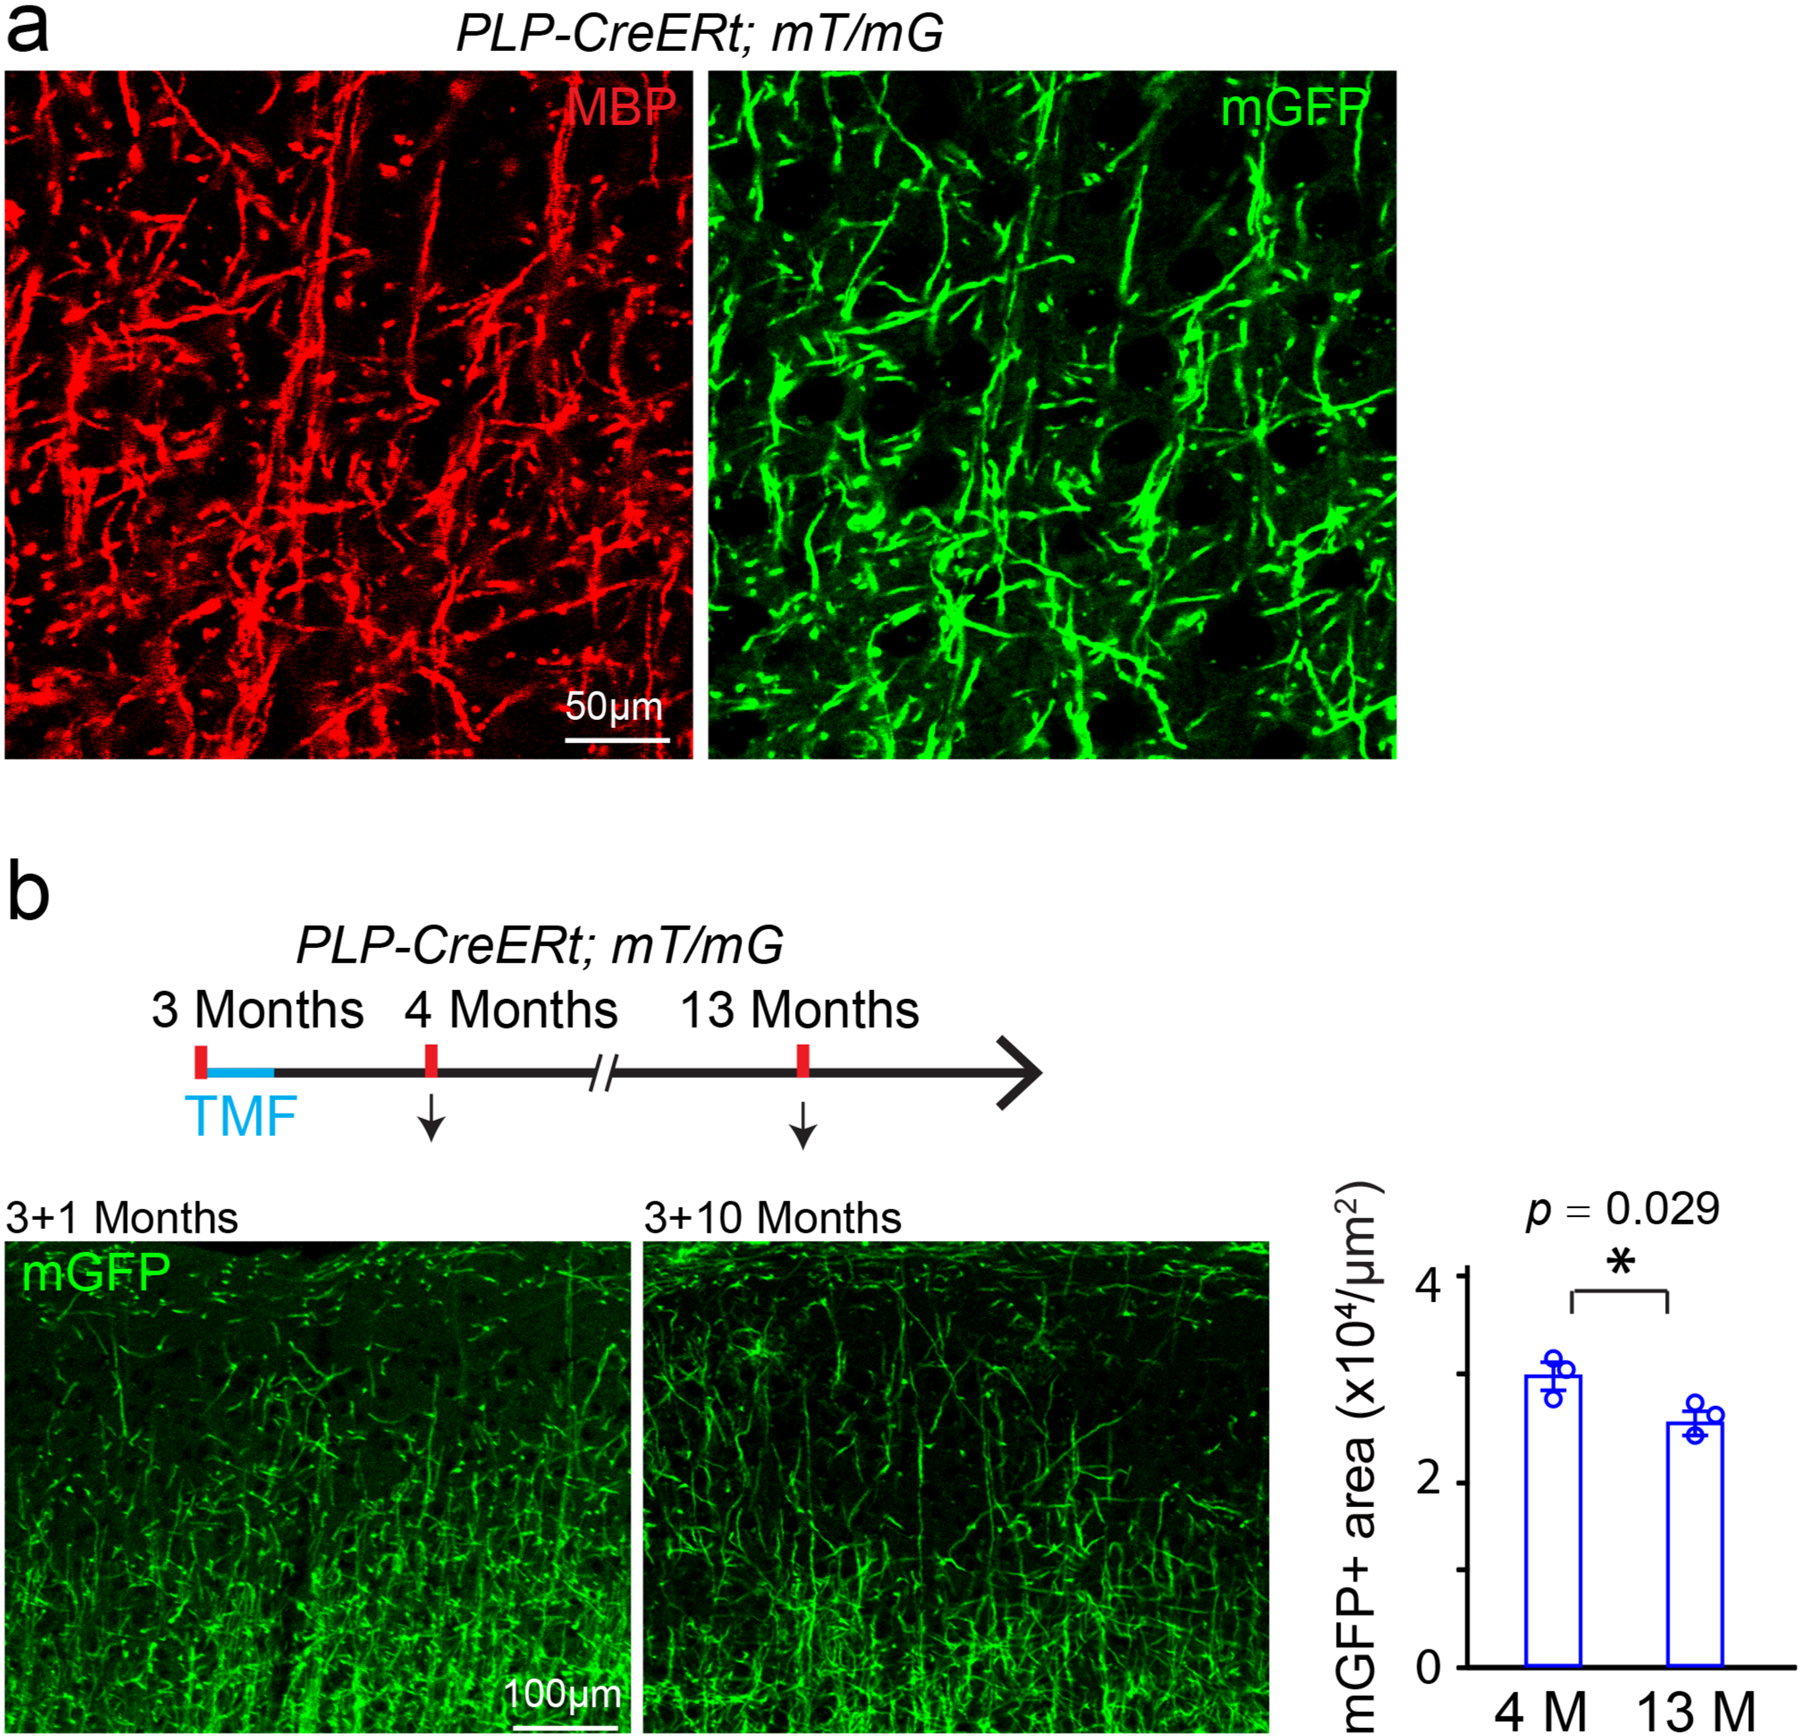
a, Representative image showing mGFP positive areas are co-localized with MBP positive myelin sheaths in the cortex of PLP-CreERt; mT/mG mice, 10 days after recombination at 3 months. These experiments were repeated 3 times independently with similar results. Scale bar = 50 μm; b, Schematic diagram displaying the time course of tamoxifen induction and histology, and representative images and quantification of the mGFP positive areas in the layers I-III of the cortex 1 or 10 months after recombination at 3 months. These experiments were repeated 3 times with similar results, n = 3 biologically independent mice for each group, two-tailed unpaired t test was used (t(4) = 3.327, p = 0.0292). Scale bar = 100 μm. Points represented individual animals. Error bars represent mean ± s.e.m. *p < 0.05.
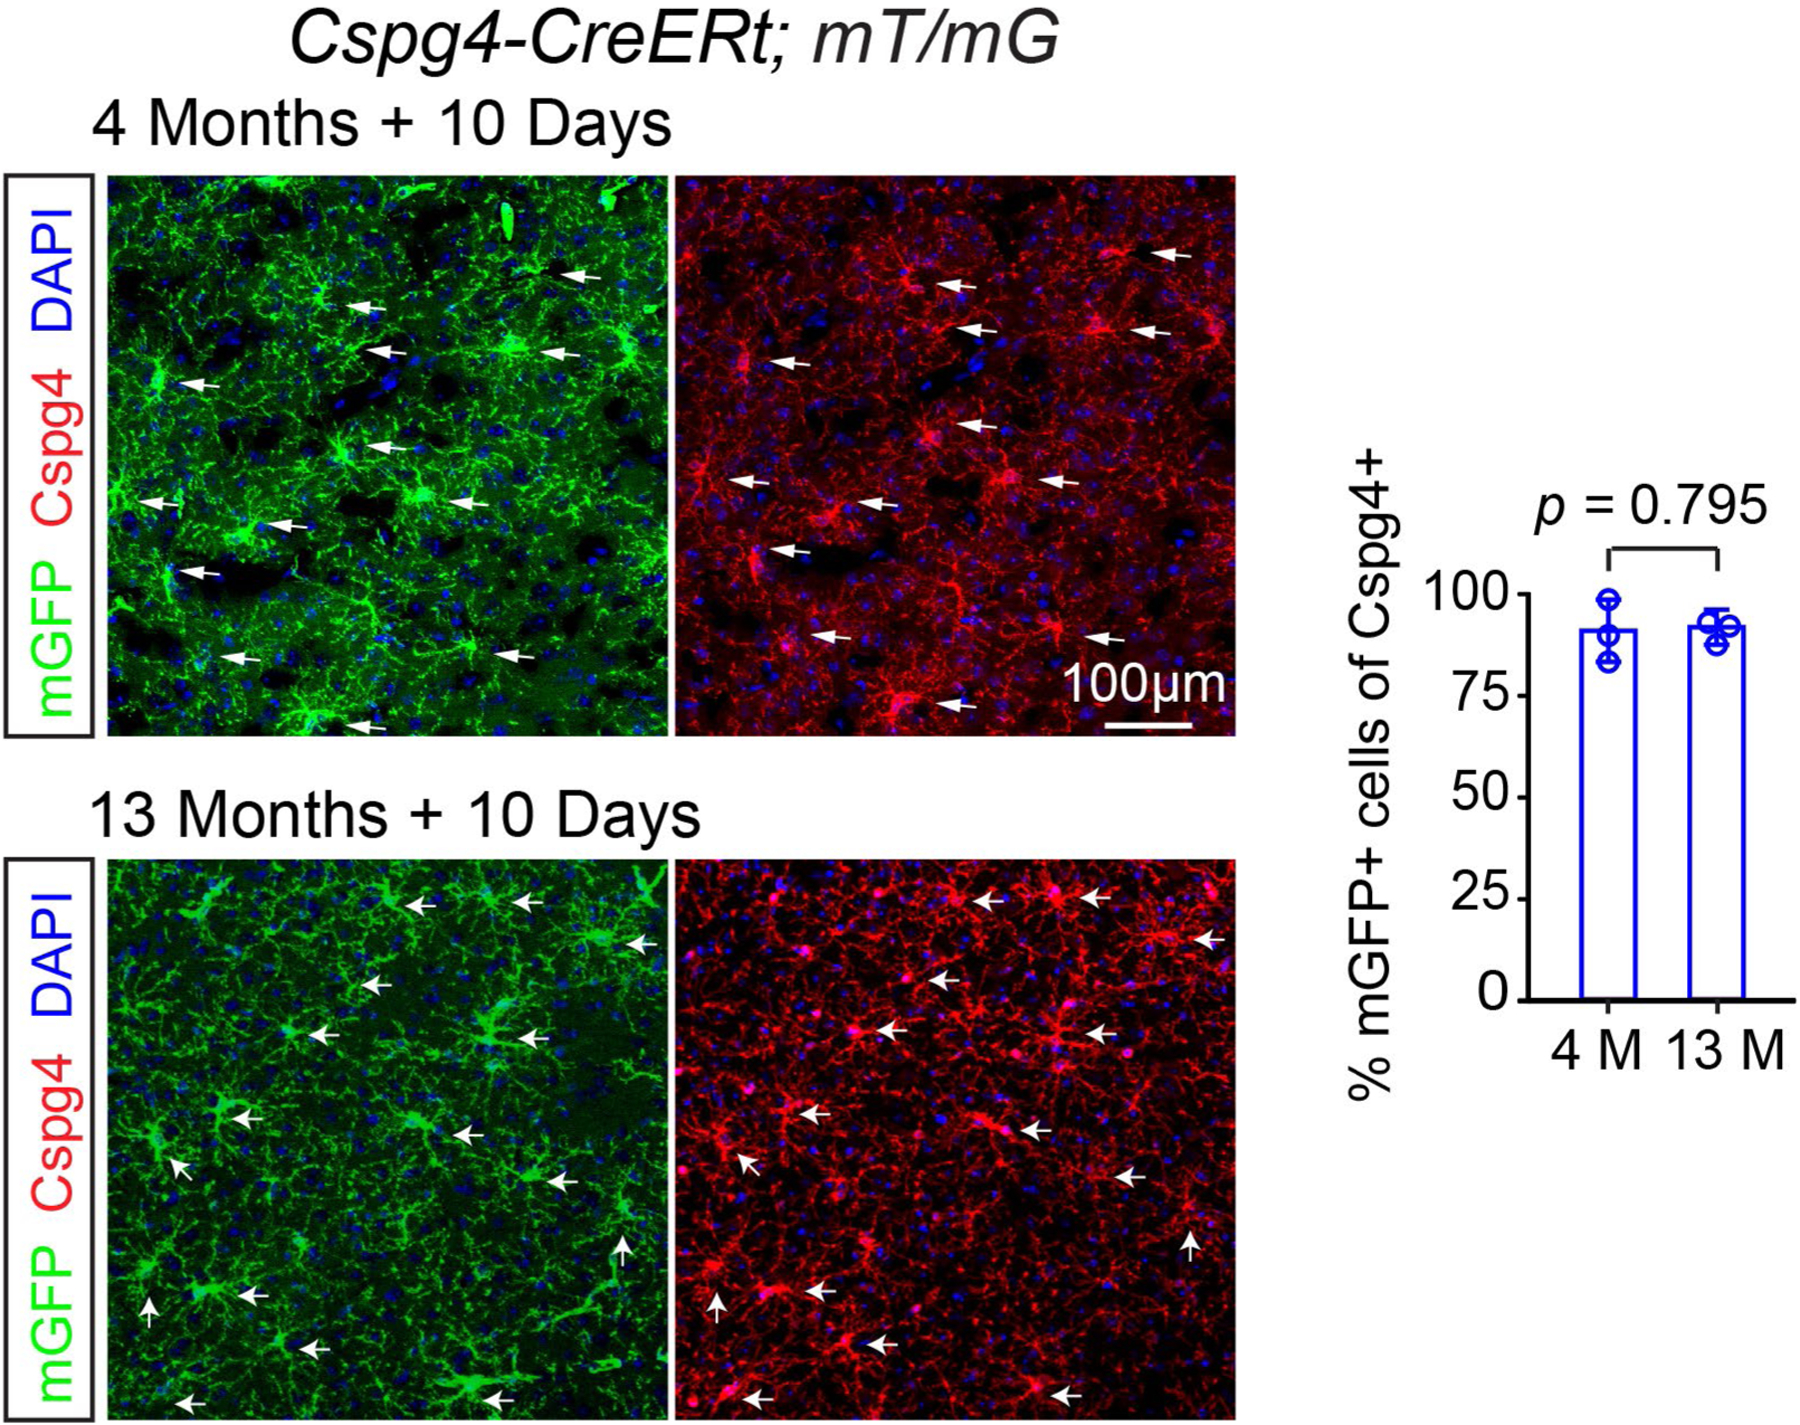
Representative images and quantification of the percentage of mGFP (green) positive cells in the Cspg4 (red) positive cells (OPCs) by immunostaining, 10 days after 4 consecutive days of tamoxifen treatment. Arrows indicating Cspg4/mGFP double positive cells, n = 3 biologically independent mice for each group, two-tailed unpaired t test was used (t(4) = 0.2774, p = 0.7953), scale bar = 100 μm. Points represented individual animals. Error bars represent mean ± s.e.m.
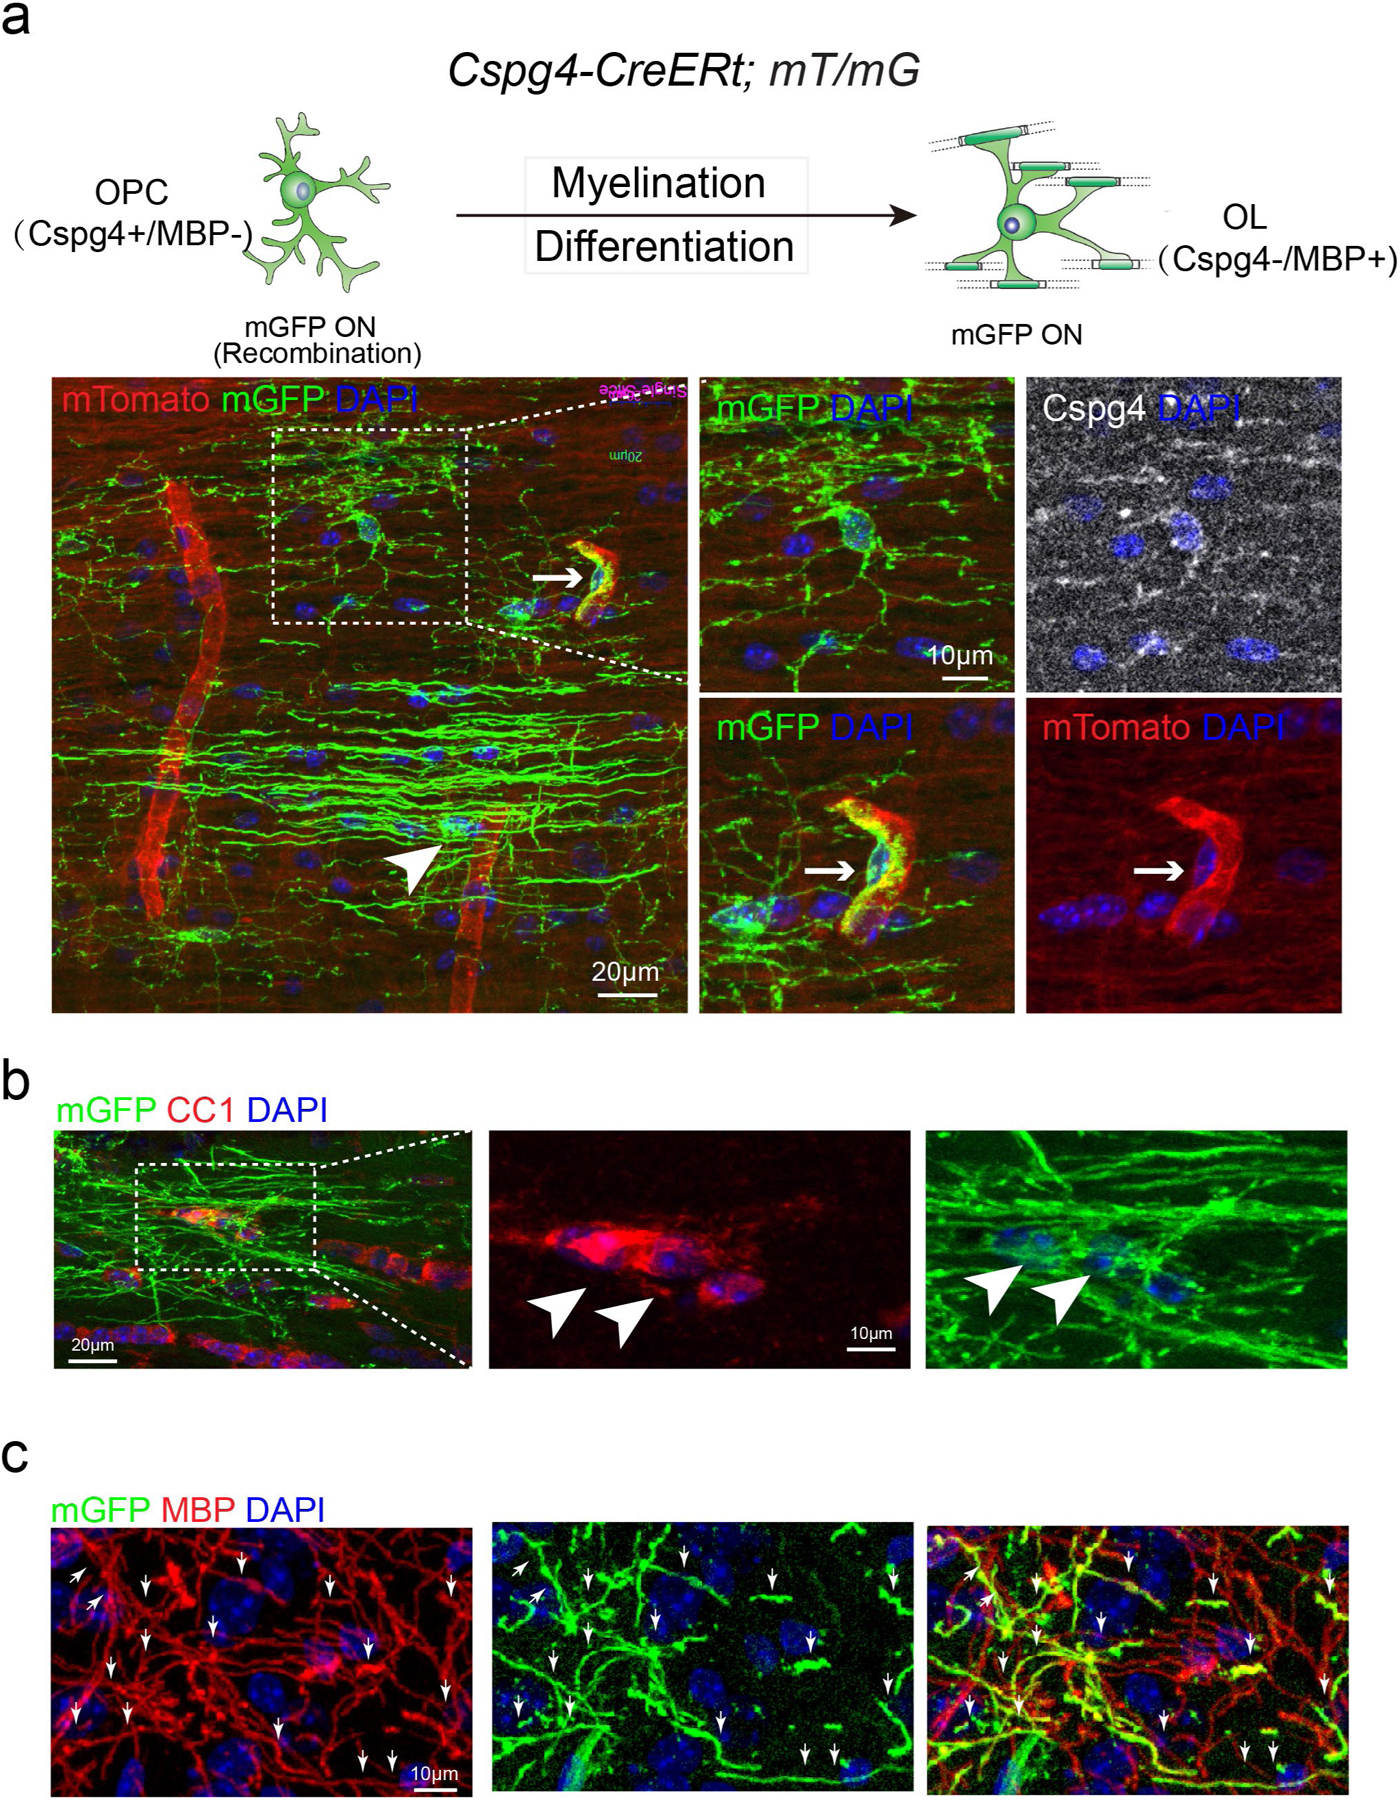
a, Schematic illustration showing the mGFP expression pattern in the Cspg4-CreERt; mT/mG mice and representative image showing mGFP (green)/Cspg4 (gray) double positive OPCs, putative mGFP positive OLs (arrowhead) and mGFP (green)/mTomato (red) double positive pericytes and blood vessels (right lower panels, arrows), Scale bar: 20 μm; b, Immunostaining showing mGFP (green)/CC1 (red) double positive OLs (arrowheads), Scale bar: 20 μm (left panel); 10 μm (middle and right panel); c, mGFP (green)/MBP (red) double positive myelin sheaths (arrows), sale bar = 10 μm. These experiments were repeated 3 times independently with similar results.
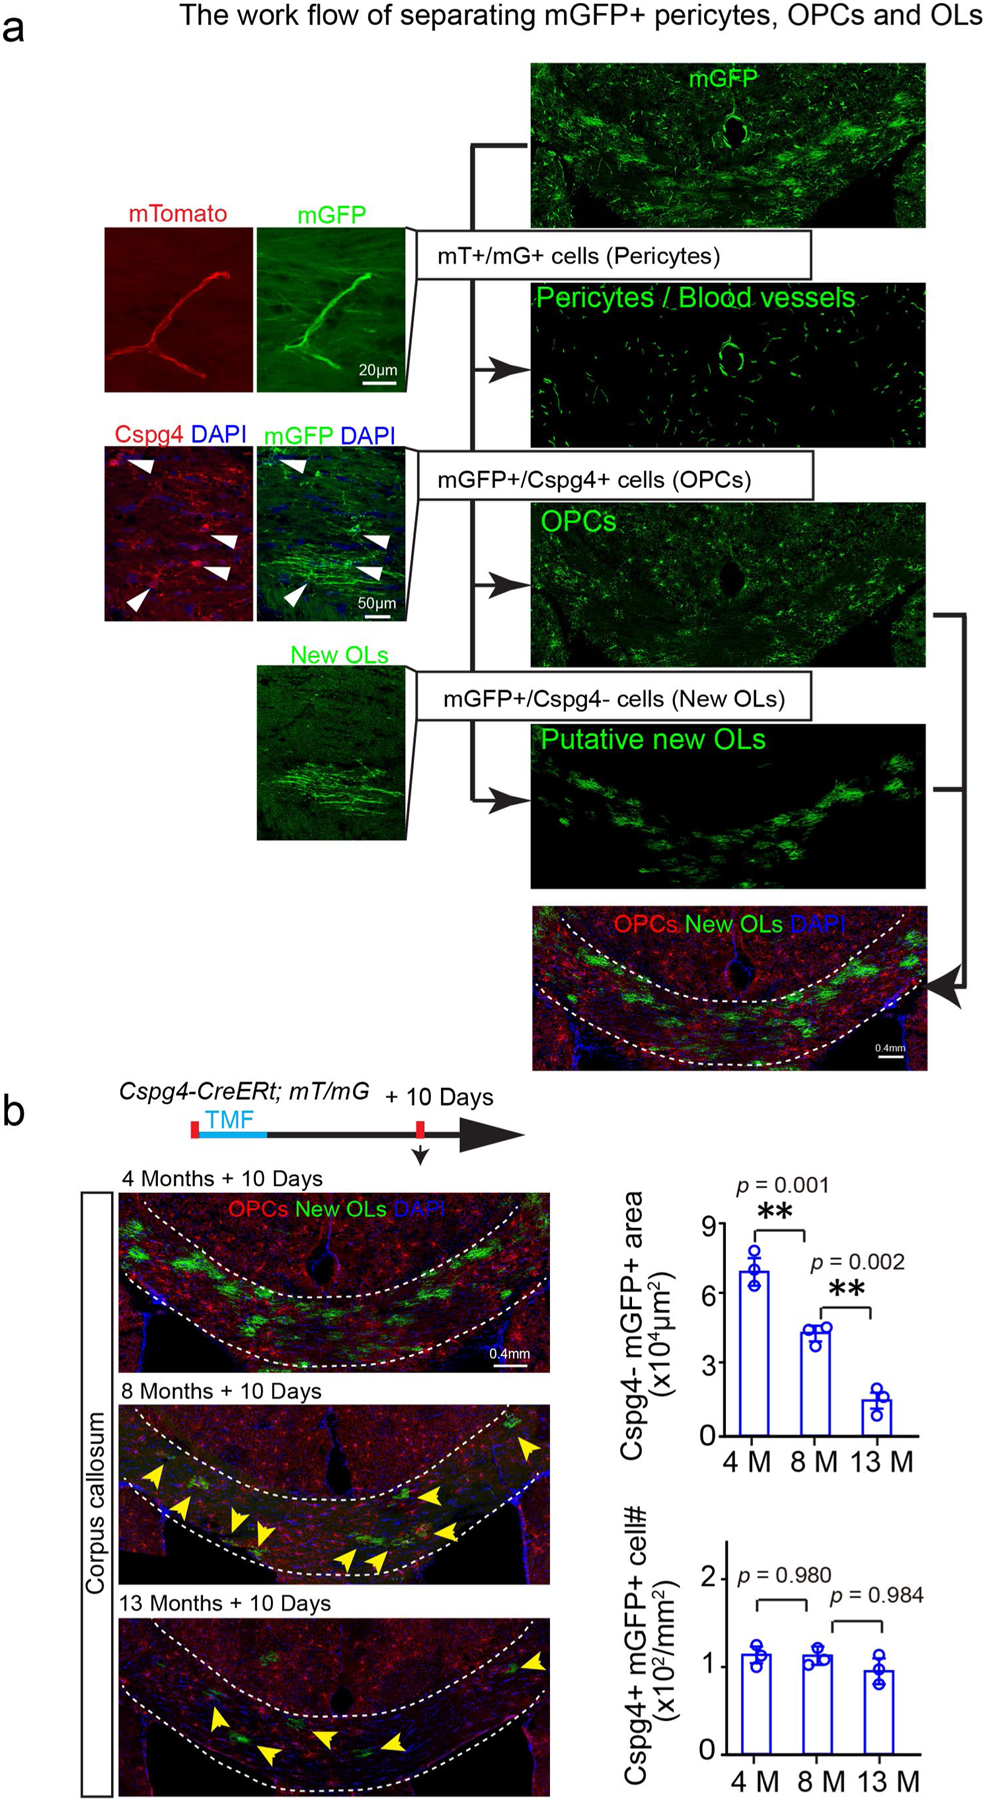
a, The blood vessels (red) /pericytes (green) (mT/mG double positive) are segregated and deducted from the mGFP channel, and the Cspg4 (red)/mGFP (green) double positive OPCs are pseudo-colored in red, Cspg4 immunostaining in Cspg4-CreERt; The experiments were repeated 3 times independently with similar results. Scale bar: 20μm (left panels on the top); 50μm (left panels on the bottom); 0.4 mm (right panels); b, Schematic diagram displaying the time course of tamoxifen induction and histology in the Cspg4-CreERt; mT/mG mice, and representative images of Cspg4 + /mGFP + OPCs (red) and Cspg4-/mGFP + new OLs (green, arrows) in the corpus callosum at 4-, 8- and 13 months, 10 days after induction and quantification of Cspg4 + /mGFP + OPC density and Cspg4-/mGFP + new myelin area, n = 3 biologically independent mice for each group, one-way ANOVA was used followed by post hoc Tukey test (Cspg4-/mGFP+area: F(2,6) = 97.587, p < 0.001, TUKEY (4 M versus 13 M): p = 0.001, TUKEY (8 M versus 13 M): p = 0.010; Cspg4+/mGFP+cell: F(2,6) = 0.066, p = 0.937). Scale bar = 0.4 mm. Points represented individual animals. Error bars represent mean ± s.e.m. **p < 0.01.
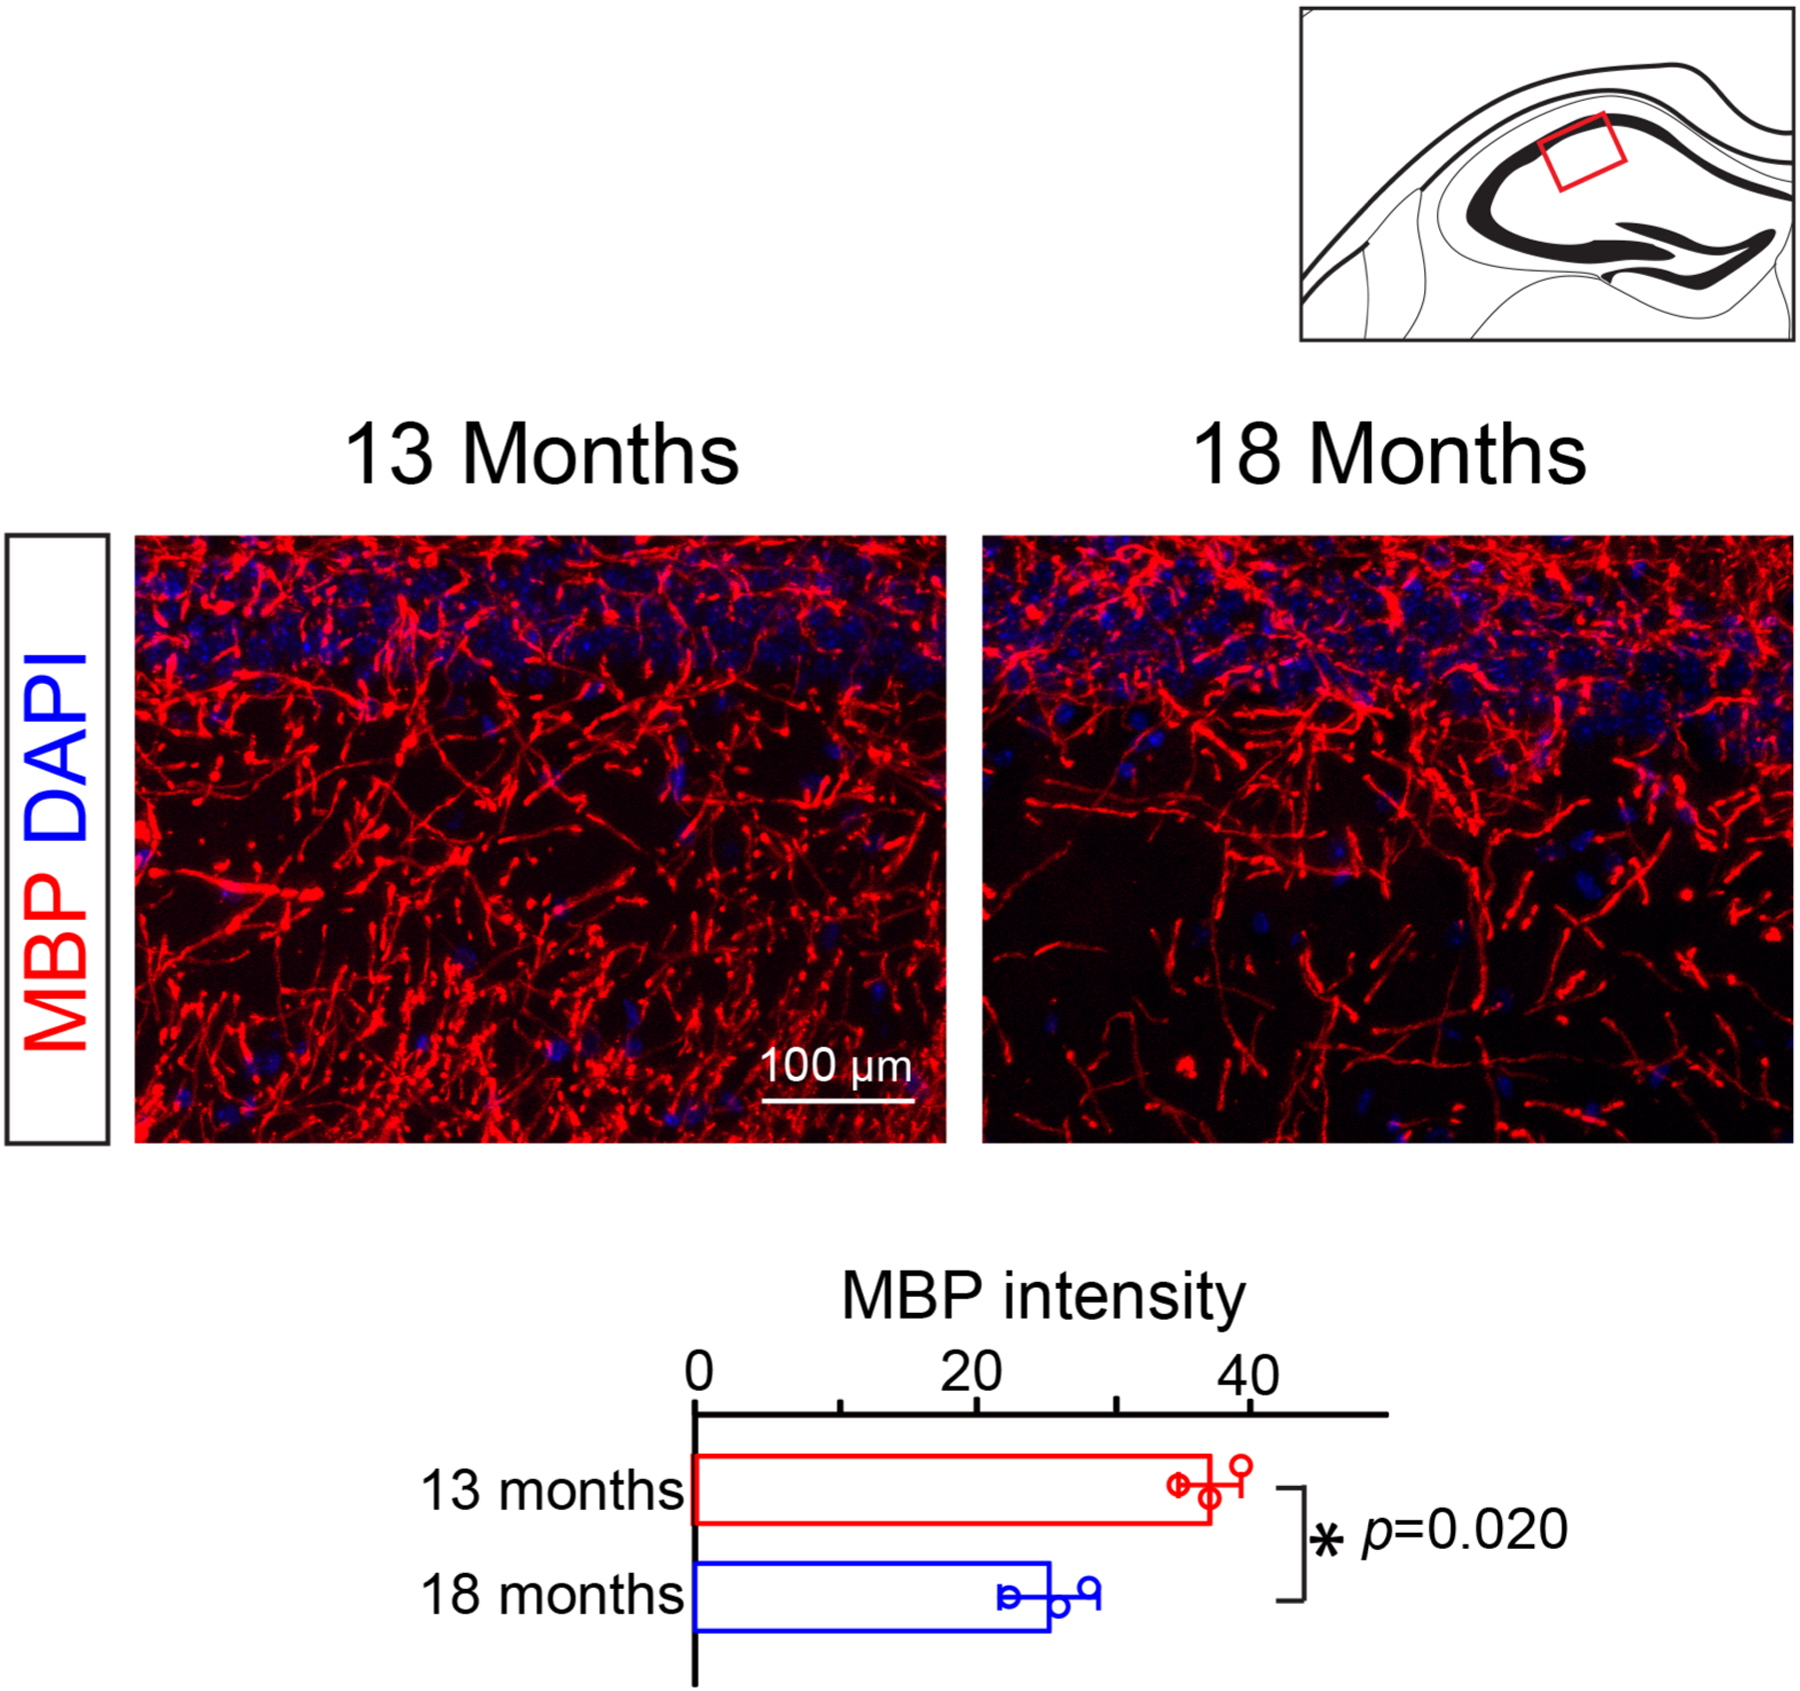
Representative images and quantification of mean MBP intensity in the CA2 region of the hippocampus. N = 3 biologically independent mice for each group, two-tailed unpaired t test was used (t(4) = 3.730, p = 0.0203). Scale bar = 100 μm. Points represented individual animals. Error bars represent mean ± s.e.m. *p < 0.05.
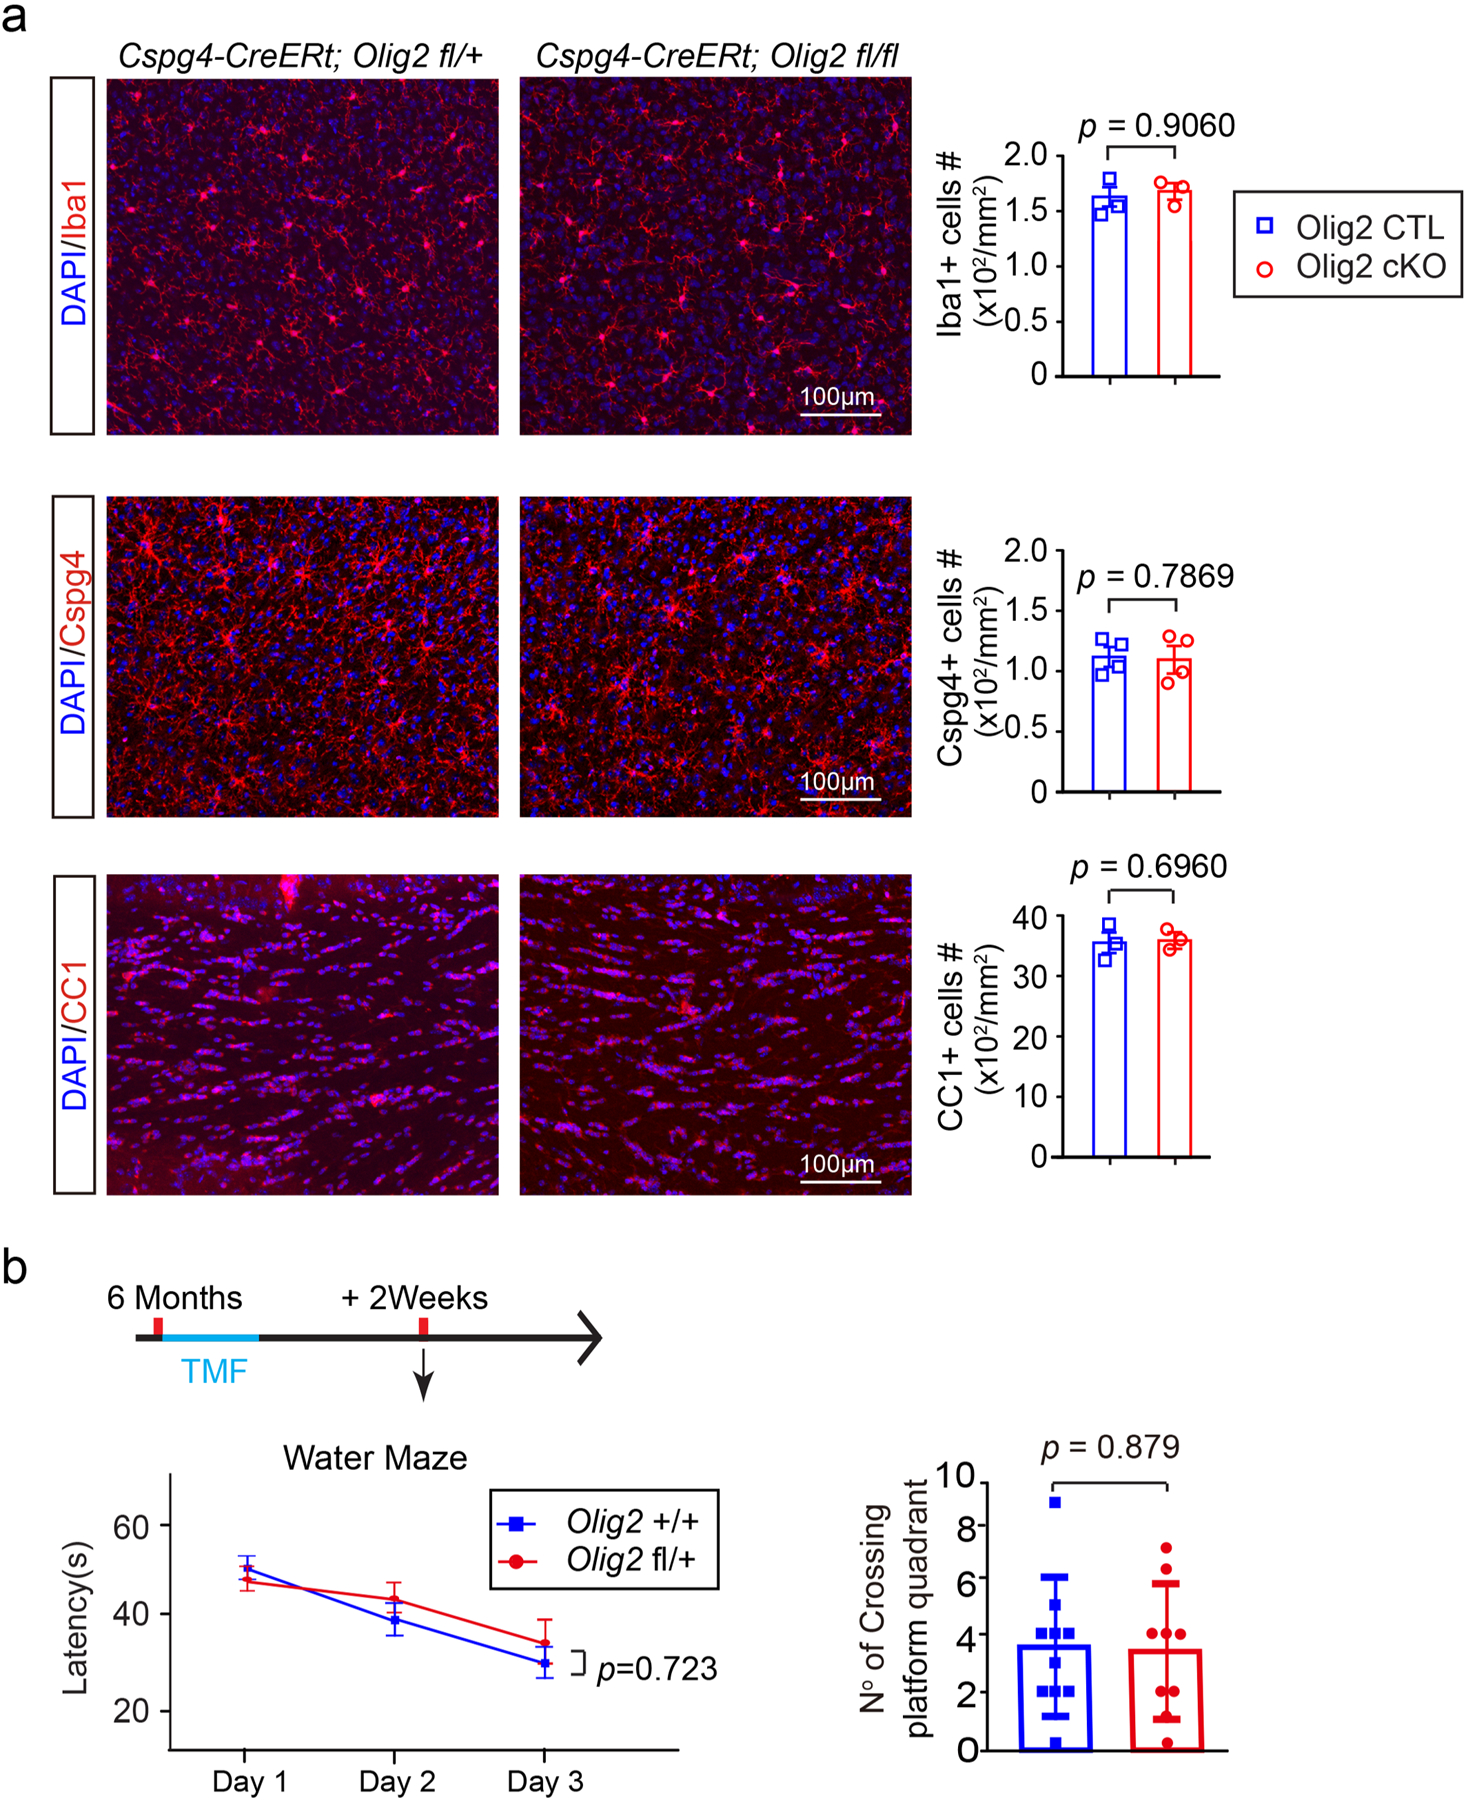
a, Representative images and quantification of Iba1, Cspg4, CC1 positive cells in the motor cortex of Olig2 cKO and littermate controls, n = 3 biologically independent mice for the Iba1 and CC1 immunostaining in each group, and n = 4 biologically independent mice for the Cspg4 immunostaining in each group, two-tailed unpaired t test were used (Iba1:t(4) = 0.1257, p = 0.9060; Cspg4:t(6) = 0.2827, p = 0.7869; CC1:t(4) = 0.4201, p = 0.6960); b, Schematic diagram displaying the time course of tamoxifen induction and the water maze test. The Morris water maze test showing latency to platform in acquisition phase and numbers of platform crossing of the Olig2 fl/ + (n = 9 biologically independent mice) and Olig2 + / + (n = 10 biologically independent mice) mice. Two-way repeated ANOVA was used for the latencies to platform (F(1,17) = 0.130, p = 0.723), two-tailed unpaired t test was used for number of platform crossing in the target quadrant (t(17) = 0.03205, p = 0.9748). Scale bar: 100 μm. Points represented individual animals. Error bars represent mean ± s.e.m.
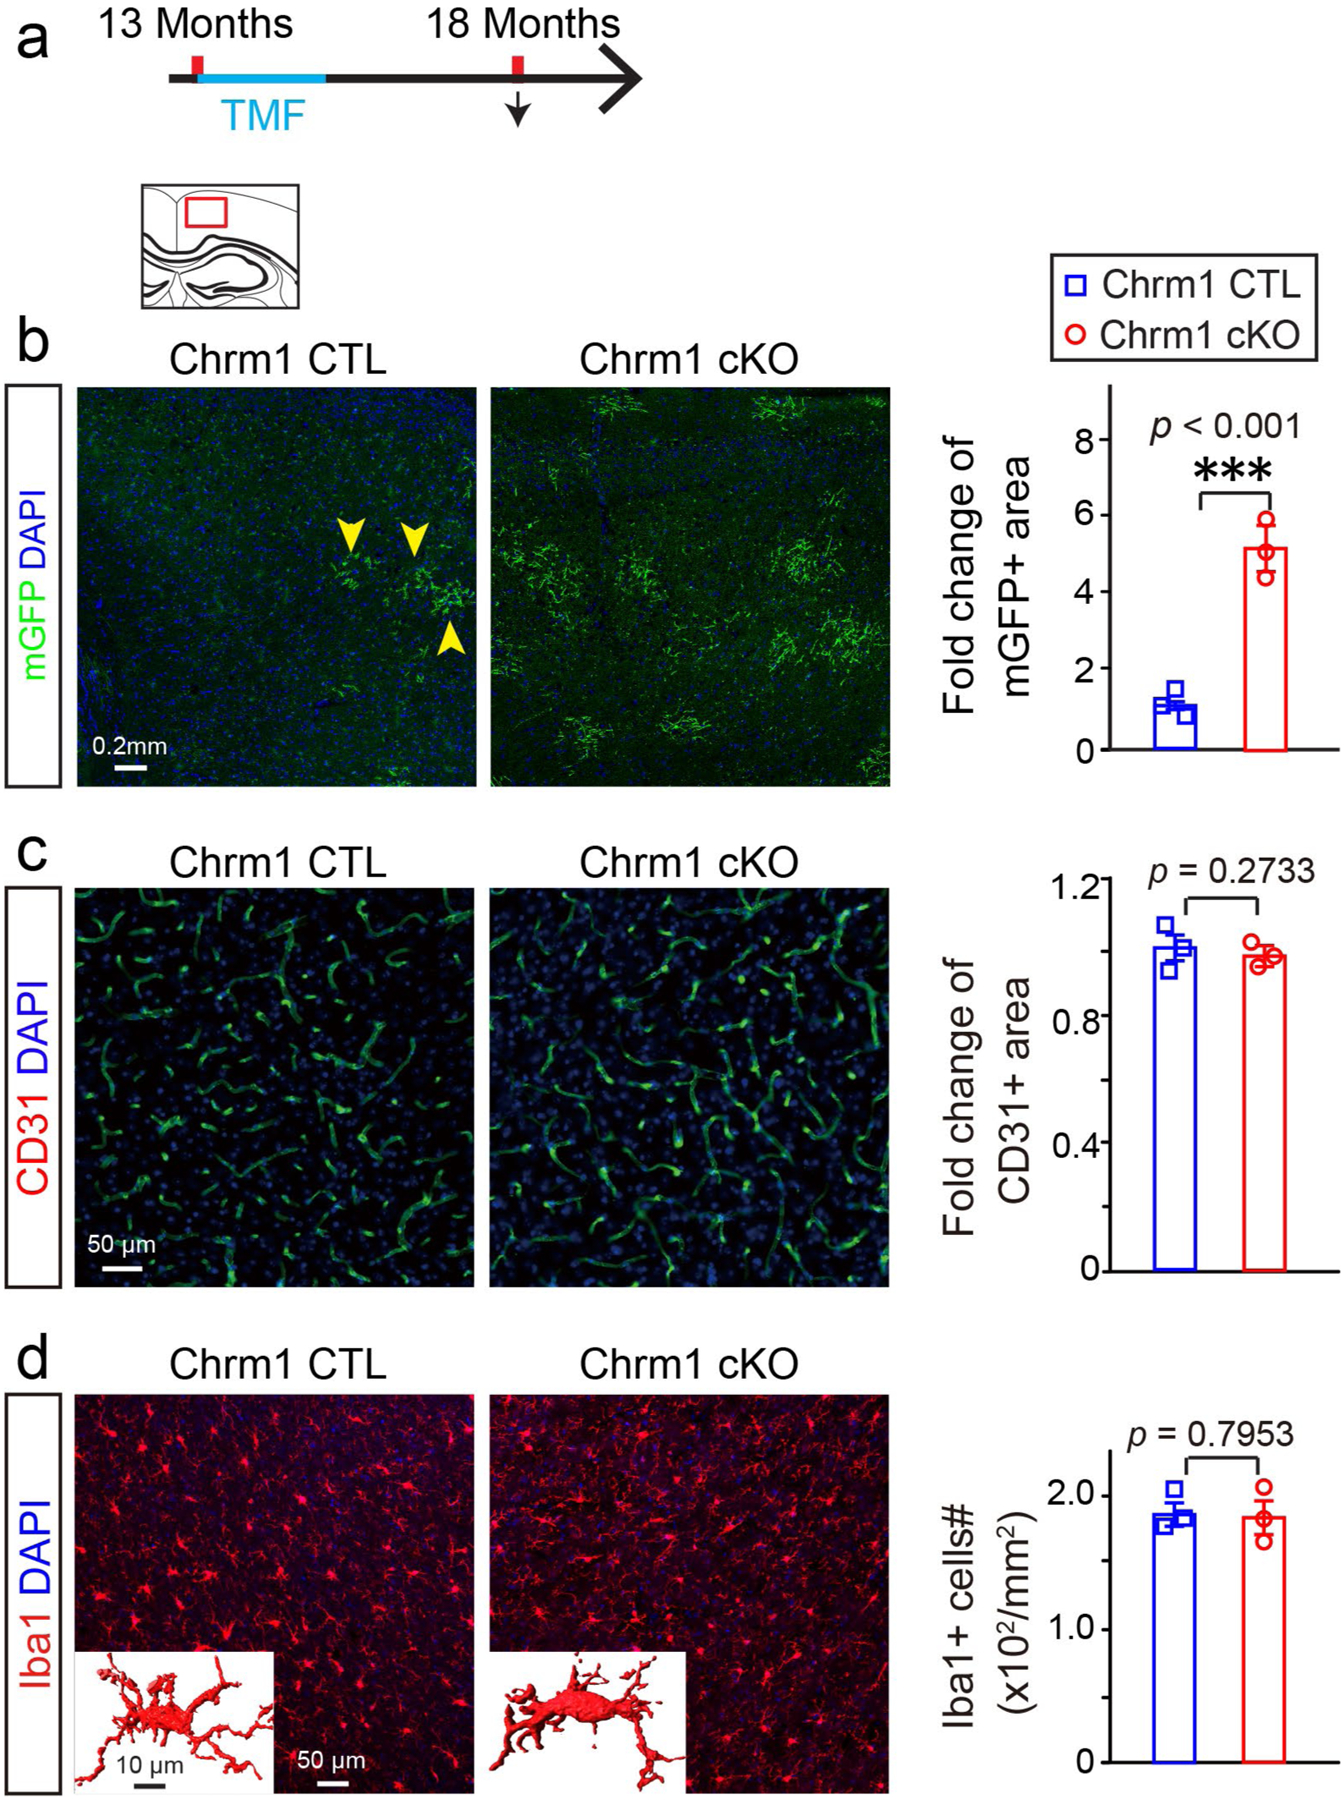
a, Schematic diagram displaying the time course of tamoxifen induction and histology; b, Representative images and quantification of mGFP positive myelin (yellow arrowheads) in the cortex of Chrm1 cKO mice and age-matched wildtypes, scale bar = 0.2 mm; c, Representative images and quantification of CD31 positive area in the cortex of Chrm1 cKO mice and age-matched wildtypes, Scale bar = 50μm; d, Representative images and quantification of Iba1 positive microglia in the cortex of Chrm1 cKO mice and age-matched wildtypes, Scale bar = 50 μm, n = 3 biologically independent mice for each group for all experiments, two-tailed unpaired t test were used for each group in all experiments (mGFP:t(4) = 11.37, p < 0.001; CD31:t(4) = 1.269, p = 0.2733; Iba1:t(4) = 0.2773, p = 0.7953); Inserted images showing 3D Iba1 positive cells, scale bar = 10 μm. Points represented individual animals. Error bars represent mean ± s.e.m. ***p < 0.001.
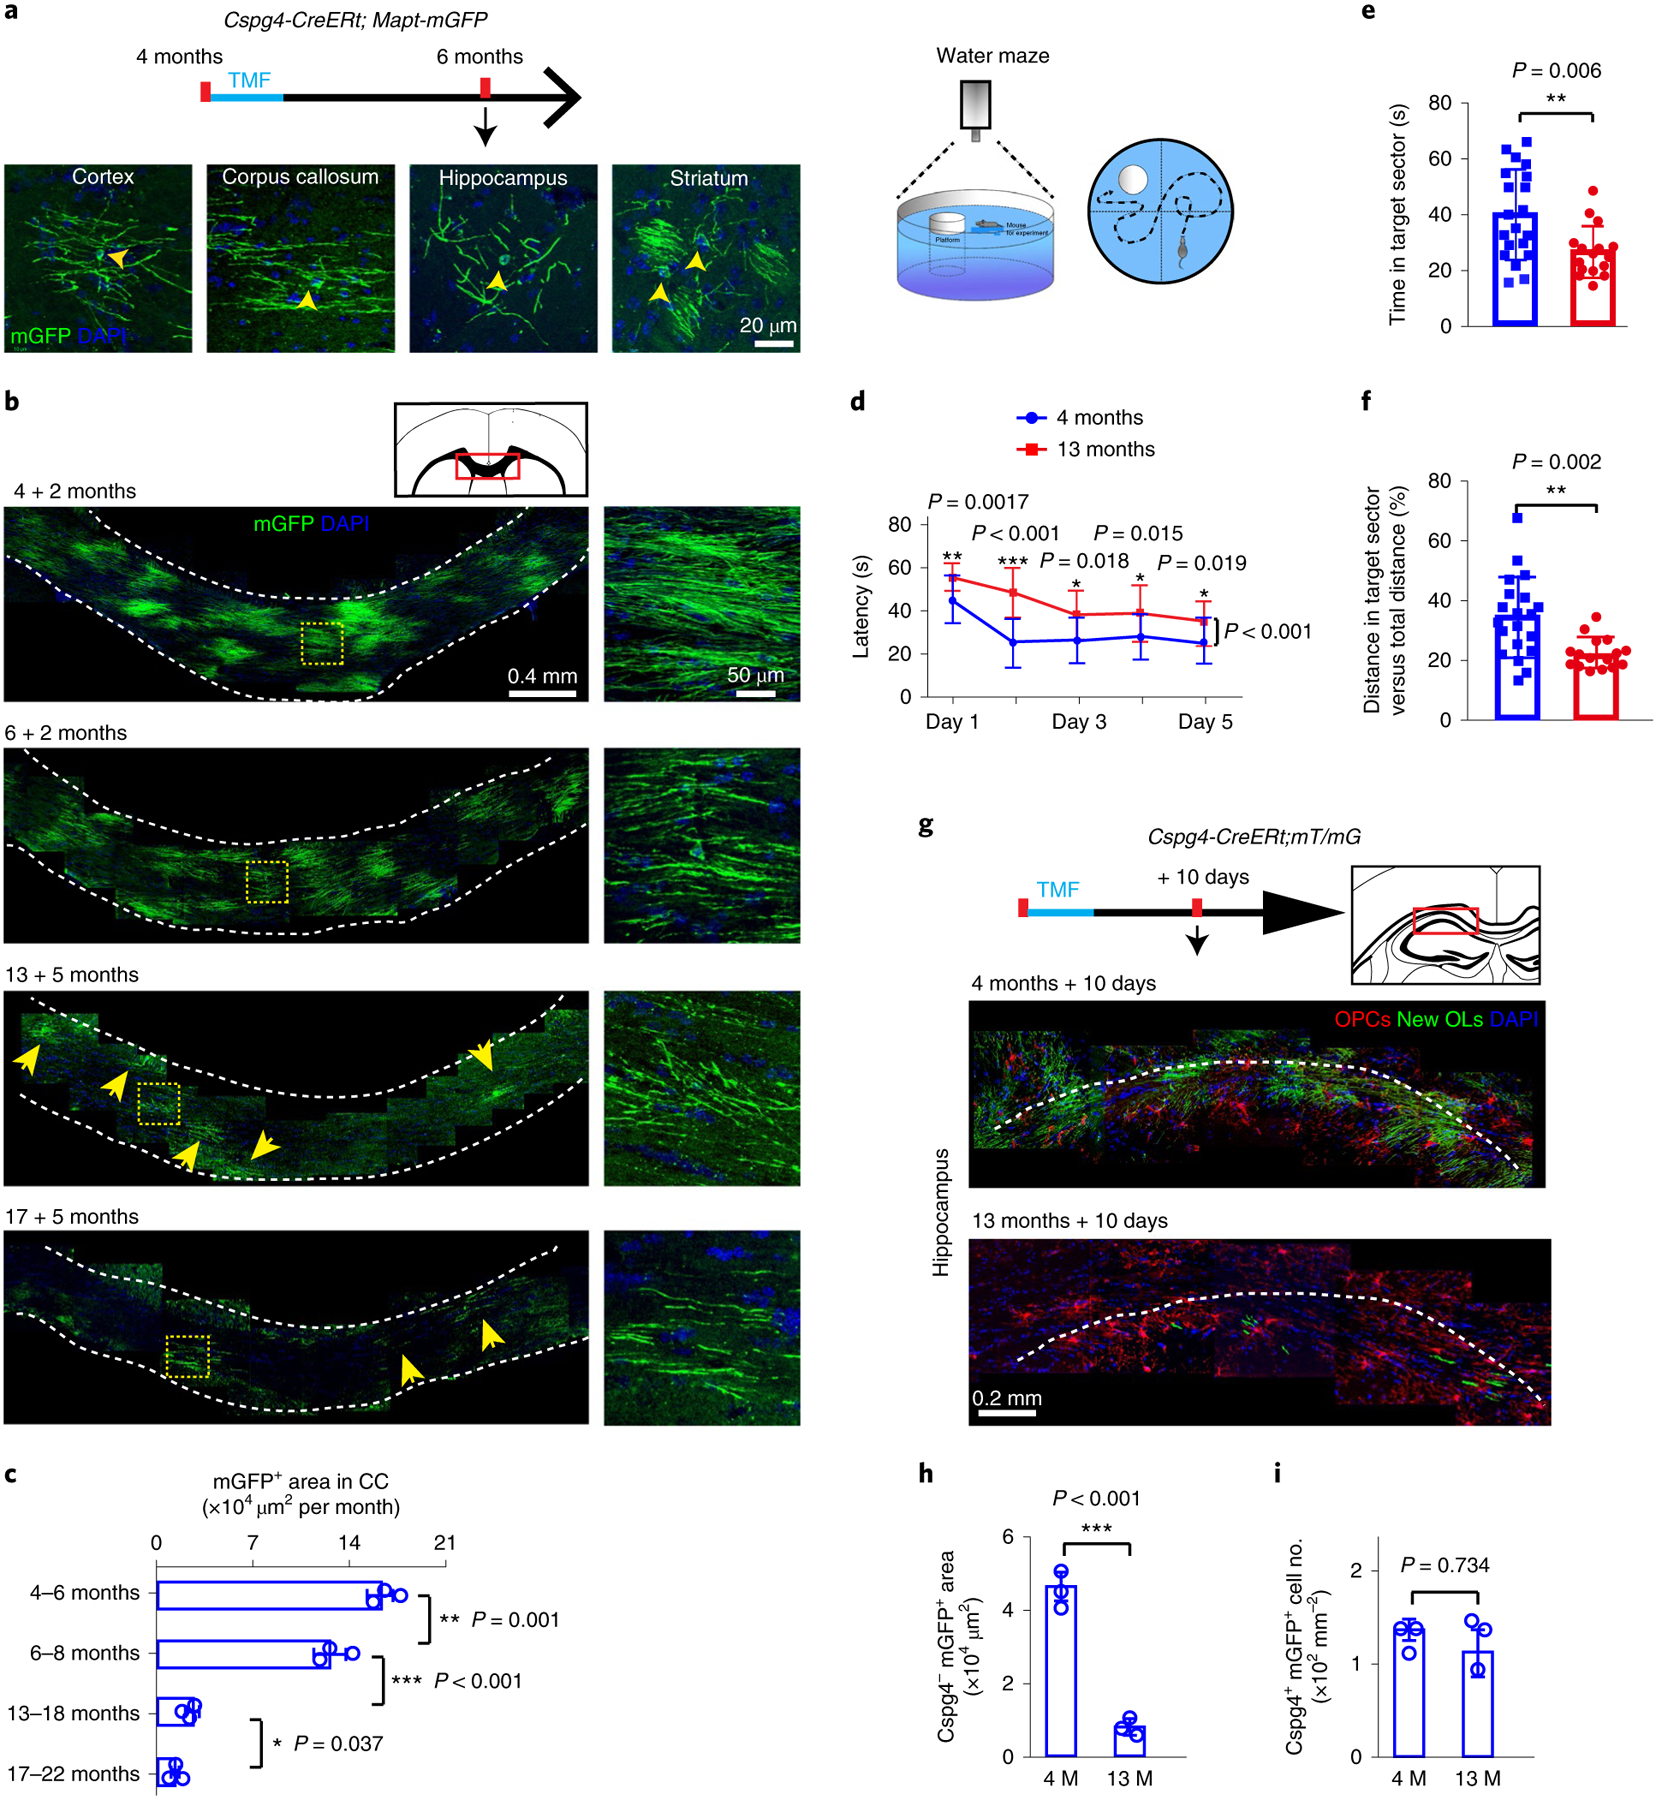
a, Schematic diagram displaying the time course of tamoxifen induction and histology in the Cspg4-CreERt;Mapt-mGFP mice, and representative images showing mGFP-positive oligodendrocytes (yellow arrowheads) and associated myelin sheaths in cortex, corpus callosum, hippocampus and striatum, 2 months after recombination at 4 months (4 + 2 months); scale bar, 20 μm. b, mGFP-positive oligodendrocytes and myelin sheaths (yellow arrows) in the corpus callosum of 4 + 2-, 6 + 2-, 13 + 5- and 17 + 5-month-old mice. Enlarged images (right panels) correspond to the dotted boxes in the left panels. These experiments were repeated three times independently with similar results. Scale bars, 0.4 mm (left panels); 50 μm (right panels). c, Quantification of mGFP-positive area in corpus callosum; n = 3 biologically independent mice for each group; one-way ANOVA was used followed by post hoc Tukey test (mGFP positive area: F(2,6) = 424.949, P < 0.001; Tukey (4 + 2 months versus 6 + 2 M): P = 0.001; Tukey (6 + 2 months versus 13 + 5 months): P < 0.001; Tukey (13 + 5 months versus 17 + 5 months): P = 0.037). d–f, The Morris water maze test reveals the latency to platform in the acquisition phase (d), and time (e) and distance (f) spent in the target quadrant in the 4-month-old (n = 20 biologically independent mice) and 13-month-old (n = 16 biologically independent mice) mice. Two-way repeated ANOVA was used for the latencies to platform (d): F(1,34) = 44.928, P < 0.001; day 1, unpaired t-test (P = 0.0017); day 2, unpaired t-test (P < 0.001); day 3, unpaired t-test (P = 0.018); day 4, unpaired t-test (P = 0.015); day 5, unpaired t-test (P = 0.019); two-sided unpaired Mann–Whitney tests were used for time spent in target sector (e): U(34) = 76, P = 0.0065 and distance traveled in target sector vs total distance (f): U(34) = 65, P = 0.0019. g–i, Schematic diagram displaying the time course of tamoxifen induction and histology in the Cspg4-CreERt;mT/mG mice, along with representative images of Cspg4+mGFP+ OPC (red) density and Cspg4−mGFP+ new myelin (green) area in the hippocampus 10 d after tamoxifen treatment at 4 and 13 months (g); quantification of Cspg4−mGFP+ new myelin area (h) and Cspg4+mGFP+ OPC density (i); n = 3 biologically independent mice for each group, two-tailed unpaired t-tests were used (NG2–mGFP+ area, h: t(4) = 15.11, P < 0.001; NG2+mGFP+ cells, i: t(4) = 0.3621, P = 0.7335); scale bar, 20 μm. Points represent individual animals. Error bars represent mean ± s.e.m. *P < 0.05, **P < 0.01, ***P < 0.001. CC, corpus callosum; OL, oligodendrocyte; TMF, tamoxifen.
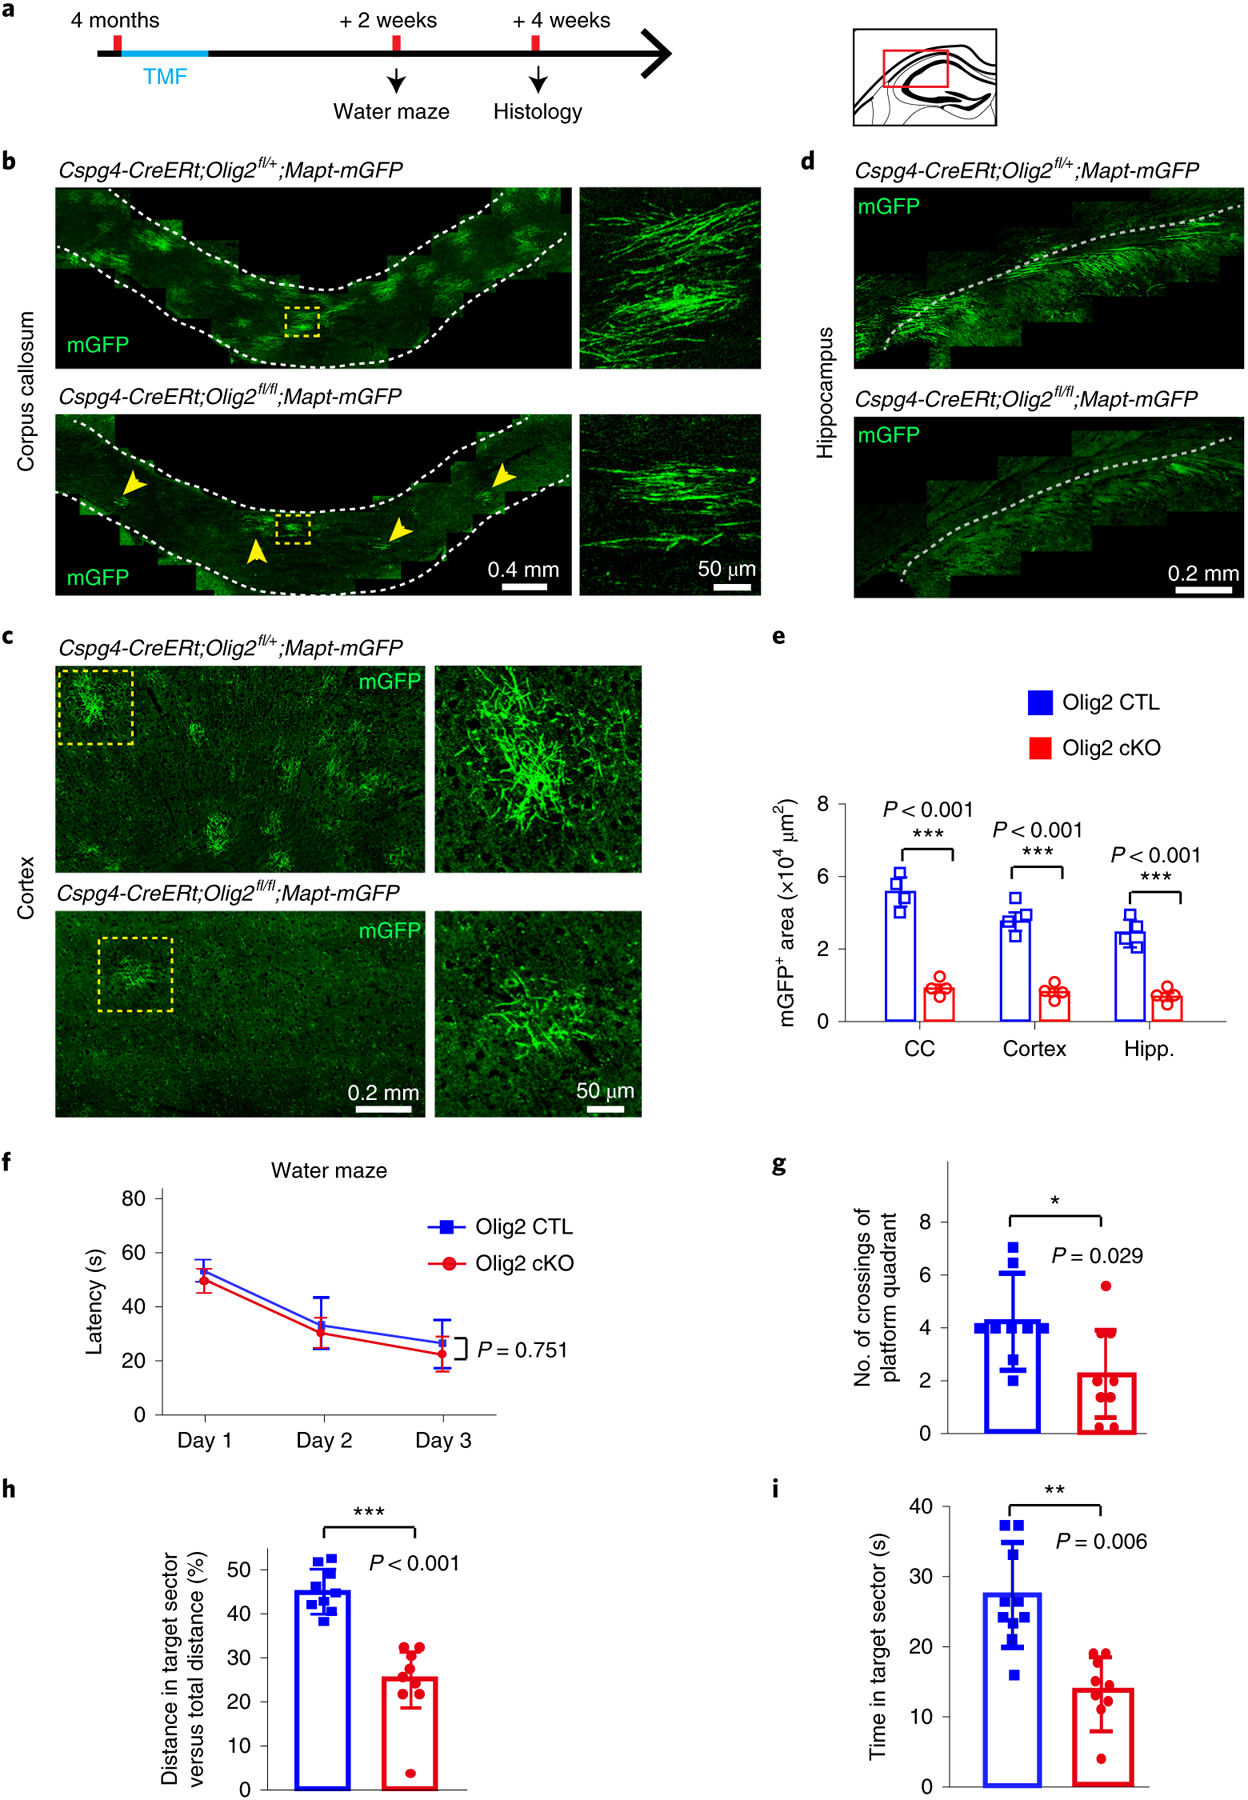
a, Schematic illustration displaying the time course of tamoxifen induction, histology and water maze test. b–d, Representative images showing mGFP+ myelin (arrows) in the corpus callosum (b), cortex (c) and hippocampus (d) of Olig2 cKO brains and littermate controls. Right panels of enlarged images correspond to dotted boxes of left panels (b and c). These experiments were repeated four times independently with similar results. Scale bars, 0.4 mm (left panels of b), 50 μm (right panels of b), 0.2 mm (left panels of c), 50 μm (right panels of c) and 0.2 mm (d). e, Quantification of mGFP+ area in Olig2 cKO brains and littermate controls; n = 4 biologically independent mice for each group, two-tailed unpaired t-tests were used; corpus callosum: t(6) = 20.28, P < 0.001; cortex: t(6) = 13.94, P < 0.001; hippocampus (Hipp.): t(6) = 13.34, P < 0.001). f–i, The Morris water maze test showing latency to platform in acquisition phase (f), number of platform crossings (g), and distance (h) and time (i) spent in the target quadrant in the Olig2 cKO mice and littermate controls; n = 9 biologically independent mice for each group. Two-way repeated ANOVA was used to analyze the latencies to platform (F(1,16) = 0.104, P = 0.751); two-tailed unpaired t-tests were used for number of platform crossings (g: t(16) = 2.339, P = 0.029), distance (h: t(16) = 4.071, P < 0.001) and time (i: t(16) = 3.193, P = 0.006) spent in the target quadrant for each group. Points represent individual animals. Error bars represent mean ± s.e.m. *P < 0.05, **P < 0.01, ***P < 0.001. CTL, control.
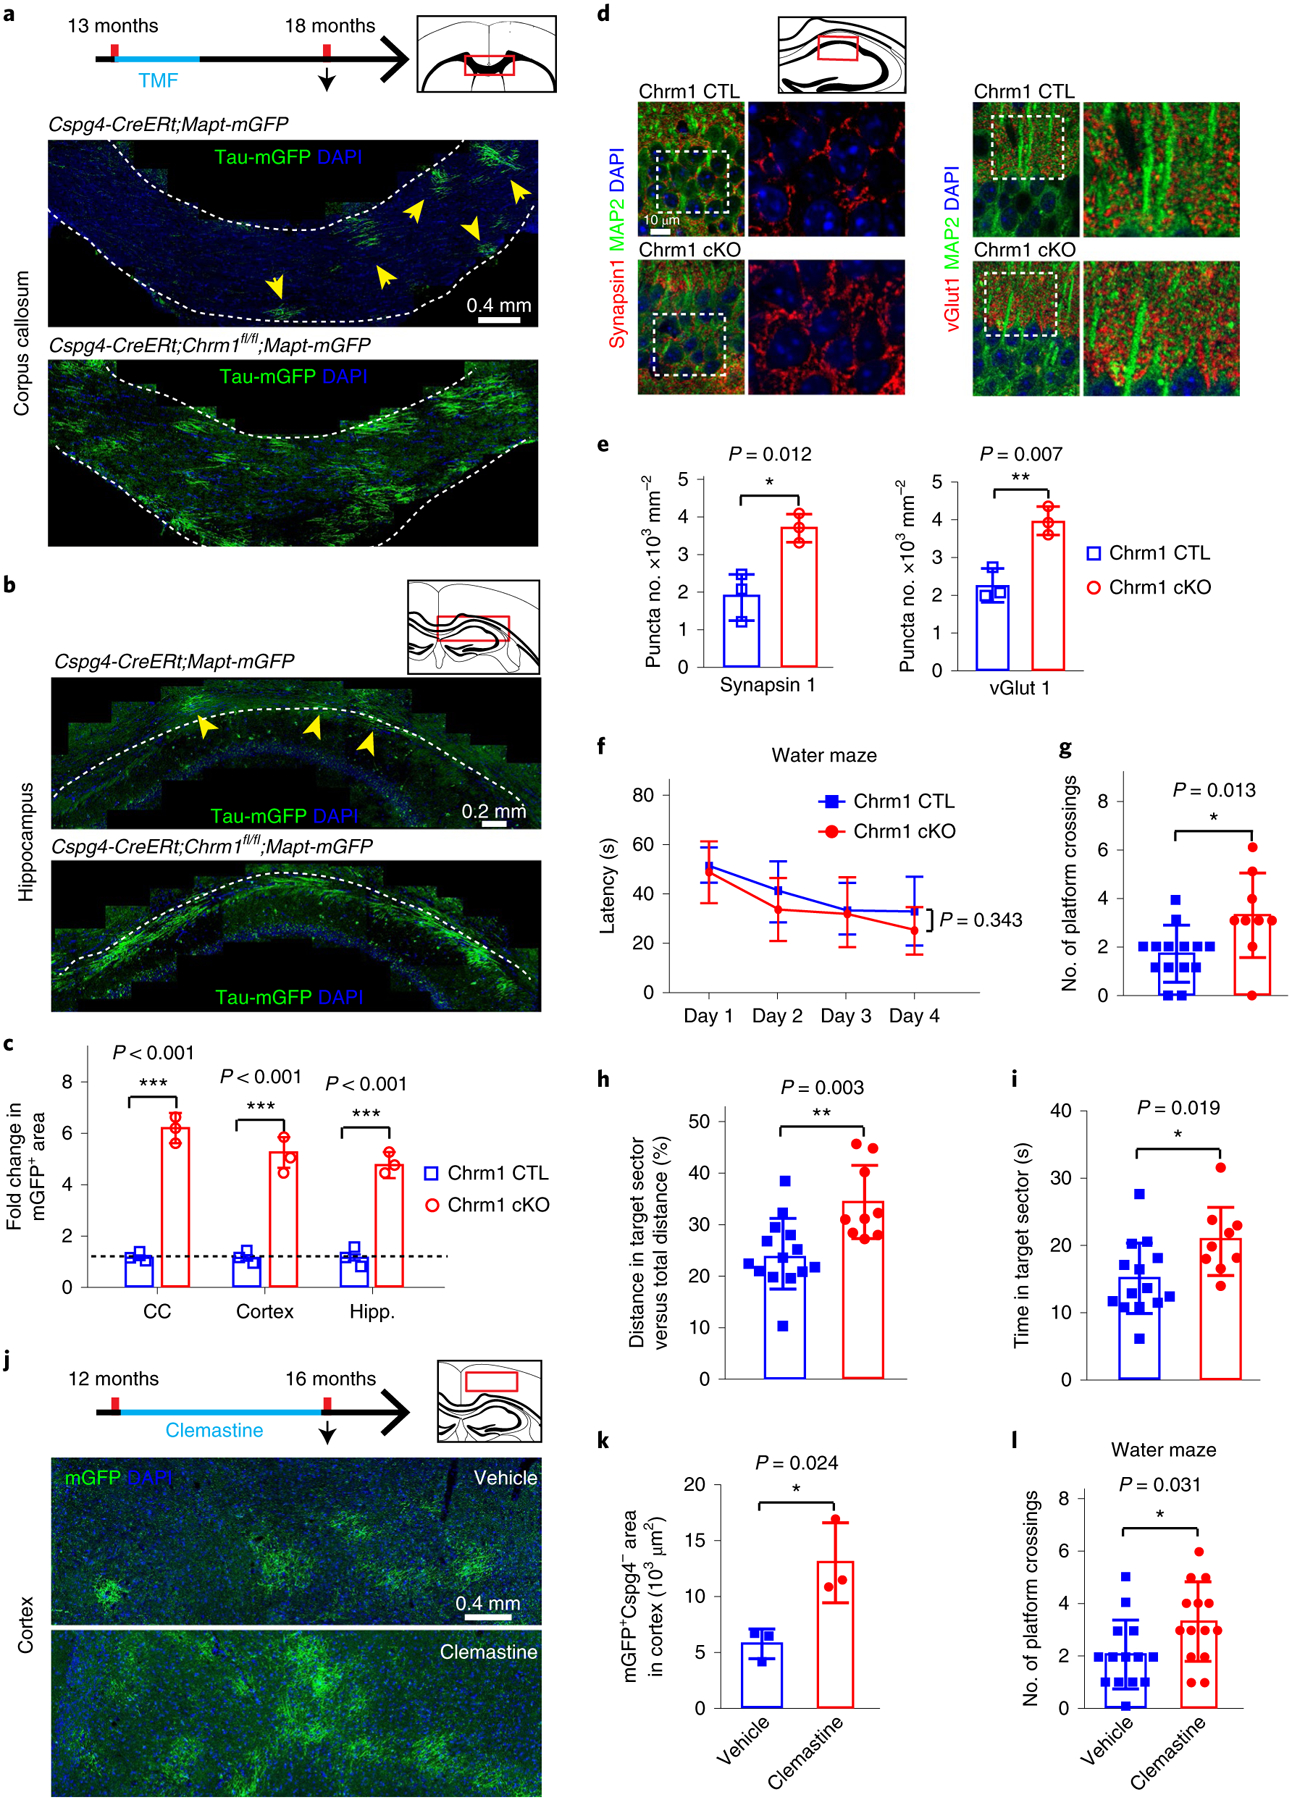
a,b, Schematic diagram displaying the time course of tamoxifen induction, histology and water maze test, and representative images showing mGFP+ myelin (yellow arrowheads) in the corpus callosum (a) and hippocampus (b) of Chrm1 cKO mice and age-matched wild types. These experiments were repeated three times independently with similar results. Scale bars, a, 0.4 mm; b, 0.2 mm. c, Quantification of fold change of mGFP+ areas in the corpus callosum and hippocampus; n = 3 biologically independent mice for each group, two-tailed unpaired t-tests were used (CC: t(4) = 23.52, P < 0.001; hippocampus: t(4) = 14.11, P < 0.001). d,e, Representative images (d) and quantification (e) of synapsin1+ and vGlut1+ synaptic puncta (red) and MAP2 (green) neurons in the CA1 region by immunostaining in the Chrm1 cKO and wild types; enlarged images (right panels) correspond to dotted boxes in left panels. These experiments were repeated three times independently with similar results; n = 3 biologically independent mice for each group, two-tailed unpaired t-tests were used for quantification of synapsin1 (t(4) = 4.343, P = 0.012) and vGlut1 (t(4) = 5.181, P = 0.0066); scale bar, 10 μm. f–i, The Morris water maze test revealing latency to platform in acquisition phase (f), numbers of platform crossings (g), distance (h) and time (i) spent in the target quadrant in the Chrm1 cKO mice (n = 9 biologically independent mice) and wild-type controls (n = 14 biologically independent mice). Two-way repeated ANOVA was used for the latencies to platform (f: F(1,21) = 0.941, P = 0.343); two-tailed unpaired t-tests were used for number of platform crossings (g: t(21) = 2.721, P = 0.0128), distance (h: t(21) = 3.351, P = 0.003) and time (i: t(21) = 2.528, P = 0.0195) spent in the target quadrant. j, Schematic diagram displaying the time course of clemastine treatment, histology and water maze test, and representative images showing Cspg4–mGFP+ myelin in the cortex of Cspg4-CreERt;mT/mG brains; scale bar, 0.4 mm. k, Quantification of Cspg4–mGFP+ myelin; n = 3 biologically independent mice for each group, two-tailed unpaired t-test was used (t(4) = 3.521, P = 0.0244). l, Number of platform crossings of the mice treated with clemastine or vehicle by Morris water maze test; n = 14 biologically independent mice for each group, two-tailed unpaired t-test was used (t(26) = 2.276. P = 0.0313). Points represent individual animals. Error bars represent mean ± s.e.m. *P < 0.05, **P < 0.01, ***P < 0.001.
Comment in
-
Myelin makes memories.Nat Neurosci. 2020 Apr;23(4):469-470. doi: 10.1038/s41593-020-0606-x. Nat Neurosci. 2020. PMID: 32094969 Free PMC article.
References
-
- Gazzaley A, Cooney JW, Rissman J & D’Esposito M Top-down suppression deficit underlies working memory impairment in normal aging. Nat. Neurosci 8, 1298–1300 (2005). - PubMed
-
- Garde E et al. Relation between age-related decline in intelligence and cerebral white-matter hyperintensities in healthy octogenarians: a longitudinal study. Lancet 356, 628–634 (2000). - PubMed
Publication types
MeSH terms
Substances
Grants and funding
LinkOut - more resources
Full Text Sources
Other Literature Sources
Medical
Molecular Biology Databases
