. 2020 Apr;23(4):487-499.
doi: 10.1038/s41593-019-0582-1. Epub 2020 Feb 10.

Preservation of a remote fear memory requires new myelin formation

Affiliations

Preservation of a remote fear memory requires new myelin formation

Simon Pan et al. Nat Neurosci. 2020 Apr.

Abstract

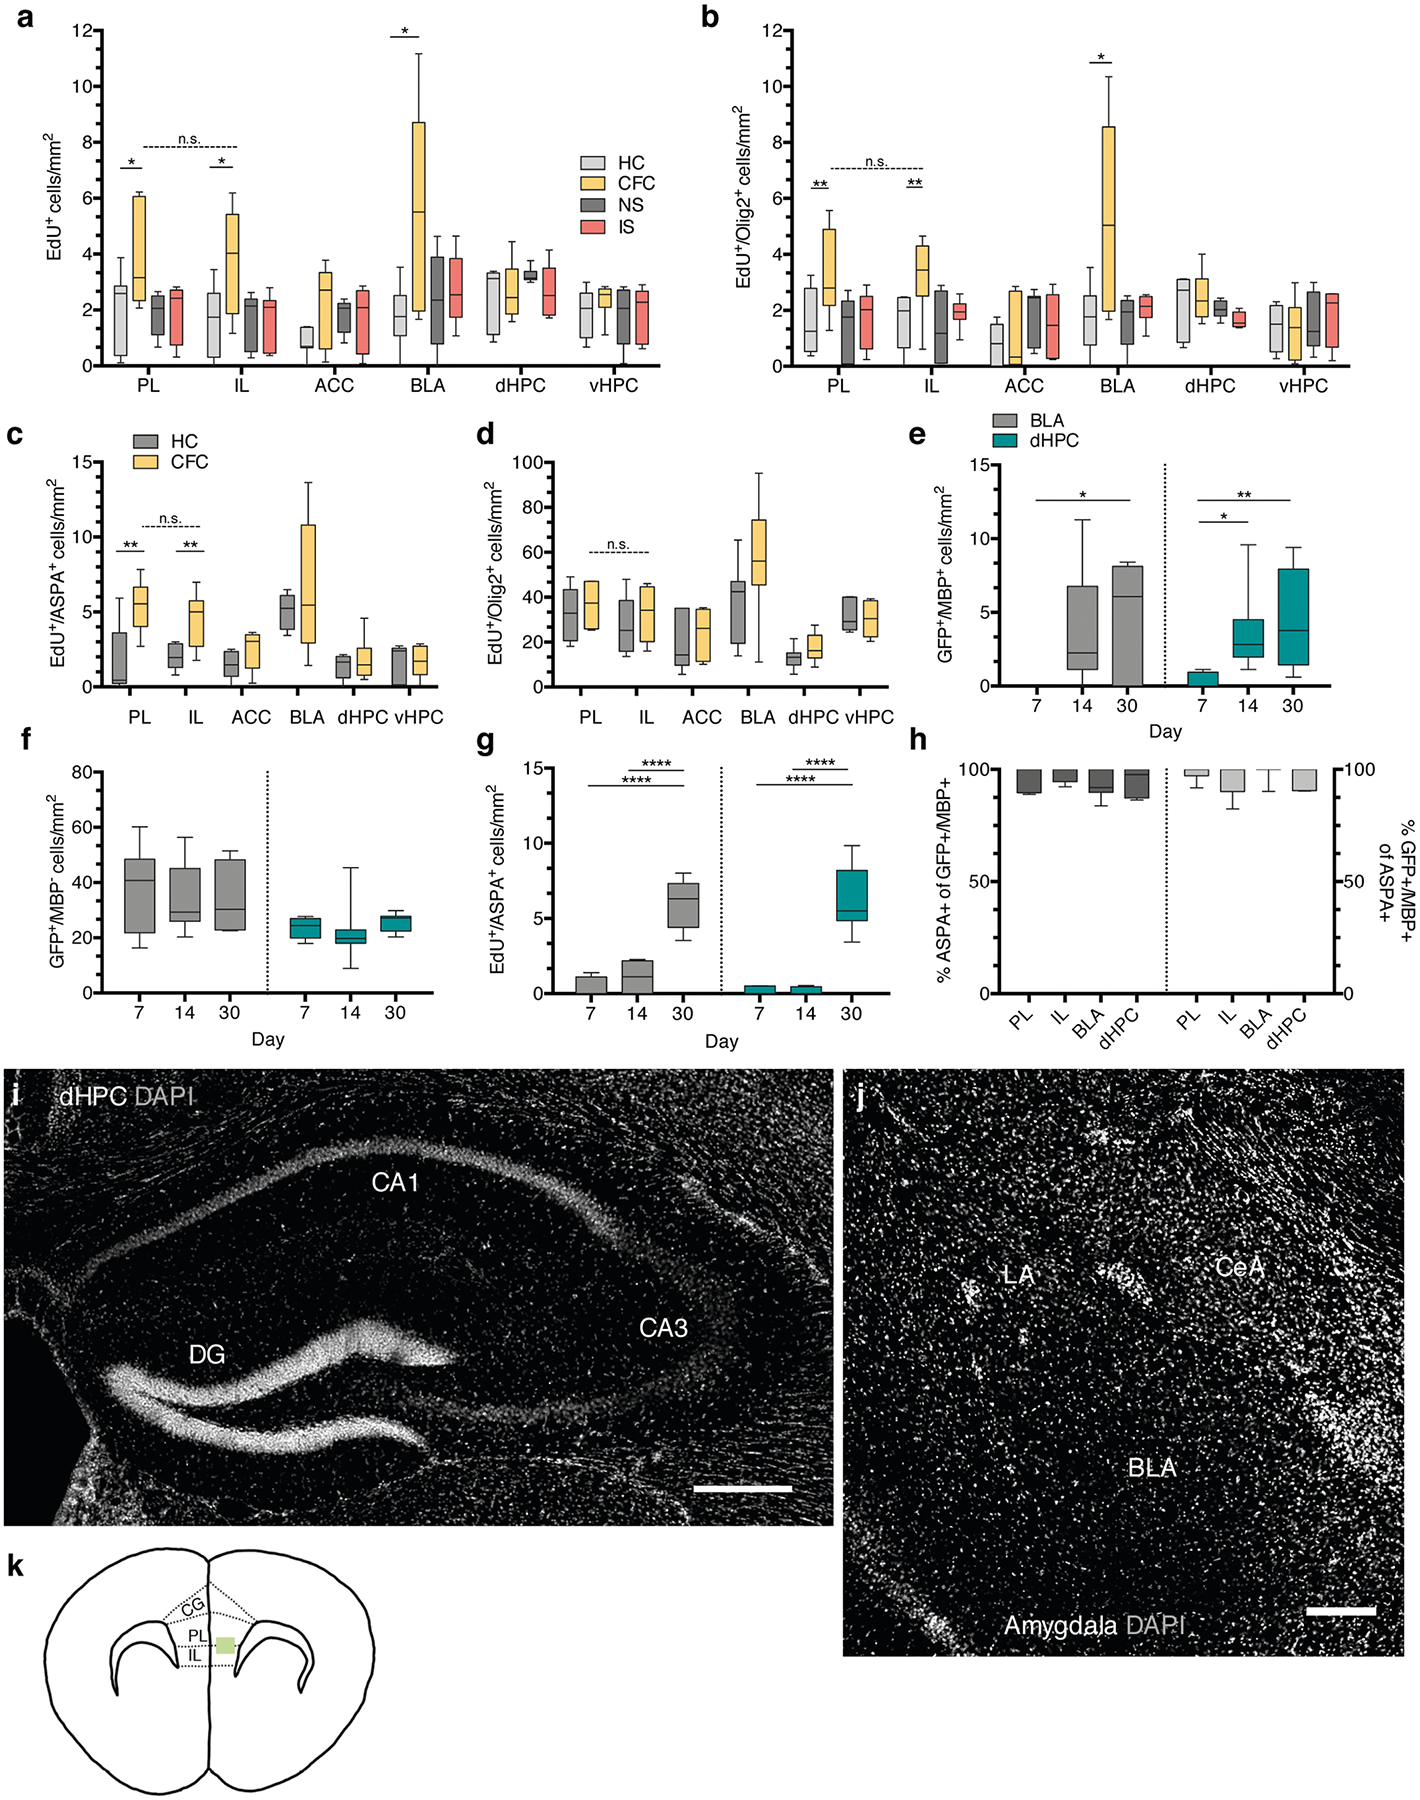
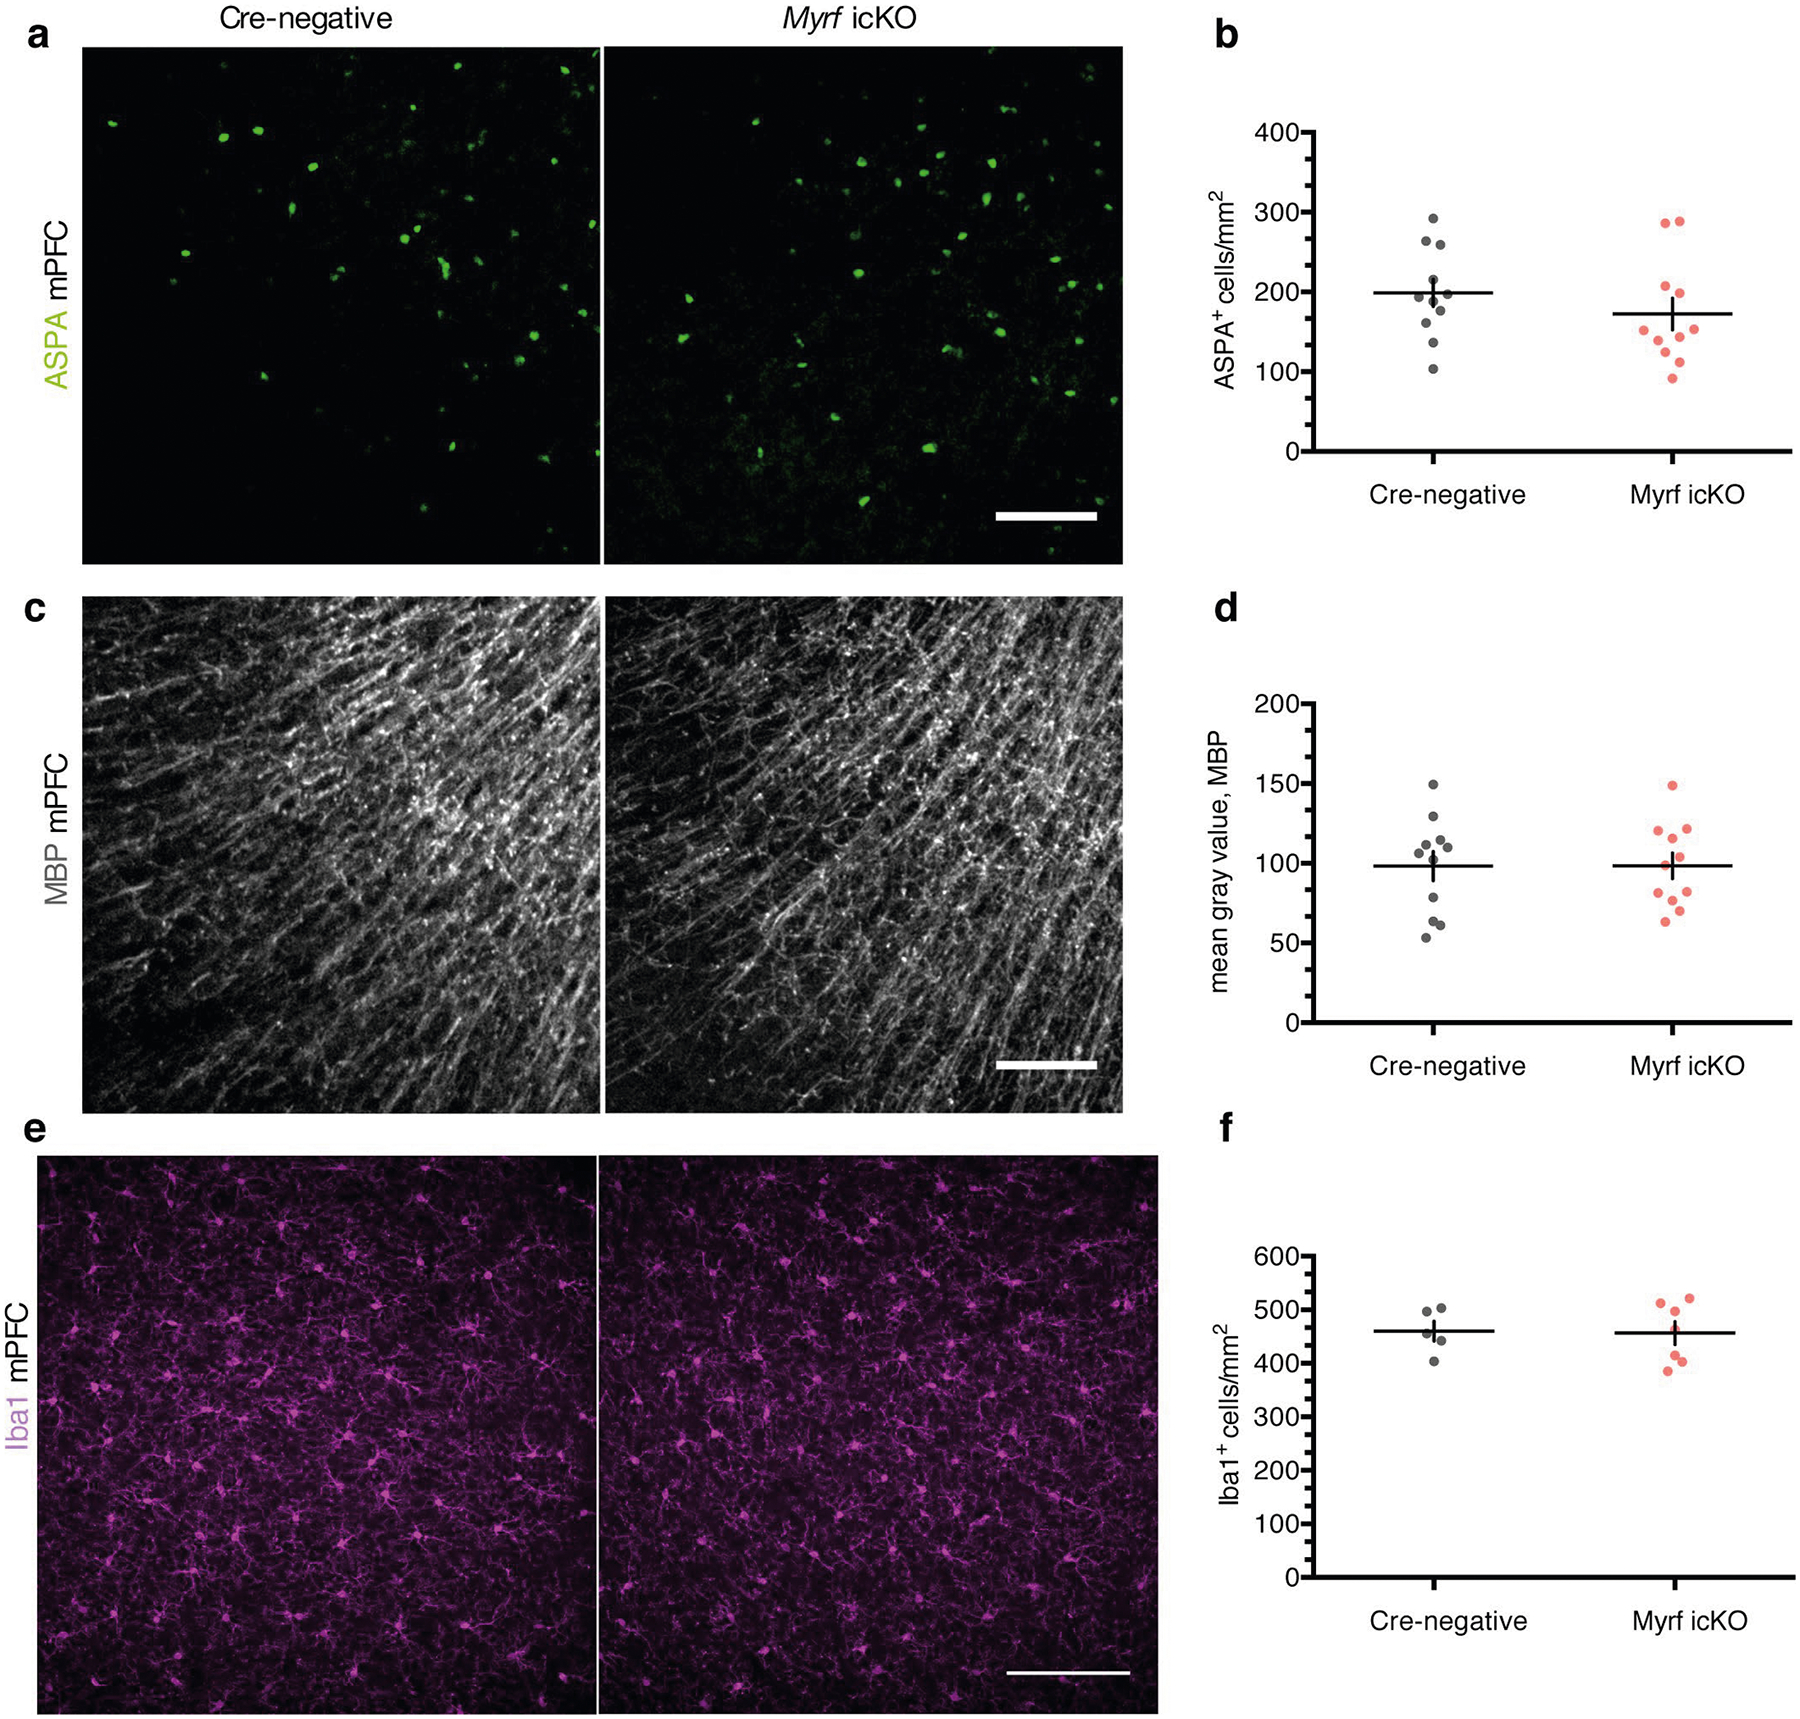
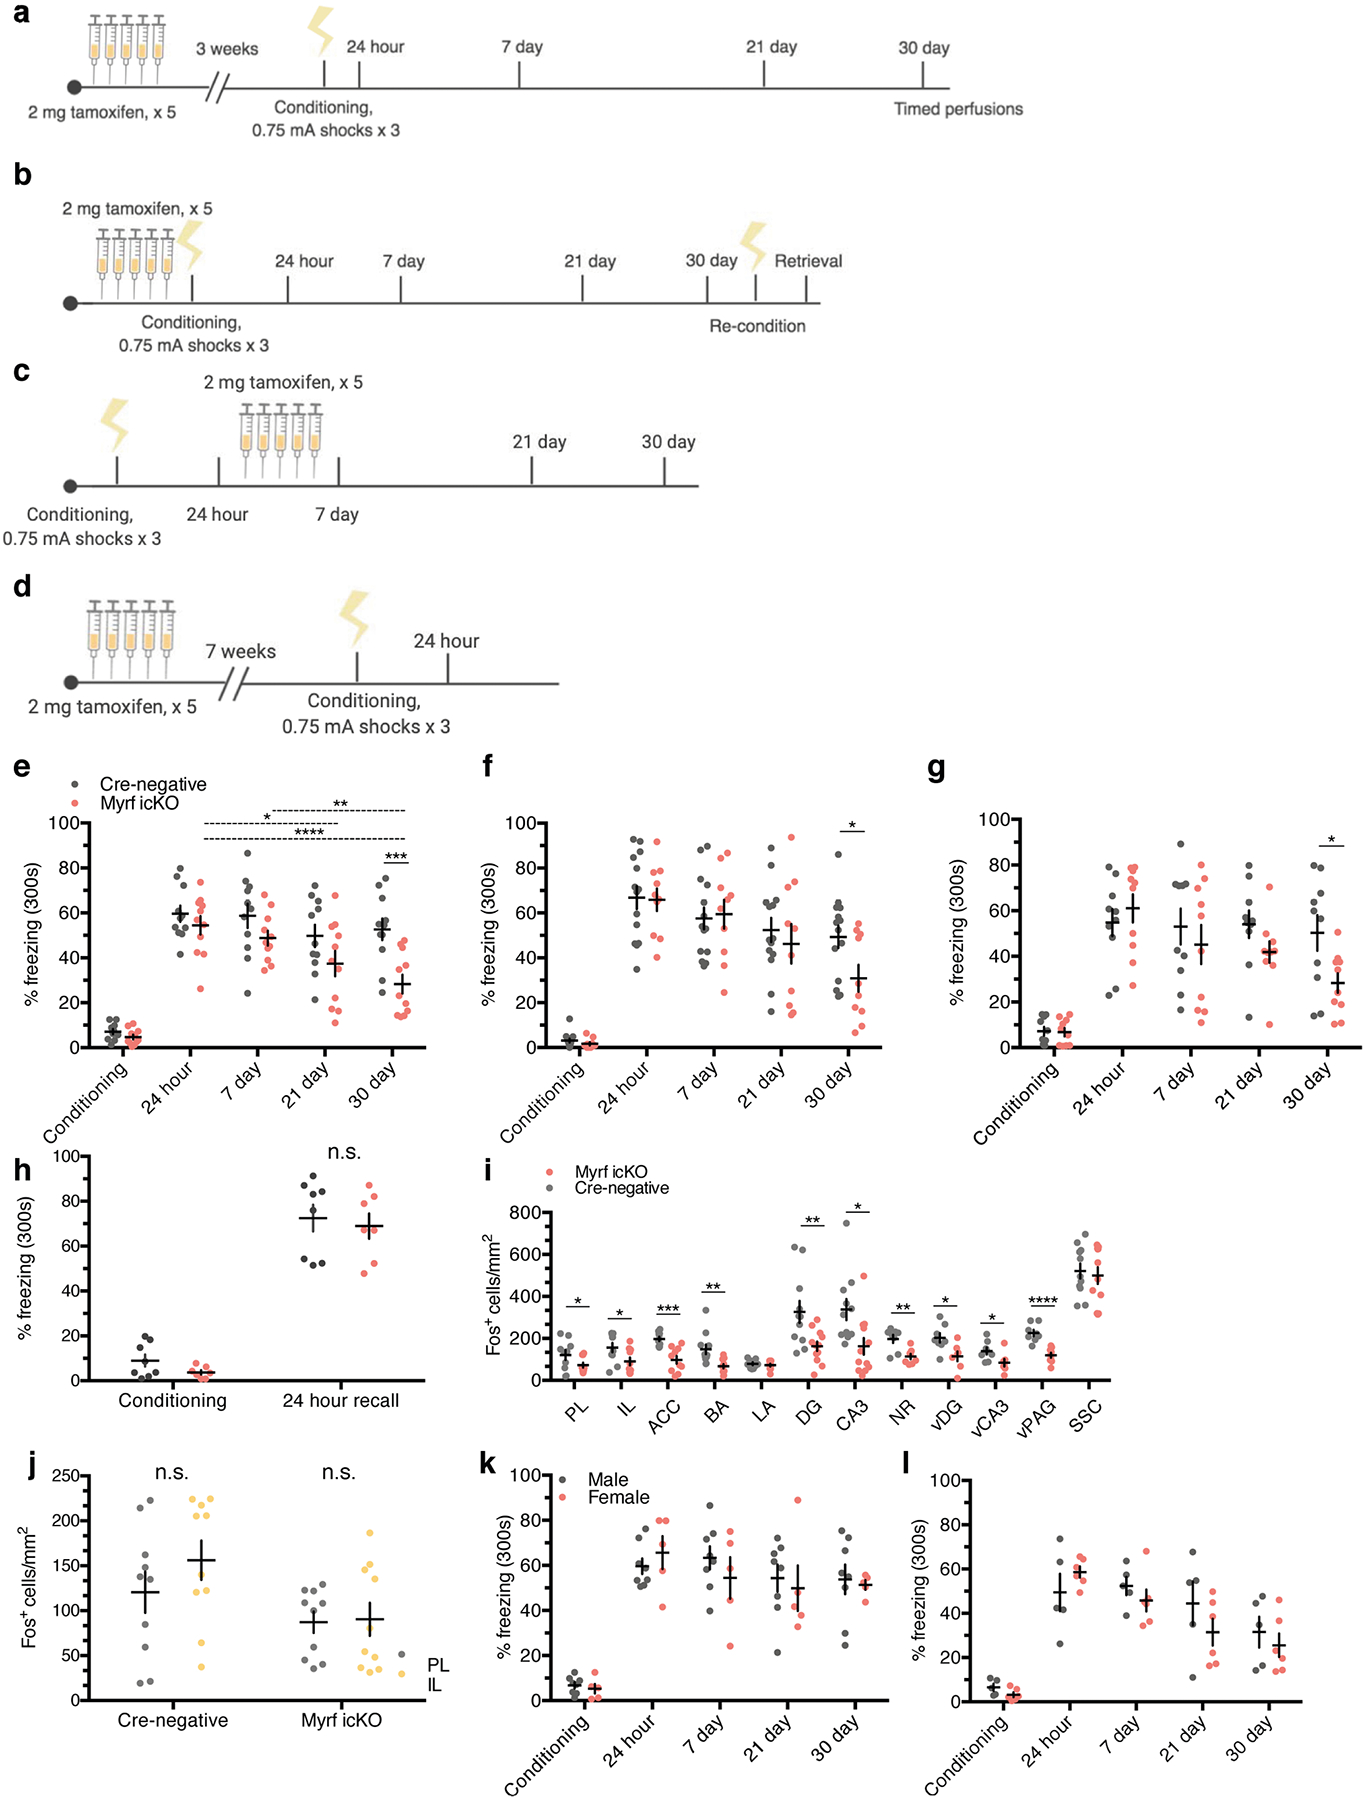
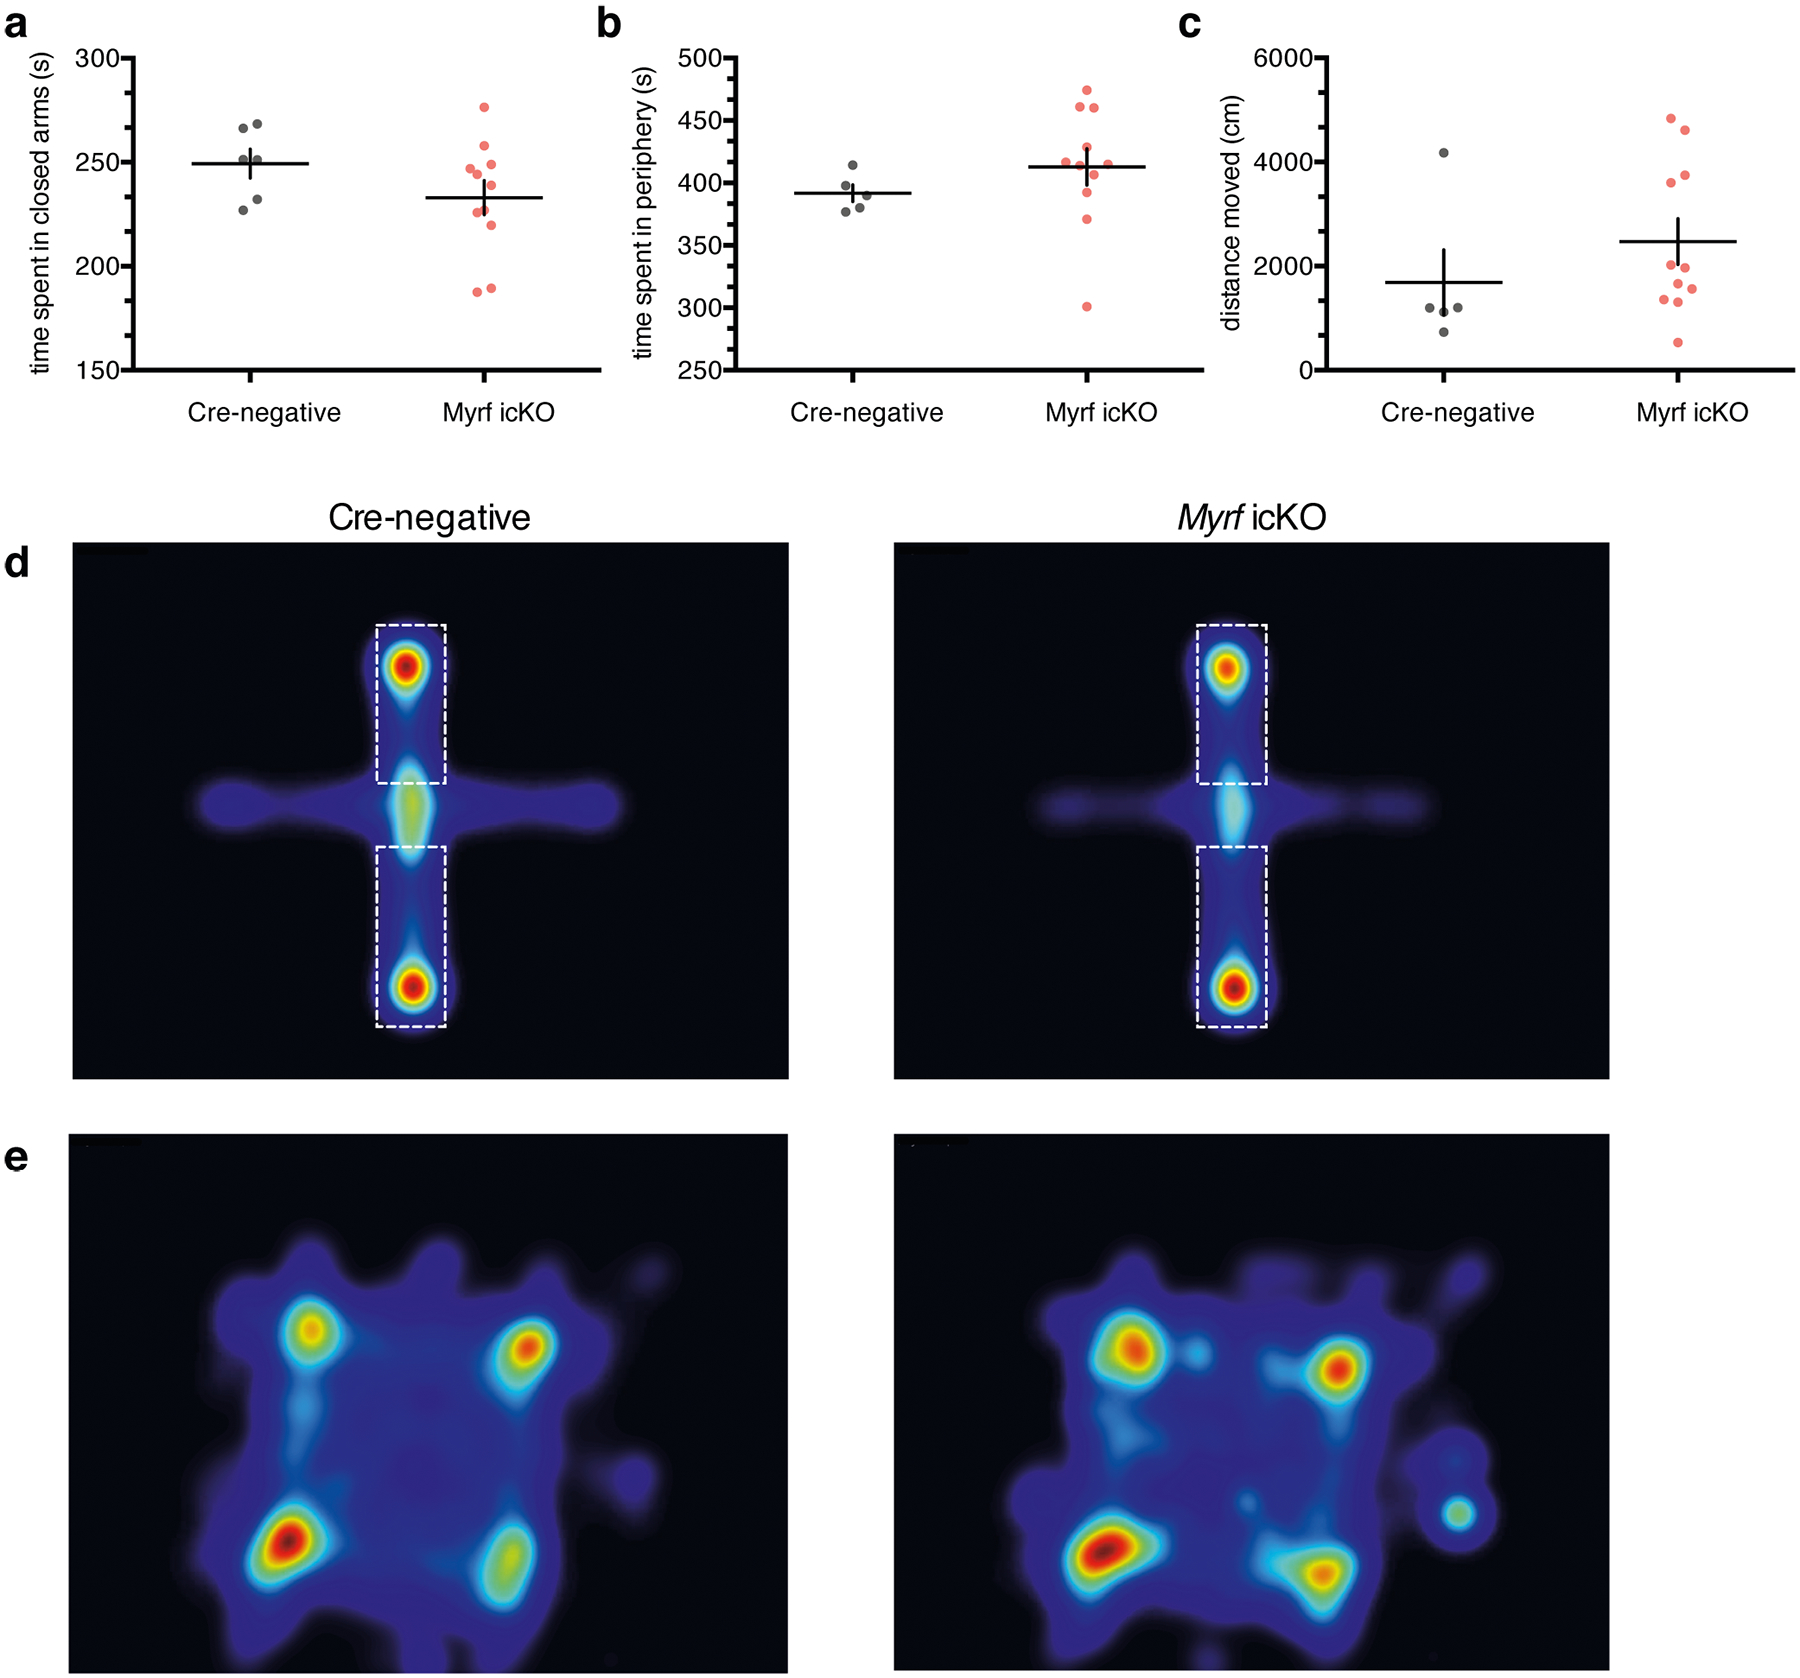
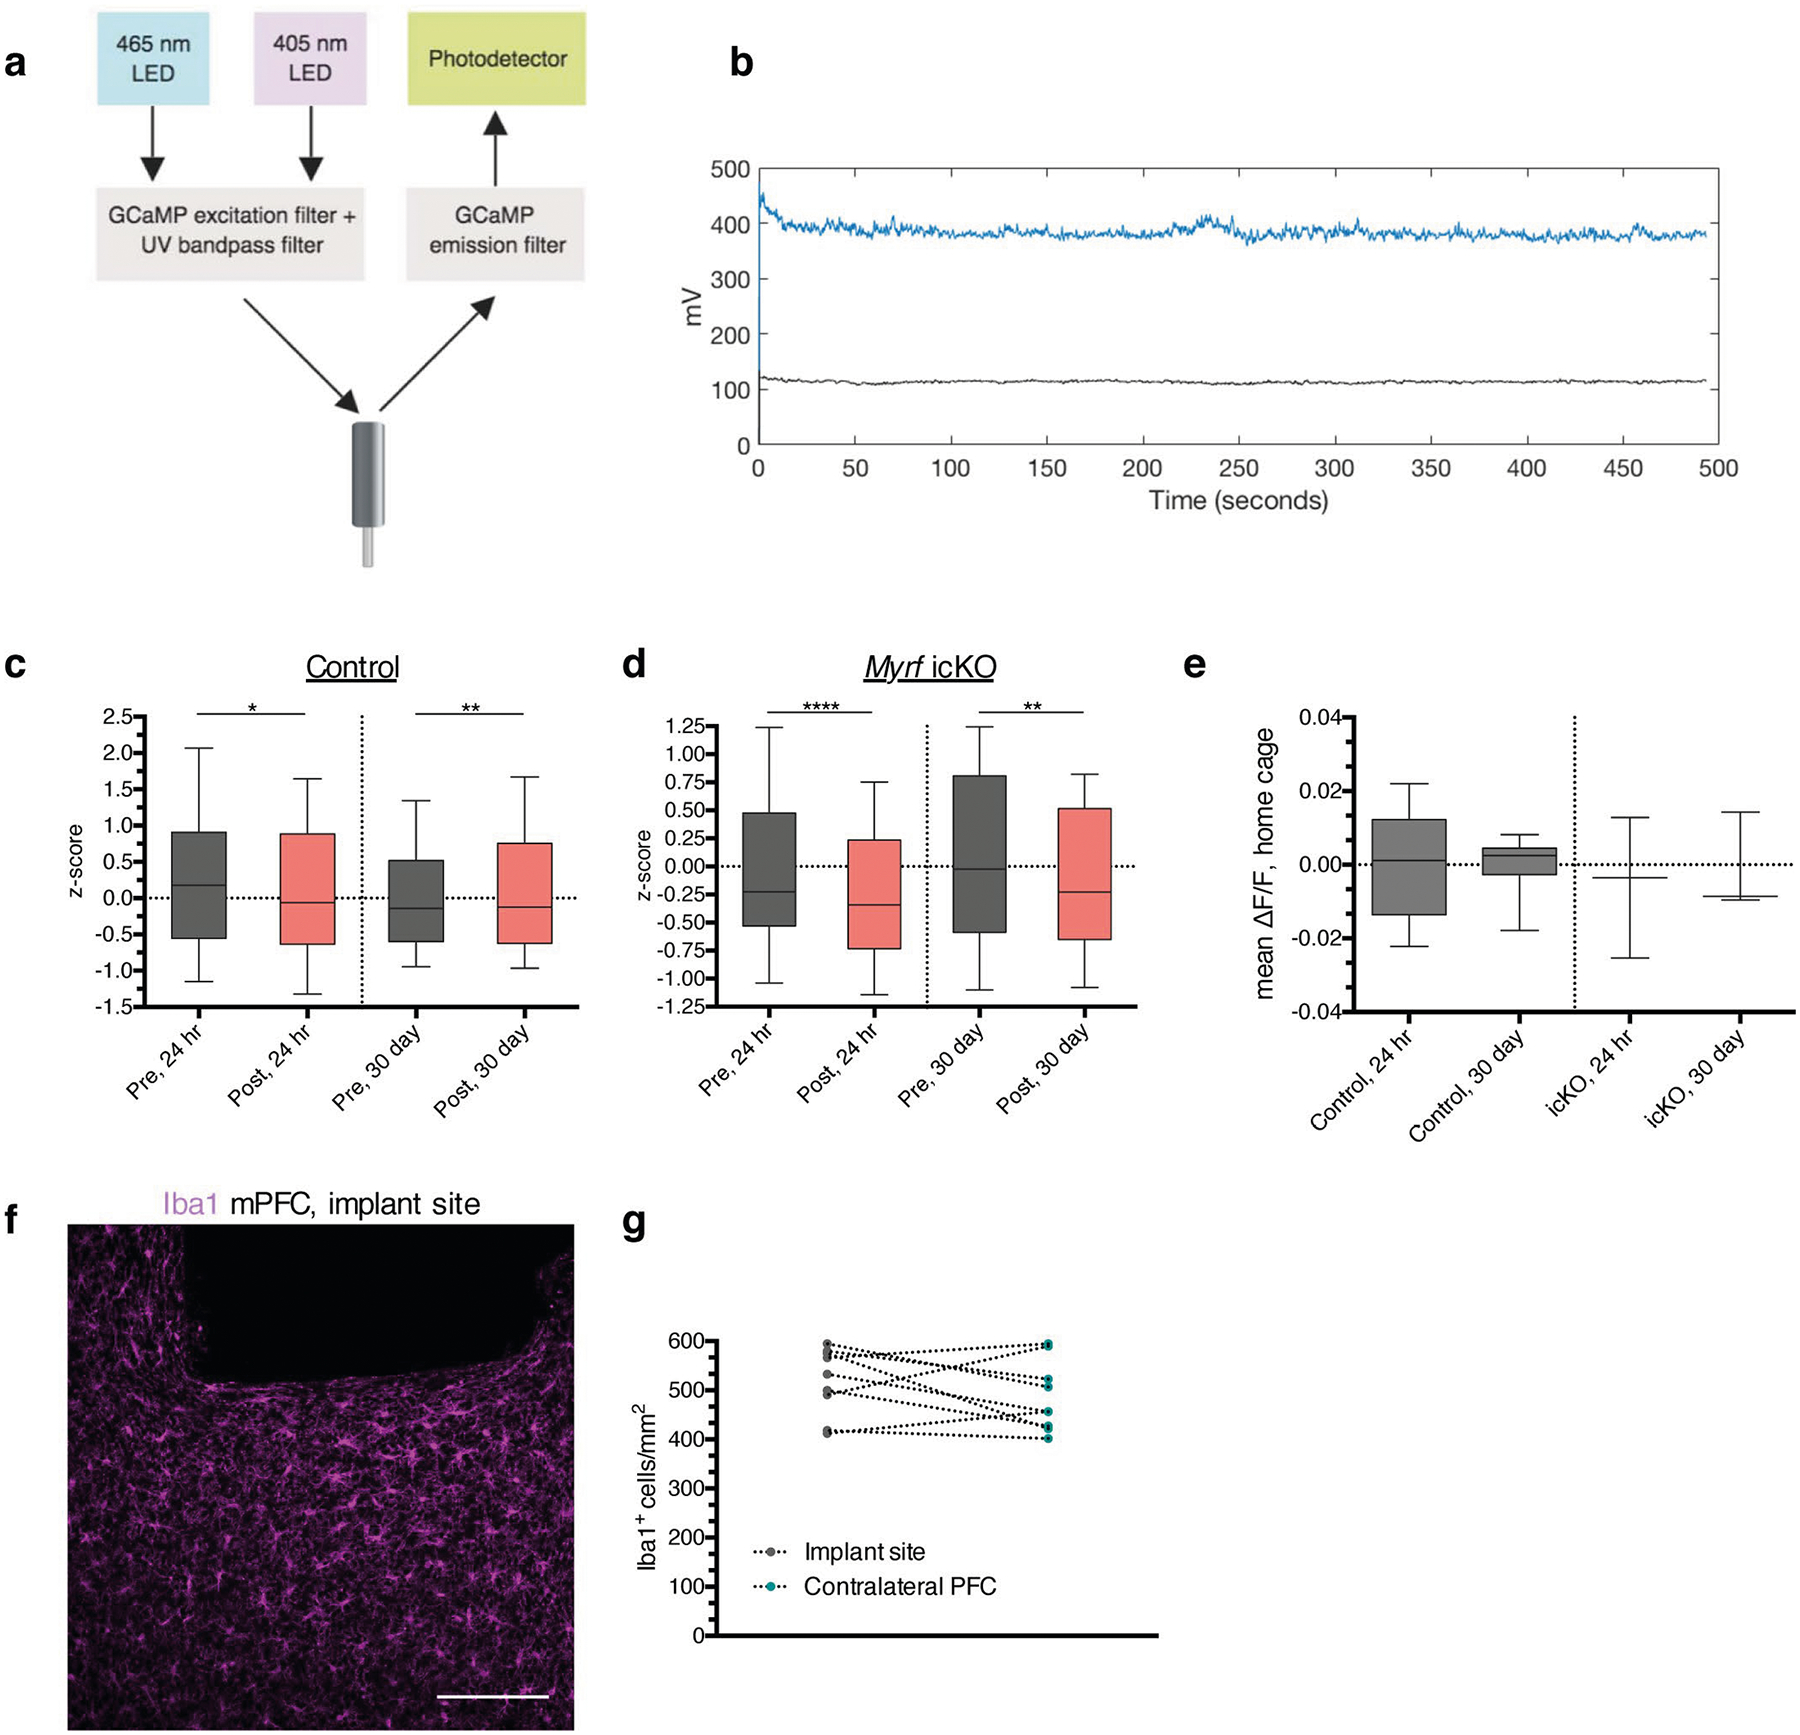
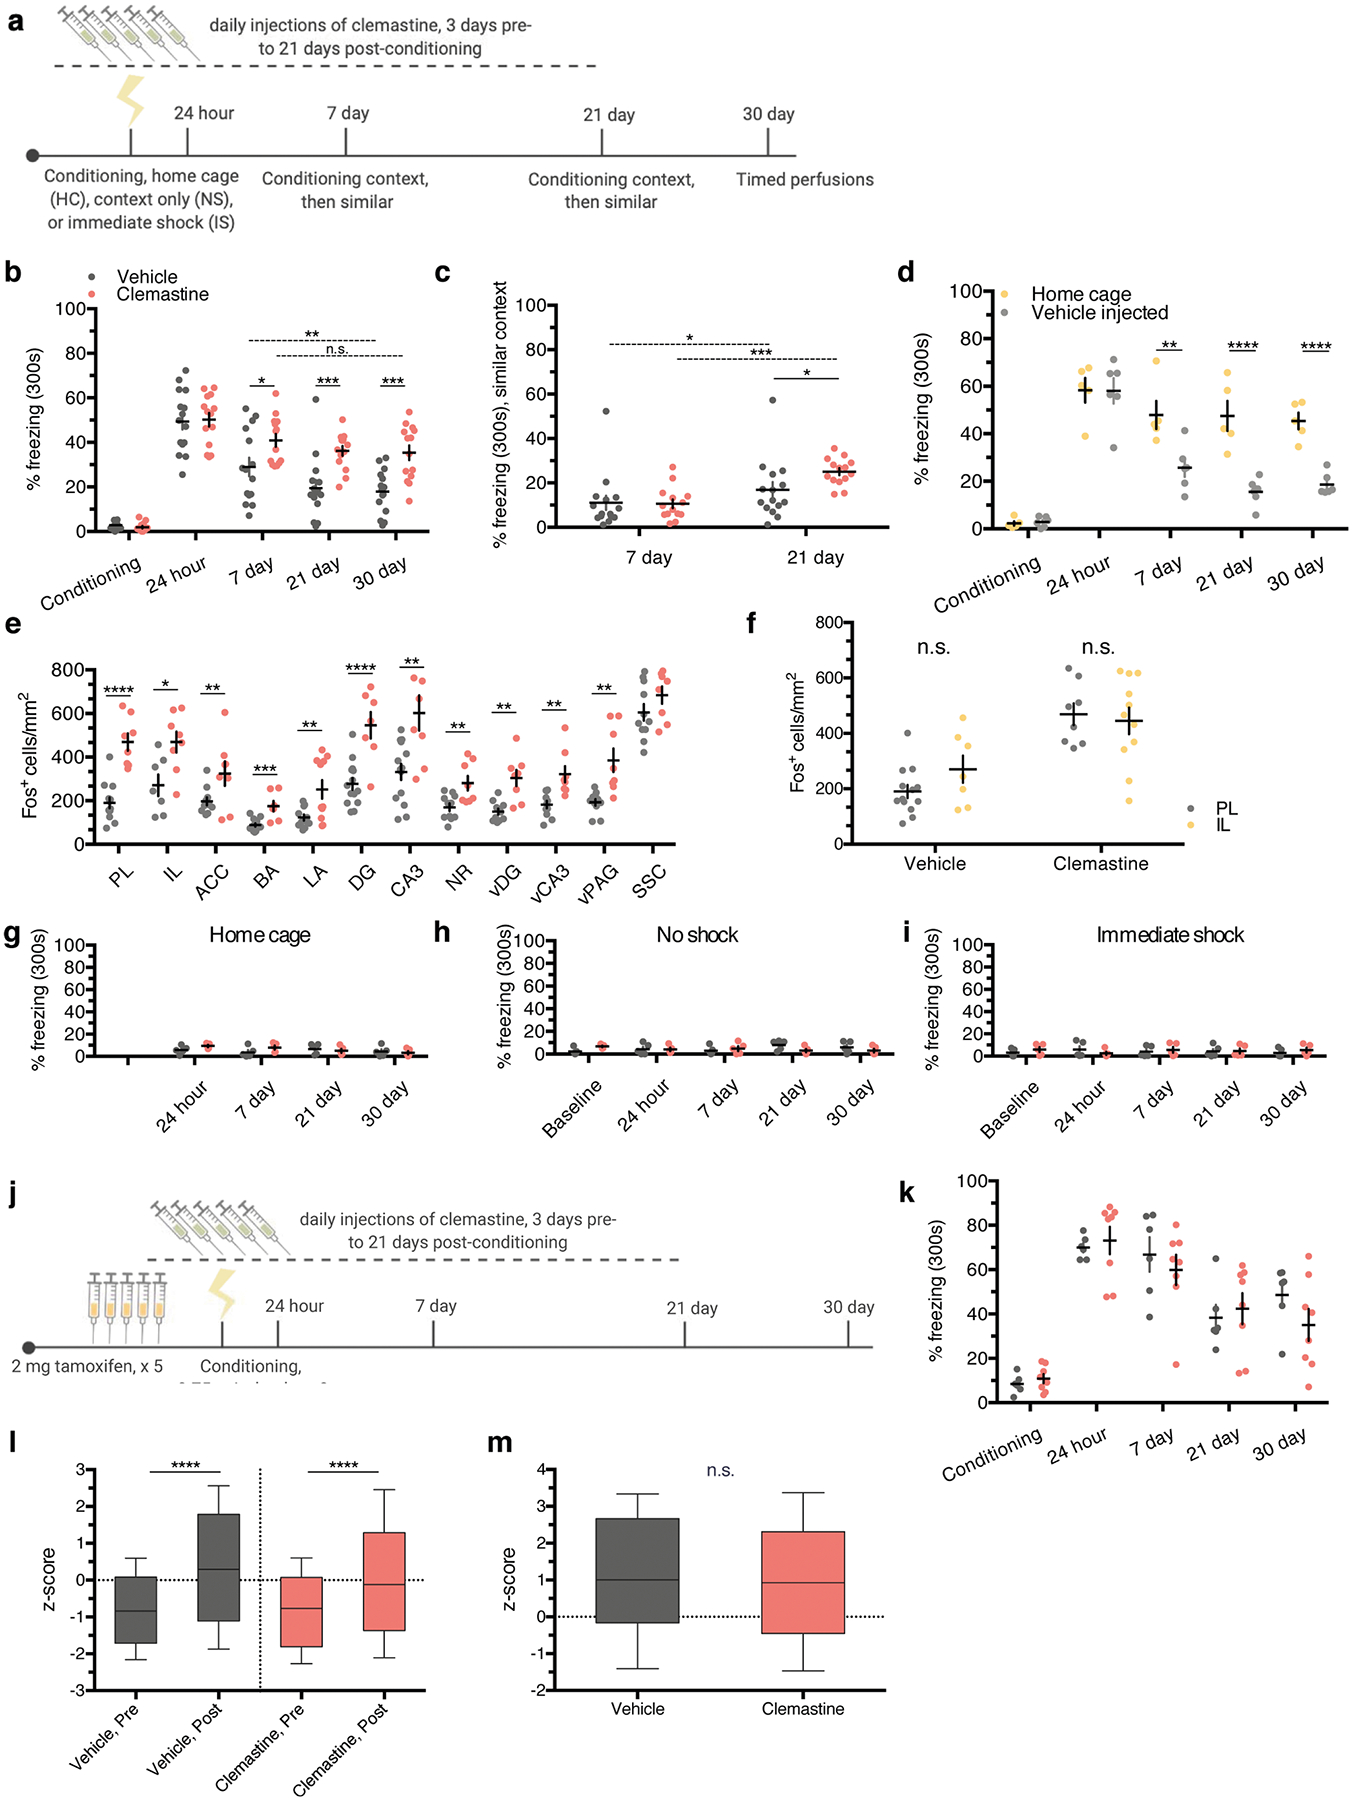
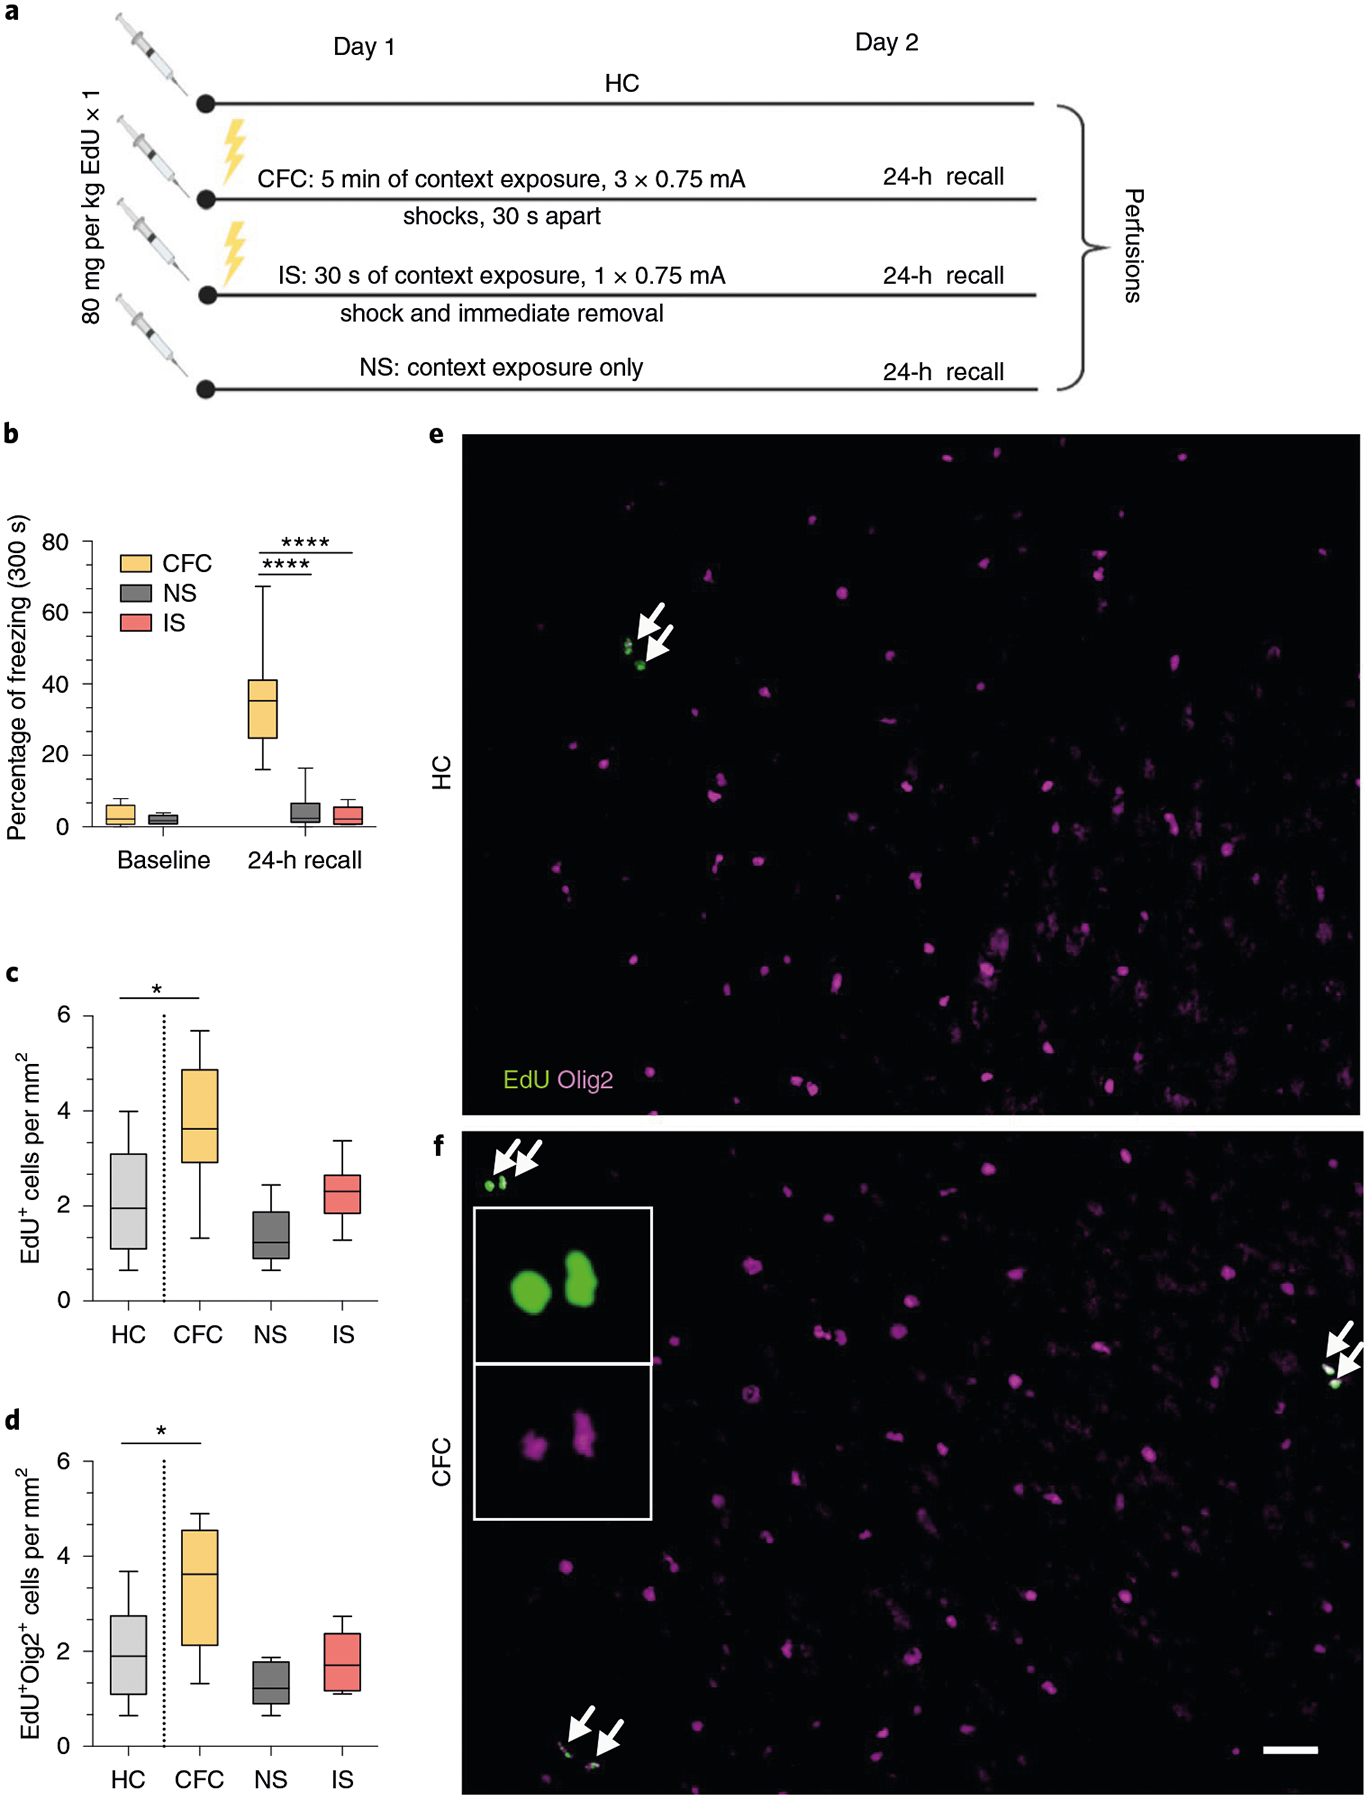
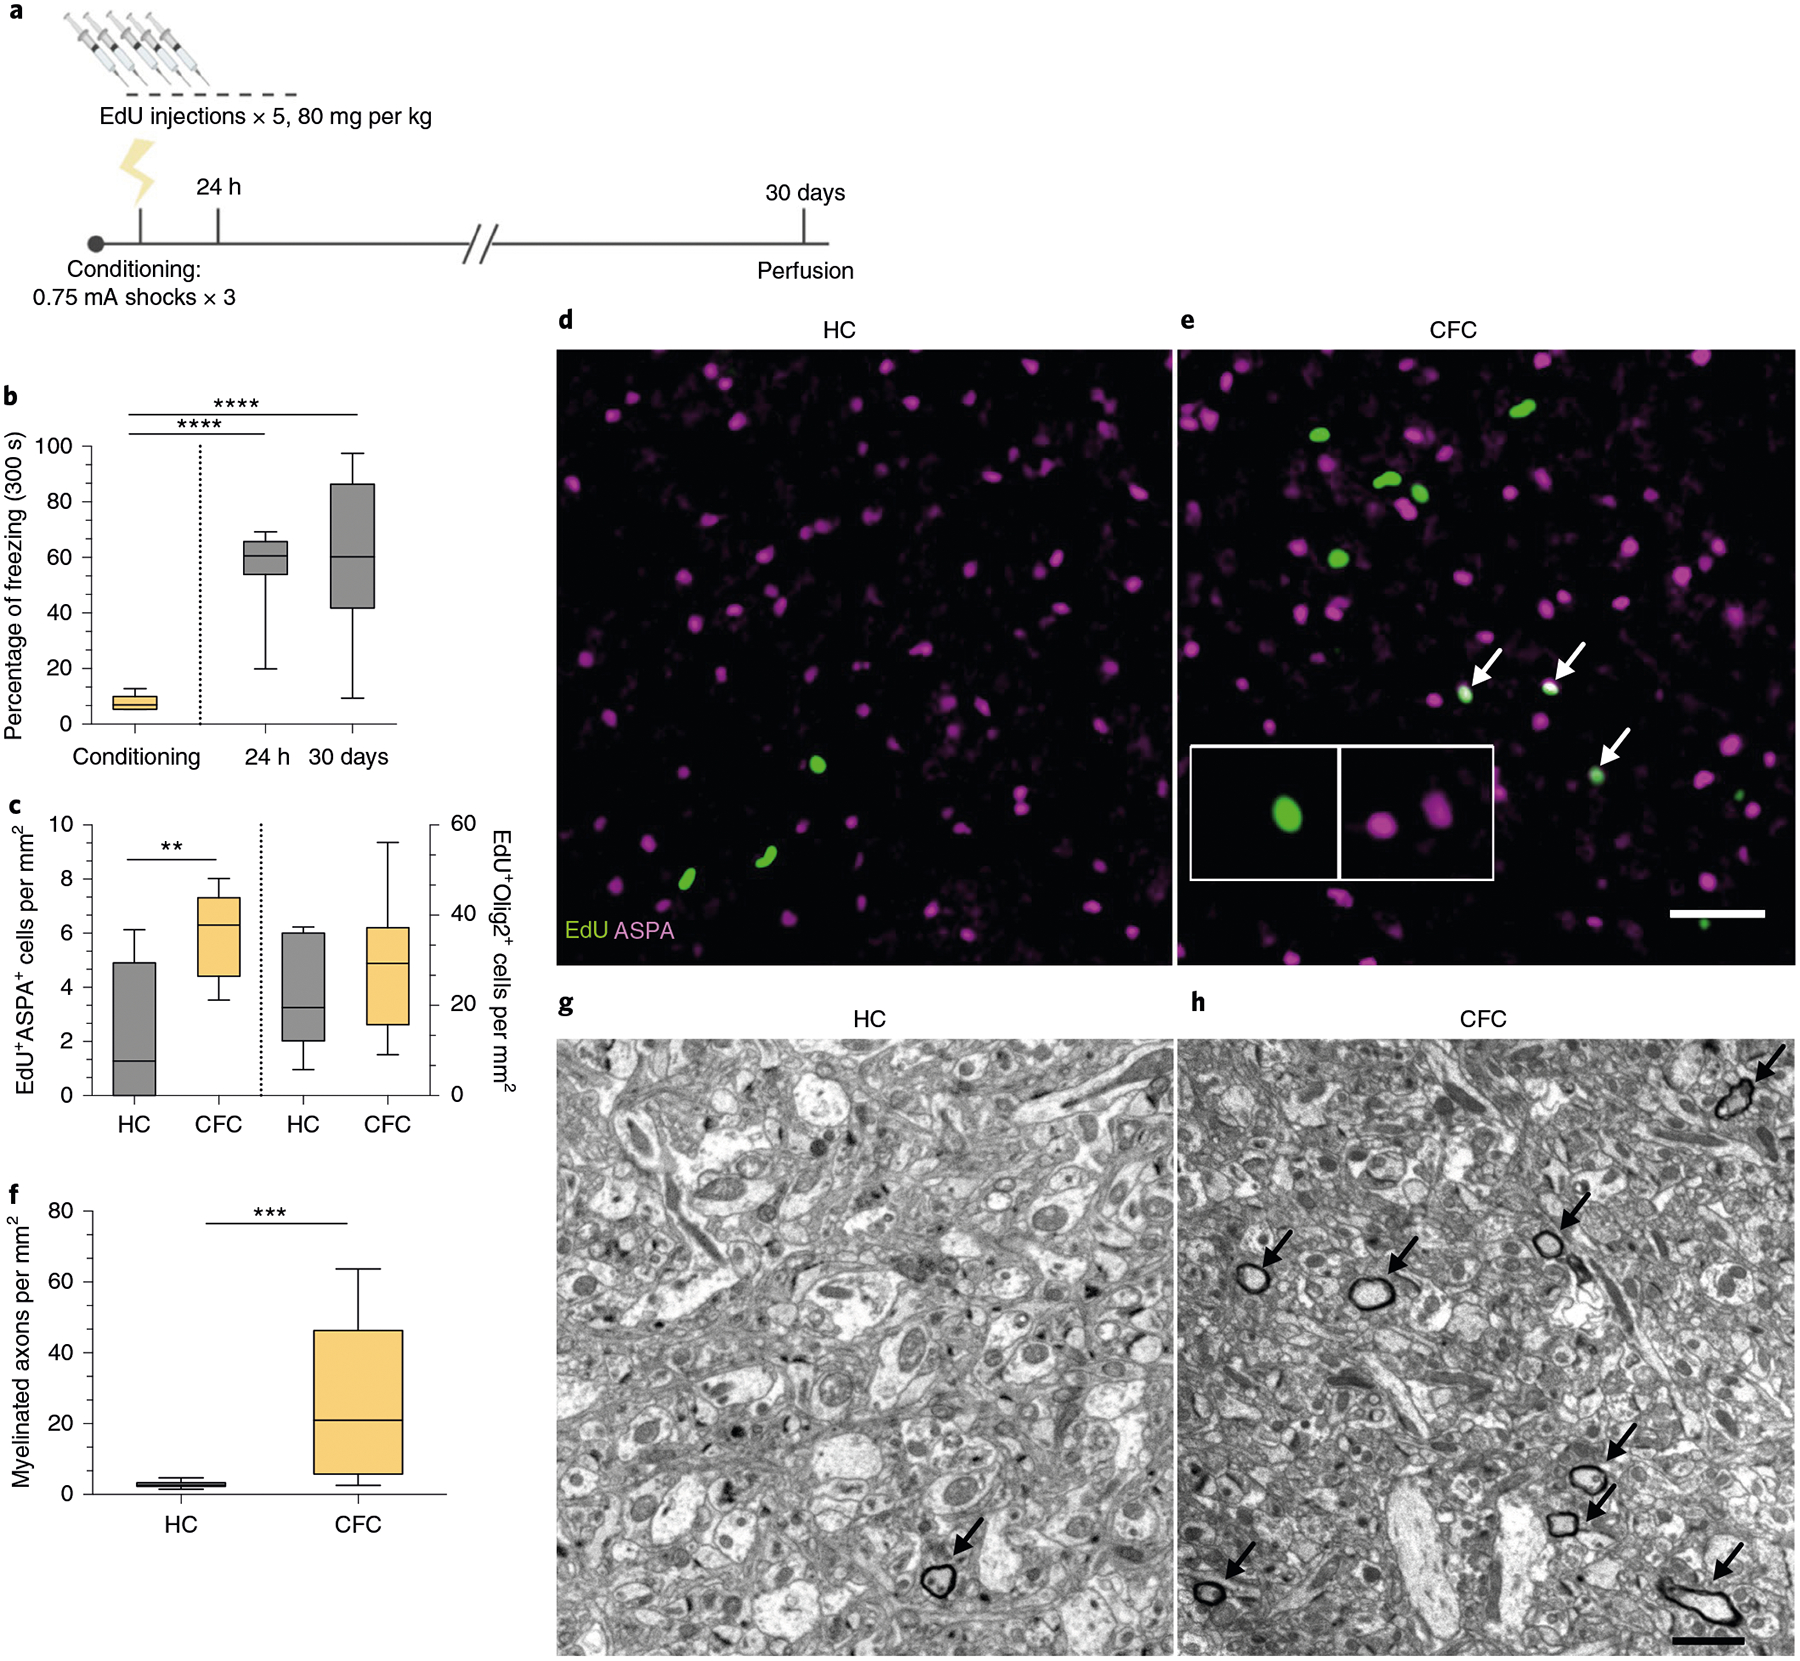
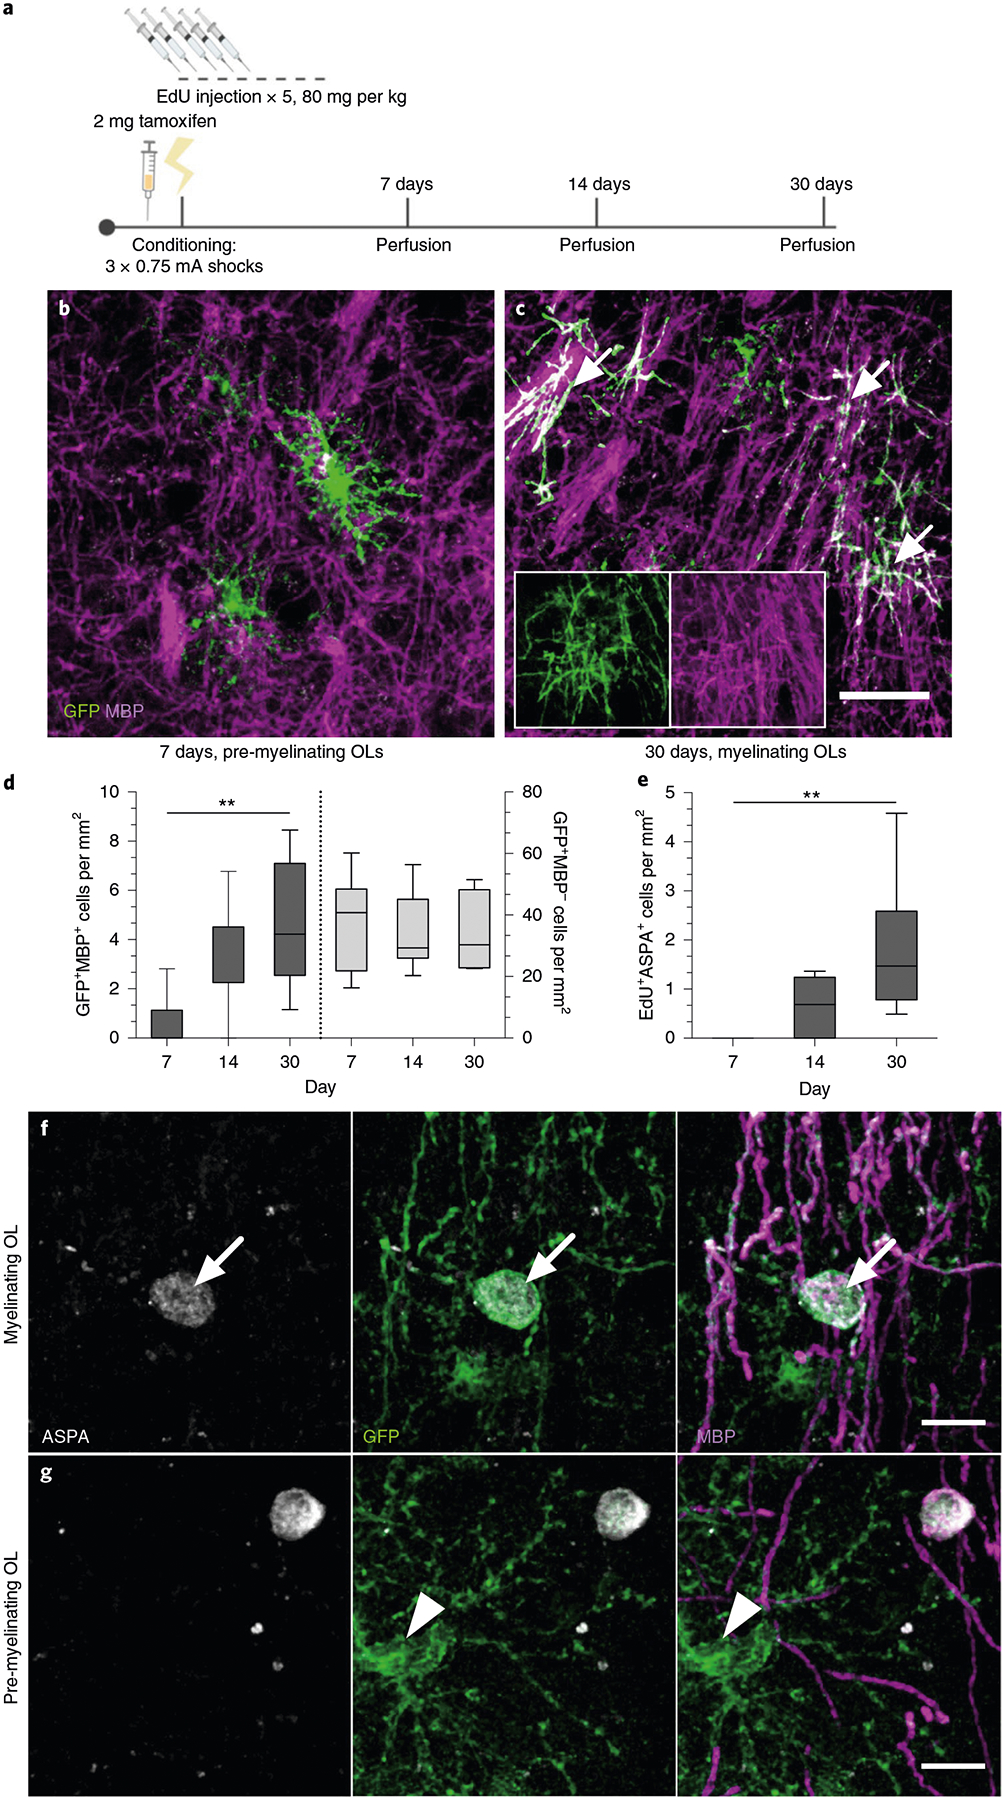
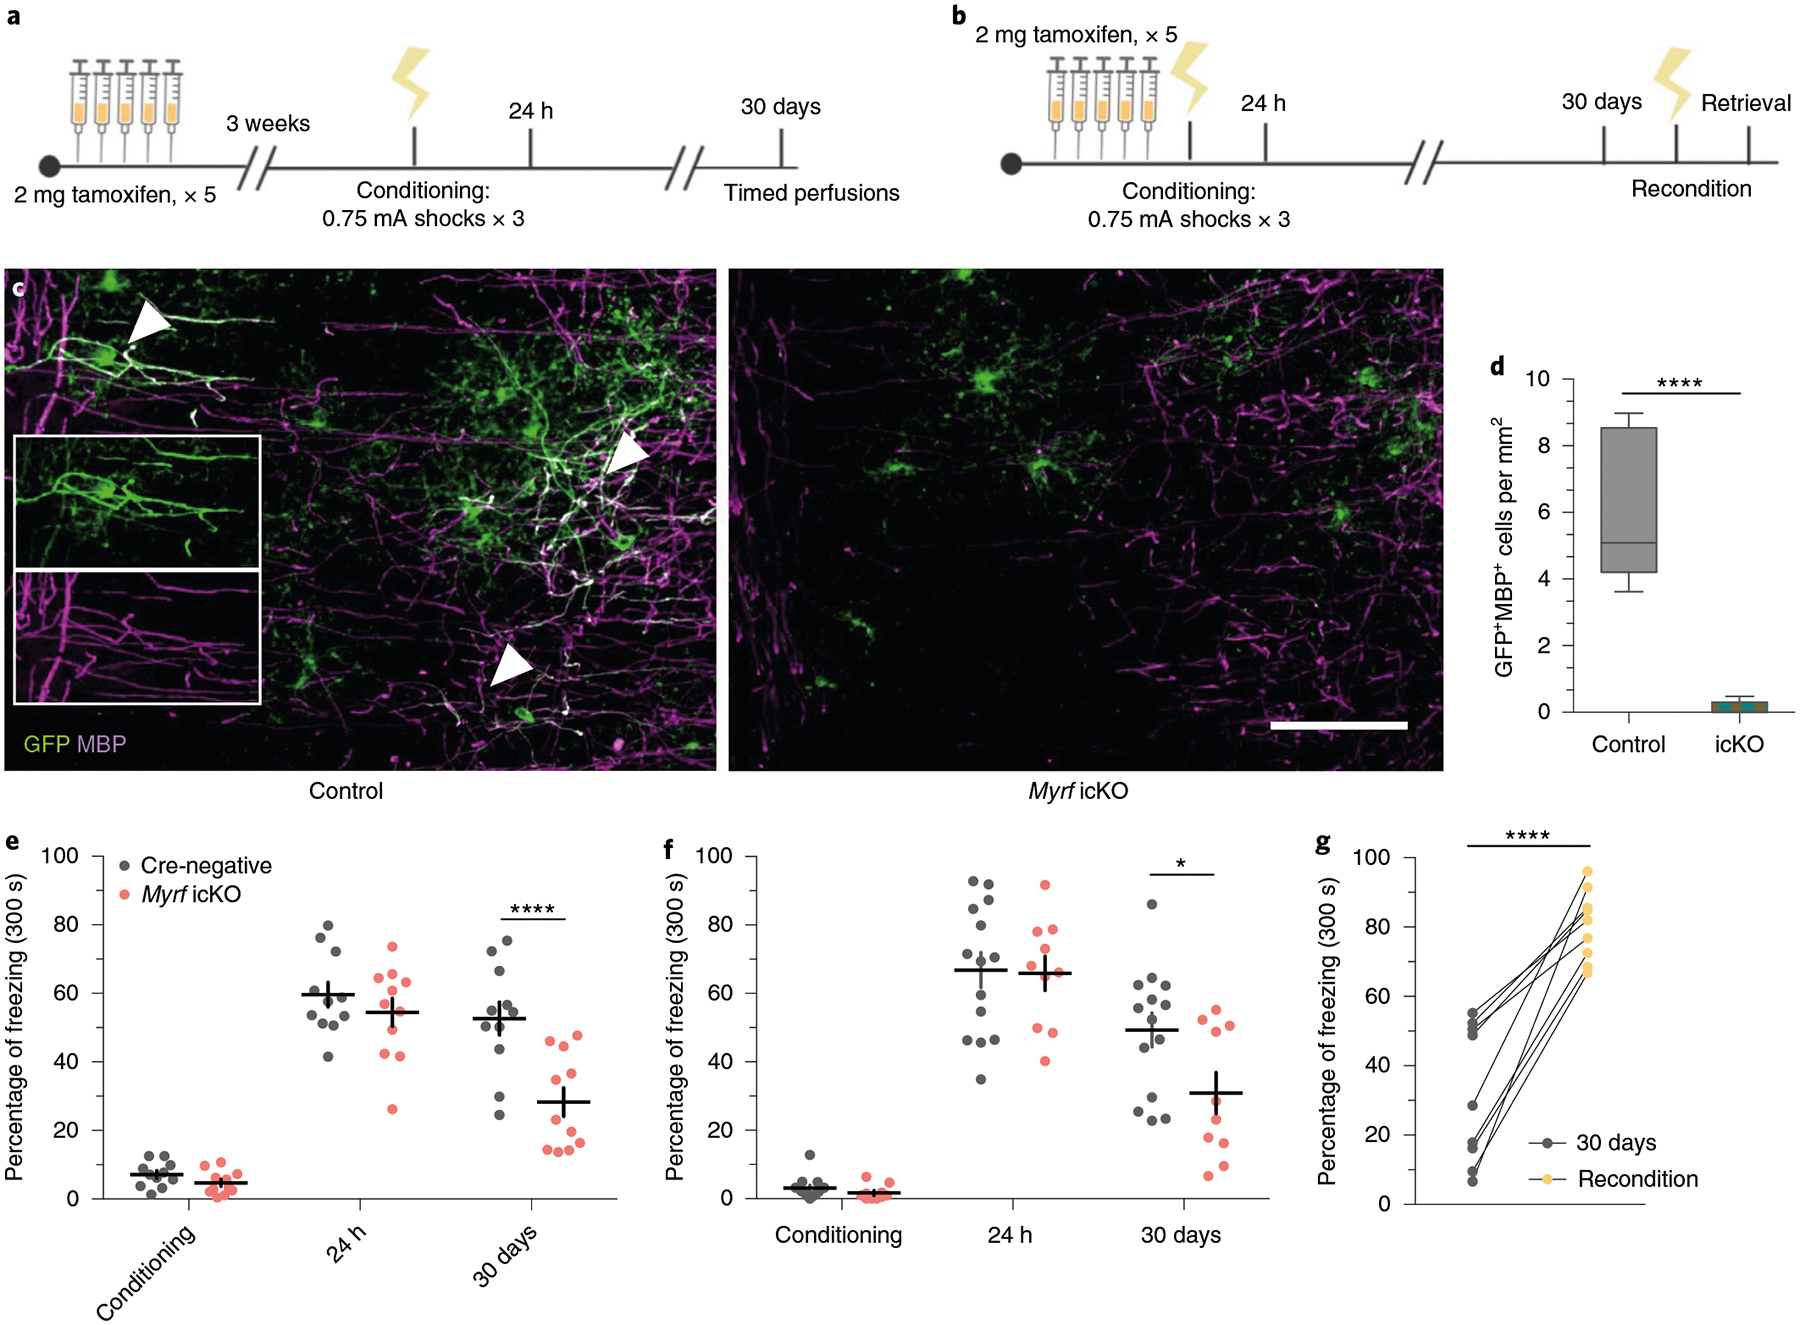
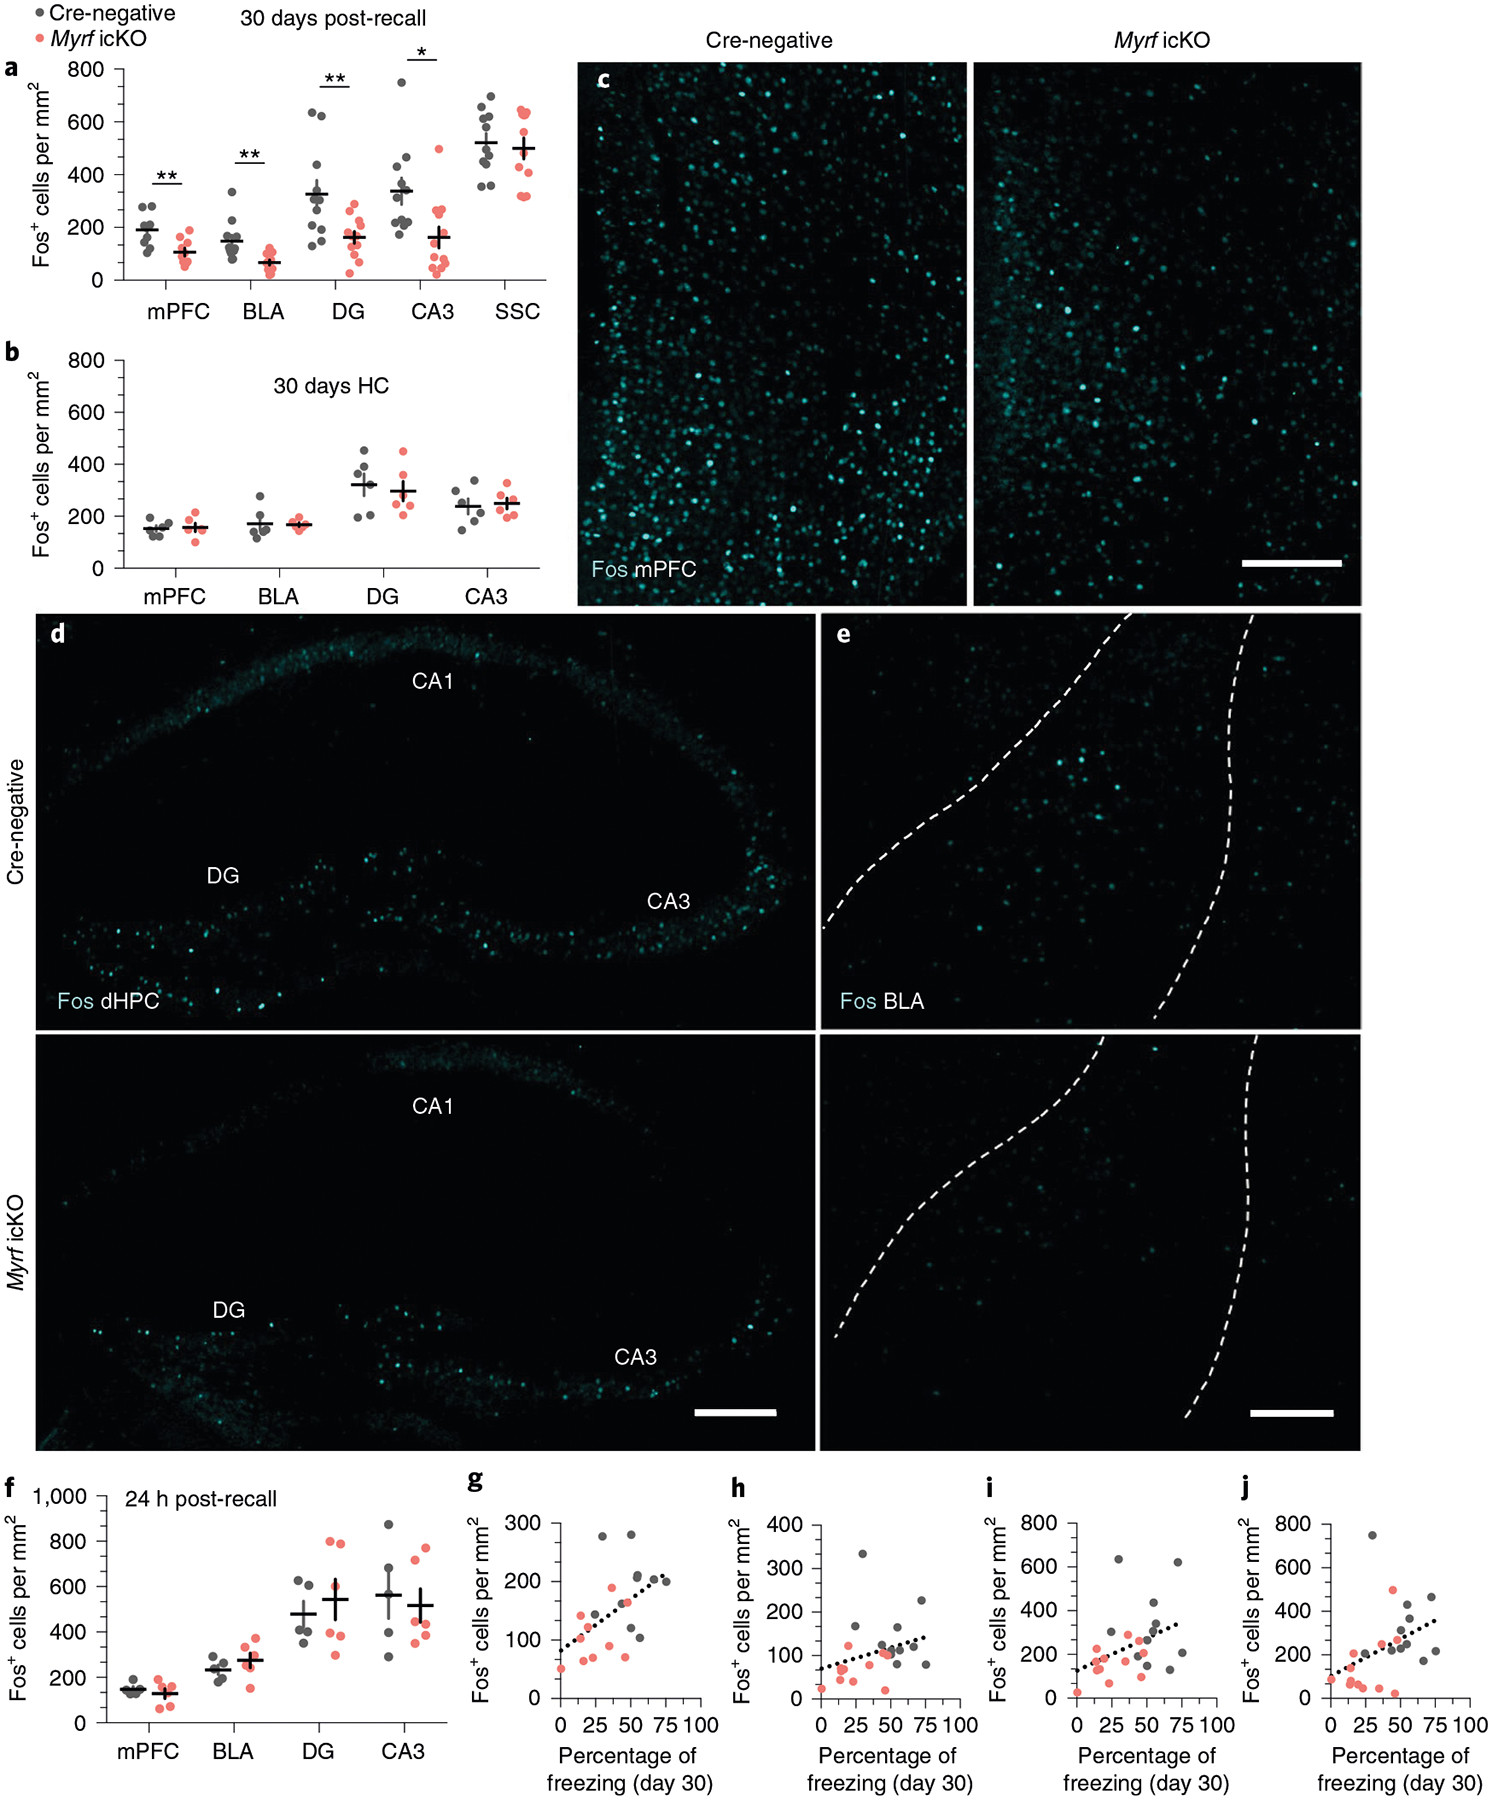
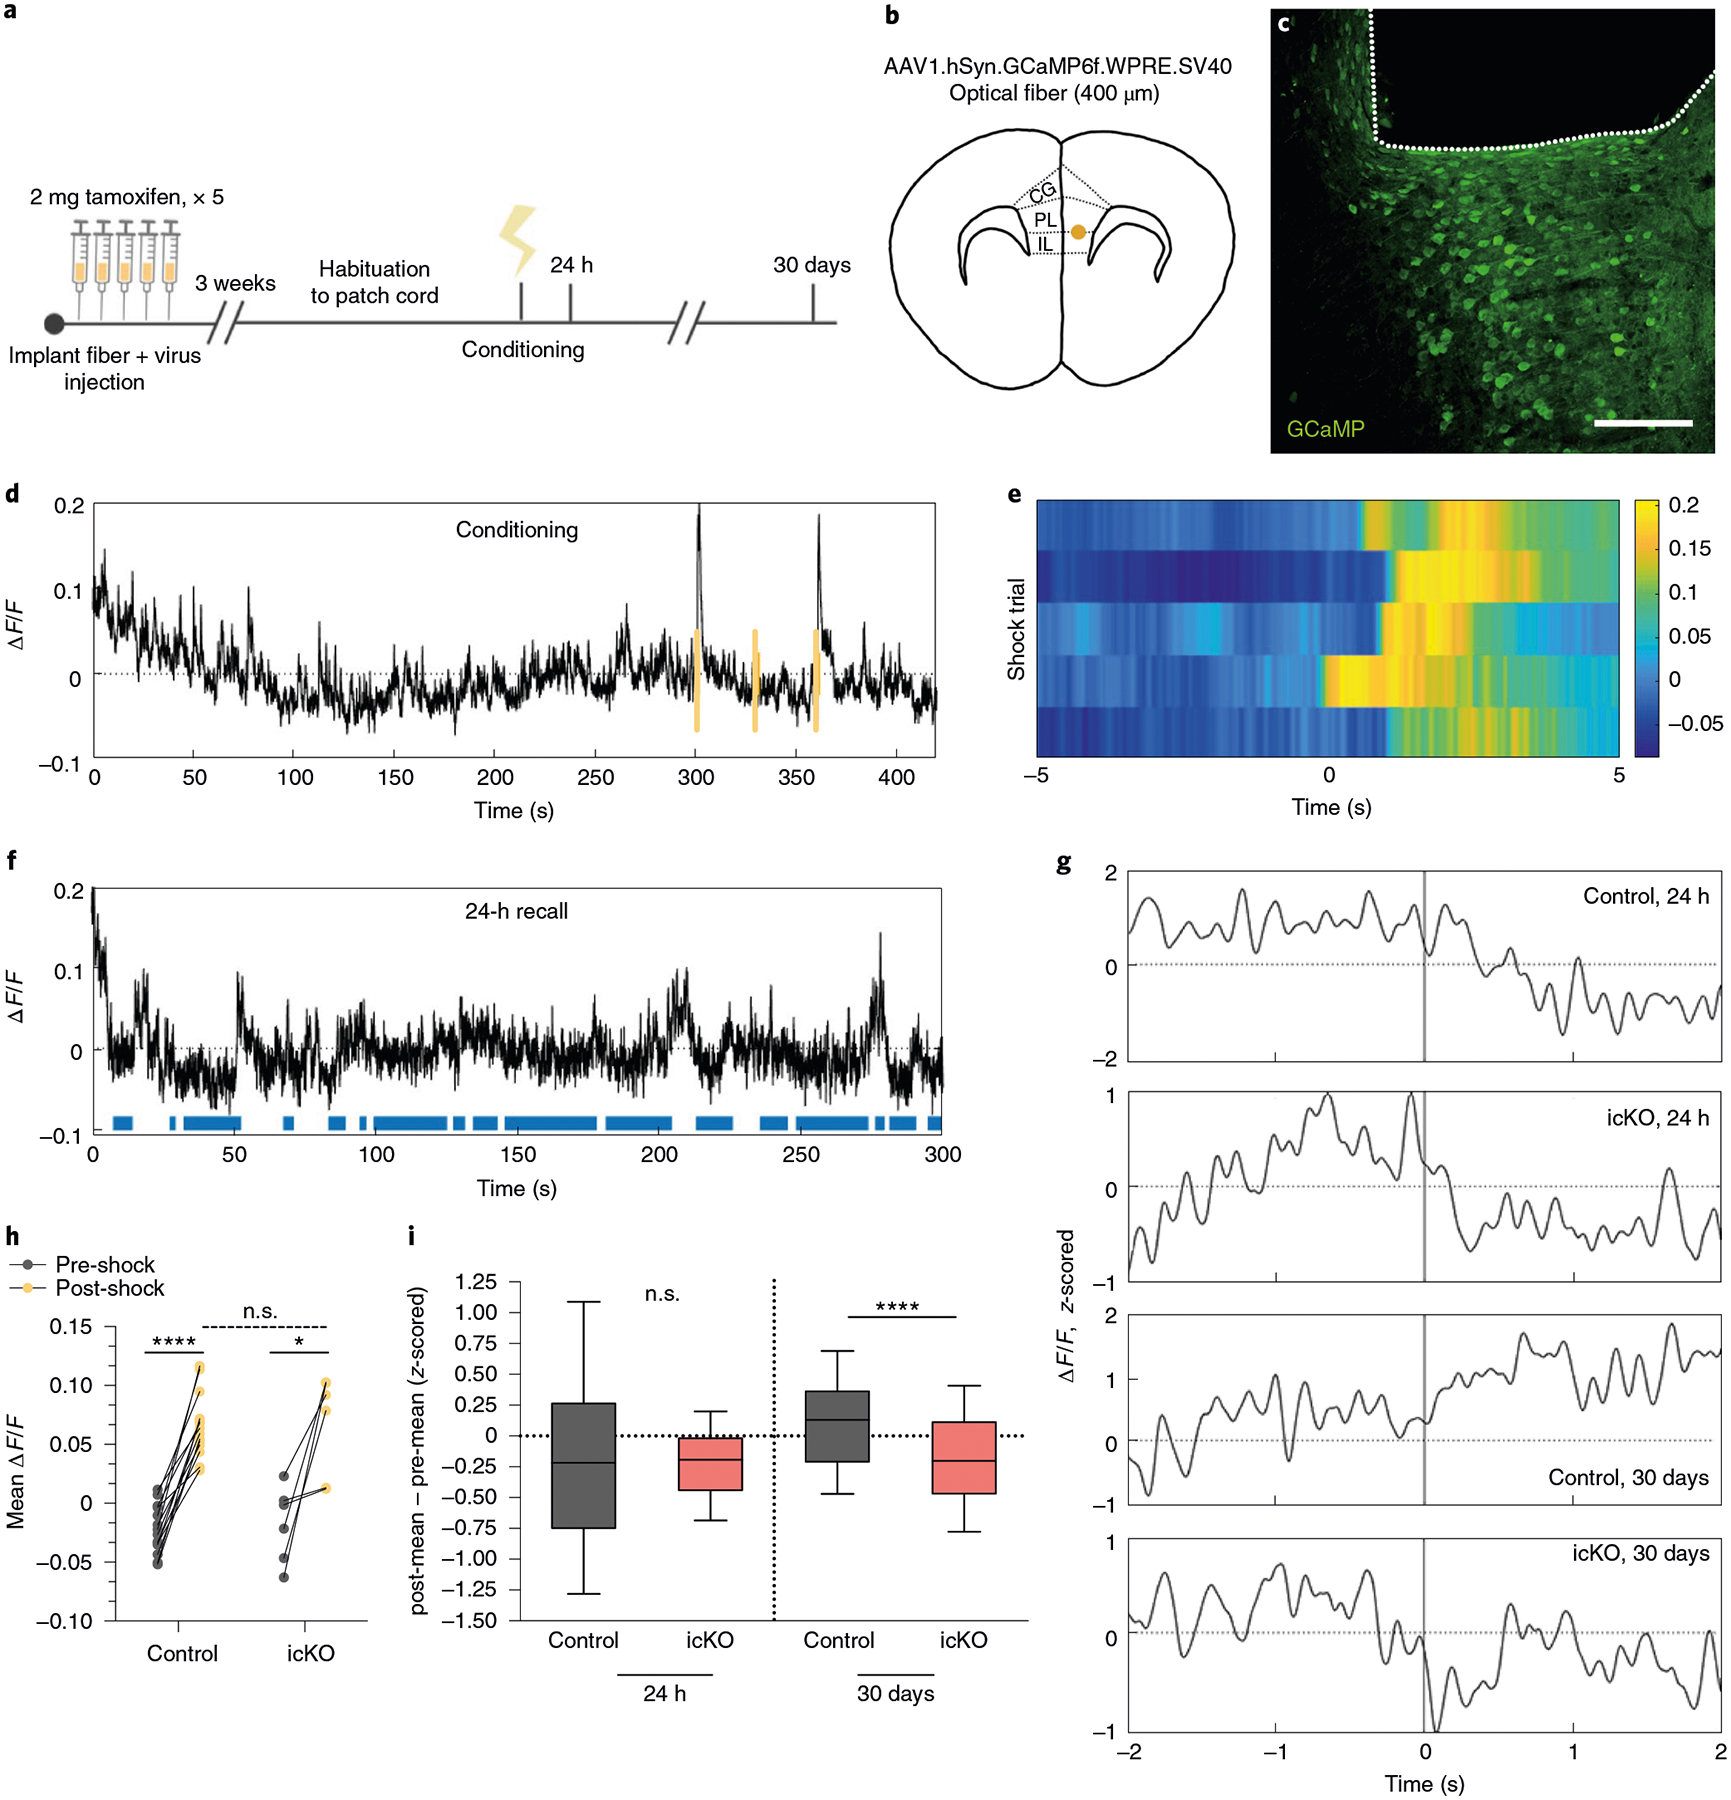
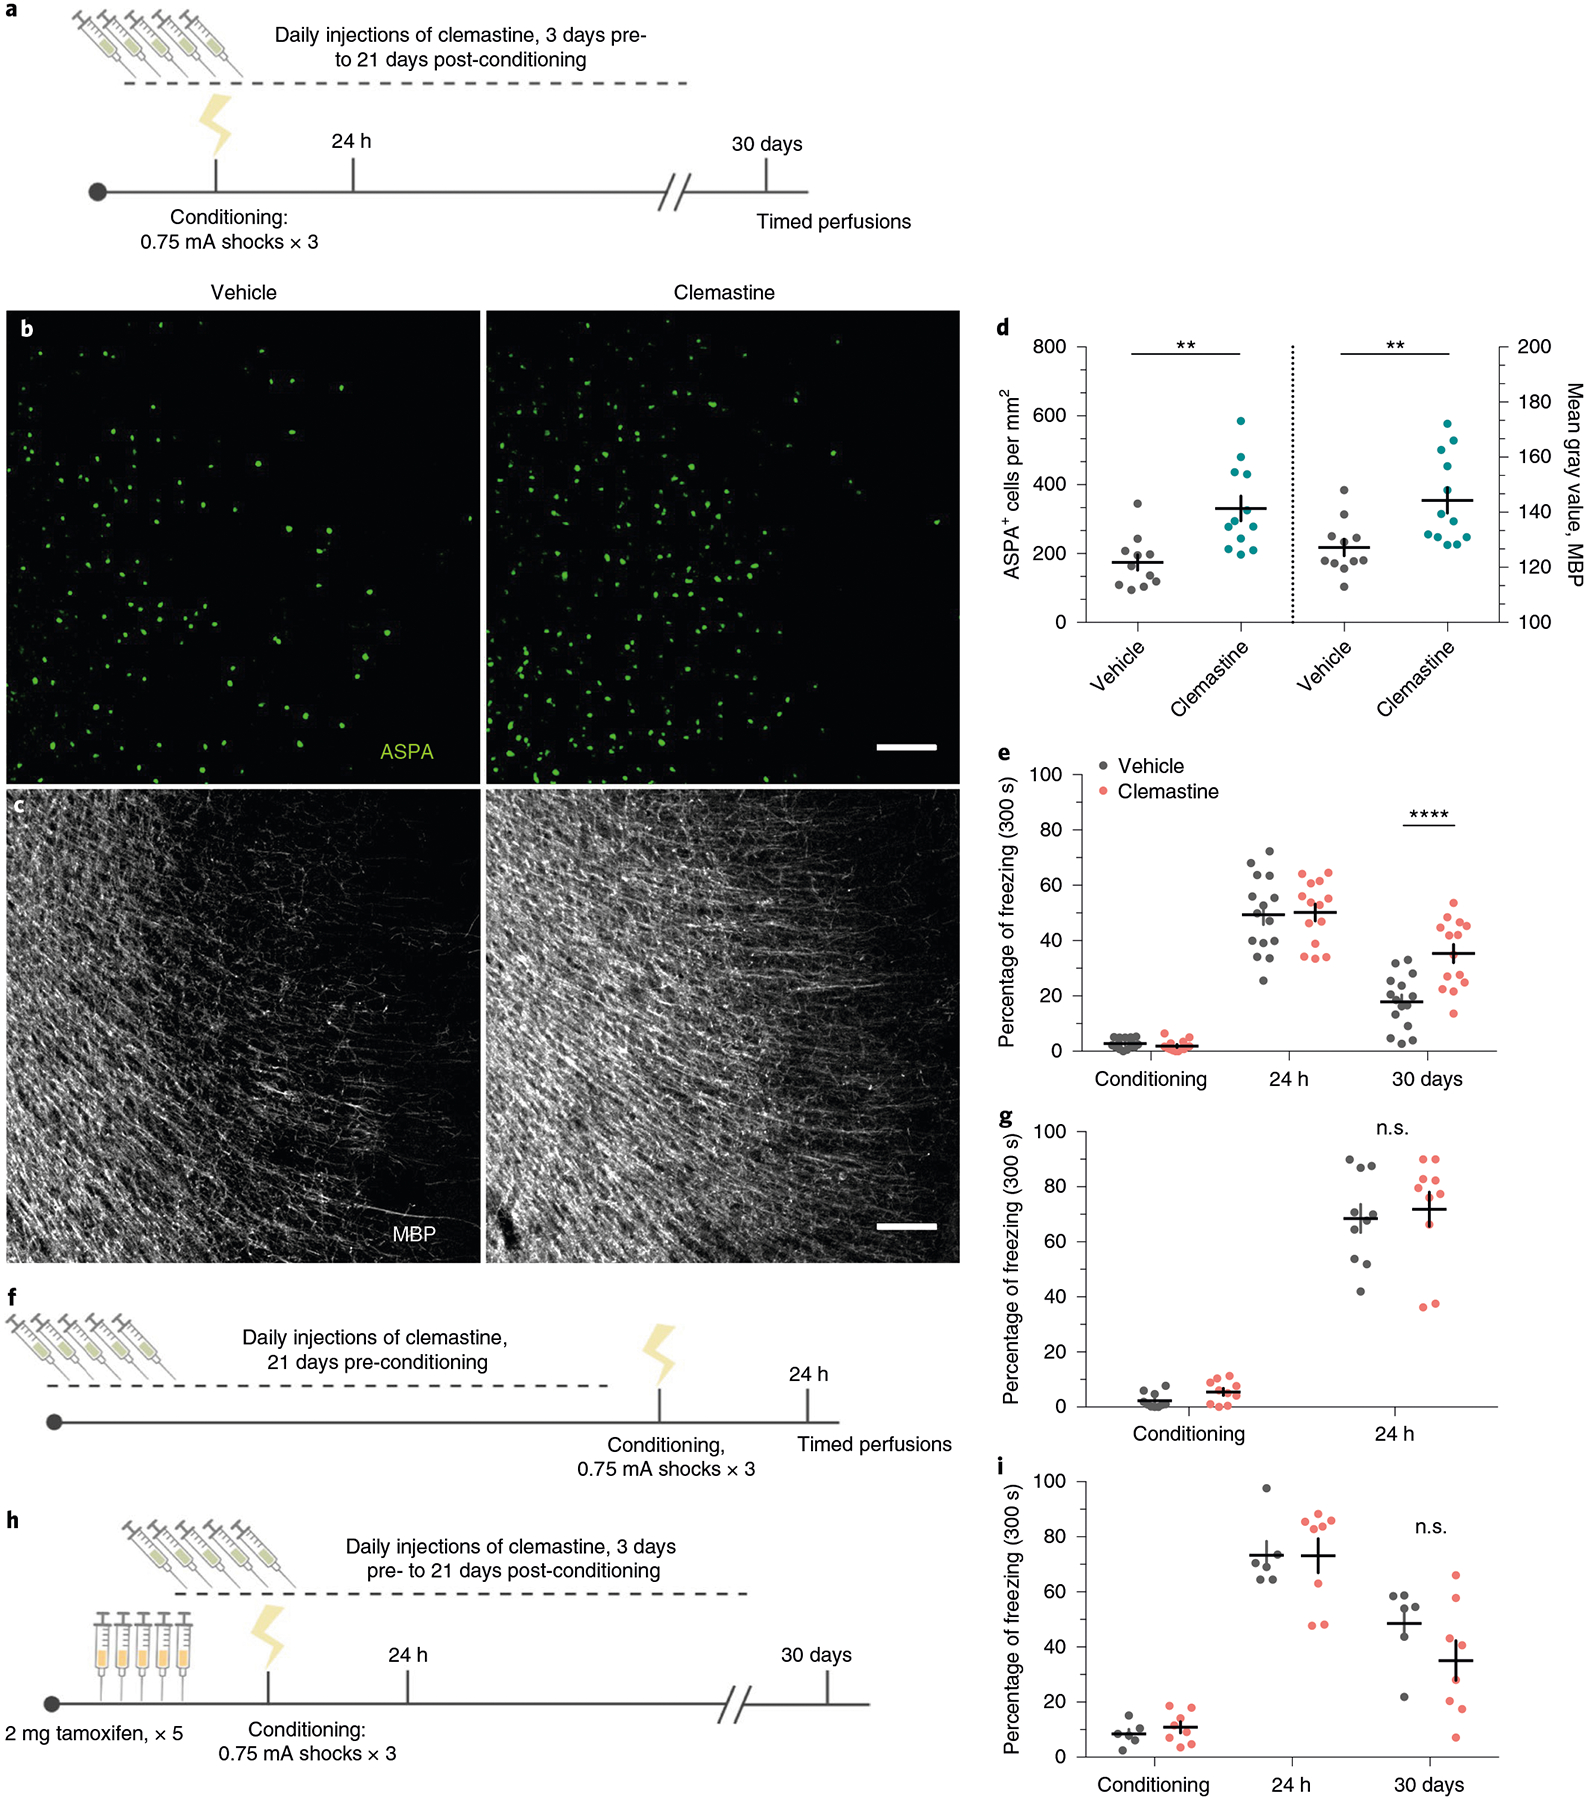
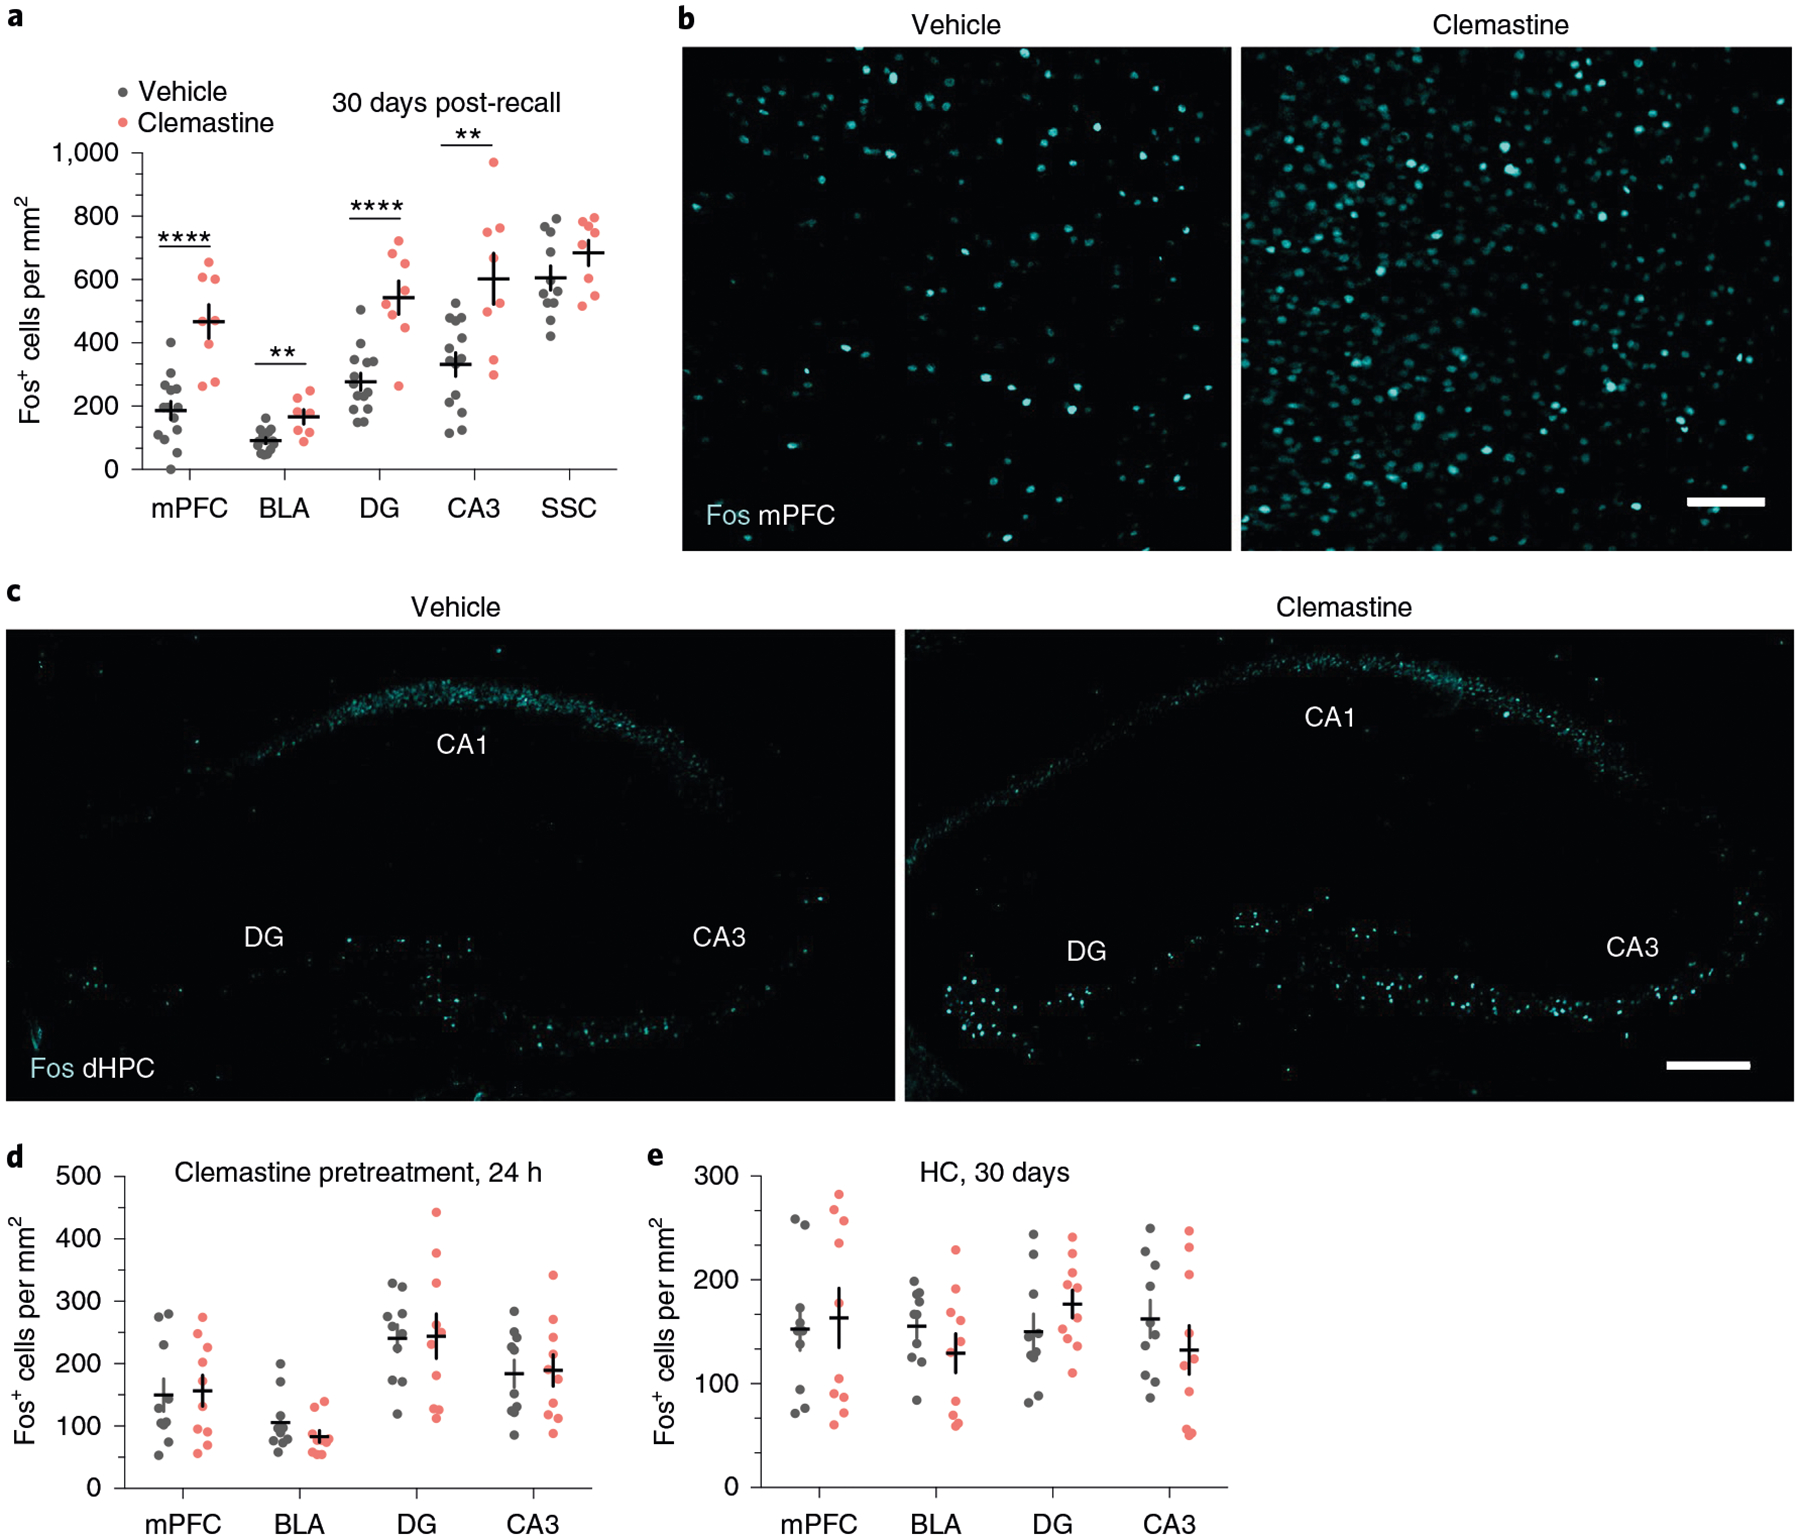
Experience-dependent myelination is hypothesized to shape neural circuit function and subsequent behavioral output. Using a contextual fear memory task in mice, we demonstrate that fear learning induces oligodendrocyte precursor cells to proliferate and differentiate into myelinating oligodendrocytes in the medial prefrontal cortex. Transgenic animals that cannot form new myelin exhibit deficient remote, but not recent, fear memory recall. Recording population calcium dynamics by fiber photometry, we observe that the neuronal response to conditioned context cues evolves over time in the medial prefrontal cortex, but not in animals that cannot form new myelin. Finally, we demonstrate that pharmacological induction of new myelin formation with clemastine fumarate improves remote memory recall and promotes fear generalization. Thus, bidirectional manipulation of myelin plasticity functionally affects behavior and neurophysiology, which suggests that neural activity during fear learning instructs the formation of new myelin, which in turn supports the consolidation and/or retrieval of remote fear memories.


Conflict of interest statement

Competing interests

The authors declare no competing interests.

Figures

Extended Data Fig. 1 |
Extended Data Fig. 1 |. Proliferation, differentiation, and maturation of oPCs following fear learning.
a, EdU+ cell density of home cage (HC), fear conditioned (CFC), no shock (NS), and immediate shock (IS) animals 24 hours post-conditioning; unpaired two-tailed t-tests comparing HC vs. CFC for PL (difference: 2.060 ± 0.8565, 95% CI: 0.1942 to 3.927, t12 = 2.406, p = 0.0332), IL (difference: 2.239 ± 0.8566, 95% CI: 0.3731 to 4.106, t12 = 2.614, p = 0.0226), ACC (difference: 1.176 ± 0.5811, 95% CI: −0.09067 to 2.442, t12 = 2.406, p = 0.0760), BLA (difference: 3.865 ± 1.395, 95% CI: 0.8506 to 6.880, t12 = 2.77, p = 0.0159), dHPC (difference: 2.060 ± 0.8565, 95% CI: 0.1942 to 3.927, t12 = 2.406, p = 0.6694), vHPC (difference: 0.2300 ± 0.5265, 95% CI: −0.9075 to 1.368, t12 = 0.4369, p = 0.3128), paired two-tailed t-test comparing PL vs. IL for CFC animals (difference: −0.1025 ± 0.7635, 95% CI: −1.971 to 1.766, t6 = 0.1343, p = 0.8975). b, EdU+/Olig2+ cell density at 24 hours post-conditioning; unpaired two-tailed t-tests comparing HC vs. CFC for PL (difference: 1.801 ± 0.7408, 95% CI: 0.1867 to 3.415, t12 = 2.431, p = 0.0317), IL (difference: 1.547 ± 0.6297, 95% CI: 0.1750 to 2.919, t12 = 2.457, p = 0.0302), ACC (difference: 0.2161 ± 0.5518, 95% CI: −0.9863 to 1.418, t12 = 0.3916, p = 0.7022), BLA (difference: 3.619 ± 1.338, 95% CI: 0.7295 to 6.509, t12 = 2.706, p = 0.018), dHPC (difference: 0.2882 ± 0.4868, 95% CI: −0.7634 to 1.340, t12 = 0.592, p = 0.564), vHPC (difference: −0.008014 ± 0.5297, 95% CI: −1.162 to 1.146, t12 = 0.01513, p = 0.9882), paired two-tailed t-test comparing PL vs. IL for CFC animals (difference: −0.2322 ± 0.4552, 95% CI: −1.346 to 0.8817, t12 = 0.5102, p = 0.6289). For (a-b), n = 7 mice (HC), 8 mice (CFC), 7 mice (NS), 8 mice (IS). c, EdU+/ASPA+ density post-conditioning; unpaired two-tailed t-tests HC vs. CFC for PL (difference: 3.576 ± 1.006, 95% CI: 1.404 to 5.749, t13 = 3.556, p = 0.035), IL (difference: 2.472 ± 0.7097, 95% CI: 0.9503 to 3.995, t13 = 0.5102, p = 0.037), ACC (difference 0.9596 ± 0.5516, 95% CI: −0.2234 to 2.143, t13 = 0.5102, p = 0.1038), BLA (difference: 1.520 ± 2.071, 95% CI: −3.165 to 6.204, t13 = 0.7339, p = 0.4817), dHPC (difference: 0.3704 ± 0.5950, 95% CI: −0.9150 to 1.656, t13 = 0.6225, p = 0.5444), vHPC (difference: 0.0536 ± 0.6227, 95% CI: −1.303 to 1.410, t13 = 0.086, p = 0.9328), paired two-tailed t-test comparing PL vs. IL for CFC animals (difference: −0.9171 ± 0.7719, 95% CI: −2.742 to 0.9081, t13 = 1.188, p = 0.5466). d, EdU+/Olig2+ density 30 days post-conditioning; unpaired two-tailed t-tests HC vs. CFC for PL (difference: 4.512 ± 5.558, 95% CI: −7.599 to 16.62, t13 = 0.8117, p = 0.4328), IL (difference: 4.514 ± 6.705, 95% CI: −10.10 to 19.12, t13 = 0.6731, p = 0.5136), ACC (difference: 3.086 ± 6.324, 95% CI: −10.69 to 16.86, t13 = 0.488, p = 0.6343), BLA (difference: 19.00 ± 11.32, 95% CI: −5.452 to 43.45, t13 = 1.679, p = 0.1171), dHPC (difference: 4.325 ± 2.933, 95% CI: −2.011 to 10.66, t13 = 1.475, p = 0.1641), vHPC (difference: −0.8542 ± 3.854, 95% CI: −9.251 to 7.543, t13 = 0.2216, p = 0.8283), paired two-tailed t-test comparing PL vs. IL for CFC animals (difference: −4.630 ± 6.858, 95% CI: −21.41 to 12.15, t13 = 0.6751, p = 0.5248). For (c-d), n = 7 mice (HC) and 8 mice (CFC). Quantification of GFP+/MBP+ (e), GFP+/MBP (f), and EdU+/ASPA+ (g) cell density in the dHPC and BLA; n = 6 mice (7 days), 9 mice (14 days), and 7 mice (30 days). e-g One-way ANOVA with Sidak’s post hoc tests comparing cell densities across days; (e) BLA: F2,19 = 4.369, p = 0.0275, 7 vs. 14 day, (difference: −3.760 ± 1.672, 95% CI: −7.818 to 0.2981, p = 0.0718), 7 vs. 30 day (difference: −5.041 ± 1.765, 95% CI: −9.324 to −0.7572, p = 0.0201), dHPC: F2,22 = 5.397, p = 0.0124, 7 vs. 14 day, (difference: −3.108 ± 1.241, 95% CI: −6.086 to −0.1300, p = 0.0399), 7 vs. 30 day (difference: −4.124 ± 1.303, 95% CI: −7.251 to −0.9968, p = 0.009); (f) BLA: F2,19 = 0.07572, p = 0.9274, 7 vs. 14 day, (difference: 2.354 ± 6.908, 95% CI: −14.41 to 19.12, p = 0.9308), 7 vs. 30 day (difference: 2.540 ± 7.292, 95% CI: −15.16 to 20.24, p = 0.9279), dHPC: F2,20 = 0.4852, p = 0.6226, 7 vs. 14 day, (difference: 1.629 ± 3.759, 95% CI: −7.456 to 10.71, p = 0.8907), 7 vs. 30 day (difference: −1.900 ± 4.049, 95% CI: −11.69 to 7.888, p = 0.8733); (g) BLA: F2,18 = 47.49, p < 0.0001, 7 vs. 14 day, (difference: −0.6155 ± 0.6763, 95% CI: −2.265 to 1.034, p = 0.6092), 7 vs. 30 day (difference: −5.632 ± 0.6565, 95% CI: −7.233 to −4.031, p < 0.0001), dHPC: F2,16 = 46.74, p < 0.0001, 7 vs. 14 day, (difference: −0.03272 ± 0.7020, 95% CI: −1.764 to 1.699, p = 0.9987), 7 vs. 30 day (difference: −6.038 ± 0.7285, 95% CI: −7.835 to −4.242, p < 0.0001). h, Proportion of GFP+/MBP+ cells that are ASPA+ (left bars) and the proportion of ASPA+/GFP+ cells that are MBP+ (right bars) at 30 days post-conditioning; n = 7 mice. Representative DAPI (gray) images the sub-regional dHPC (i) and amygdalar (j) cytoarchitecture, scale bars: 250 μm (k) Schematic of the sampled area within the mPFC (green rectangle); dashed lines demarcate the approximate region cut for electron microscopy. For box-and-whisker plots, the center, boxes, and whiskers represent the median, interquartile range, and the 10th and 90th percentiles, with asterisks indicating the following p-value ranges: * ≤ 0.05, ** ≤ 0.01, *** ≤ 0.001, **** ≤ 0.0001.
Extended Data Fig. 2 |
Extended Data Fig. 2 |. overall myelination status and microglial density are unchanged in the absence of new myelin formation.
a, Representative images of ASPA (green) staining in the PFC of cre-negative and Myrf icKO mice 30 days post-conditioning, quantified in (b); unpaired two-tailed t-test, difference: −26.50 ± 26.20, 95% CI: −81.15 to 28.15, t20 = 1.012, p = 0.3238, n = 11 mice per genotype. c, Representative images of MBP (gray) staining in the PFC of cre-negative and Myrf icKO mice 30 days post-conditioning, quantified in (d); unpaired two-tailed t-test, difference: 0.1927 ± 12.13, 95% CI: −25.12 to 25.50, t20 = 2.406, p = 0.9875, n = 11 mice per genotype. e, Representative images of Iba1 (magenta) staining in the PFC of cre-negative and Myrf icKO mice 30 days post-conditioning, quantified in (f); unpaired two-tailed t-test, difference: −3.698 ± 29.55, 95% CI: −69.53 to 62.14, t10 = 0.1251, p = 0.9029, n = 6 mice per genotype. Scale bars: 100 μm (a,c,e). Data are presented as mean ± SEM.
Extended Data Fig. 3 |
Extended Data Fig. 3 |. inhibition of new myelin formation impairs remote fear memory recall.
a, Extended experimental timeline for cohort represented in Fig. 4a,e, quantified in (e); two-way ANOVA (F4,80 = 3.437, p = 0.0121) with Sidak’s post hoc tests comparing cre-negative vs. Myrf icKO during conditioning (difference: −2.416 ± 5.790, 95% CI: −17.58 to 12.74, p = 0.9965), 24 hour (difference: −5.169 ± 5.790, 95% CI: −20.33 to 9.991, p = 0.9040), 7 day (difference: −9.901 ± 5.790, 95% CI: −25.06 to 5.260, p = 0.9040), 21 day (difference: −12.35 ± 5.790, 95% CI: −27.51 to 2.811, p = 0.3772), and 30 day (difference: −24.37 ± 5.790, 95% CI: −39.53 to −9.209, p = 0.0003), and comparing 7 day (difference: 5.685 ± 5.685, 95% CI: −6.004 to 17.37, p = 0.6277), 21 day (difference: 17.05 ± 17.05, 95% CI: 5.361 to 28.74, p = 0.0015), and 30 day (difference: 26.18 ± 26.18, 95% CI: 14.49 to 37.87, p < 0.0001) to 24 hour freezing within Myrf icKO animals, n = 11 animals per genotype. b, Extended experimental timeline for cohort represented in Fig. 4b,f,g, quantified in (f); two-way ANOVA (F4,80 = 1.435, p = 0.2291) with Sidak’s post hoc tests comparing cre-negative vs. Myrf icKO during conditioning (difference 1.467 ± 7.398, 95% CI: −13.19 to 16.13, p = 0.8431), 24 hour (difference: 0.9199 ± 7.398, 95% CI: −13.74 to 15.58, p = 0.9013), 7 day (difference: −1.946 ± 7.398, 95% CI: −16.61 to 12.71, p = 0.7930), 21 day (difference: 6.165 ± 7.398, 95% CI: −8.496 to 20.83, p = 0.4064), and 30 day (difference: 18.43 ± 7.398, 95% CI: 3.767 to 33.09, p = 0.0142), n = 14 cre-negative and 10 Myrf icKO mice. c, Experimental timeline for cohort in which tamoxifen was administered after 24 hour recall, quantified in (h); two-way ANOVA (F4,72 = 1.724, p = 0.1541), n = 10 animals per genotype. d, Experimental timeline for cohort in which tamoxifen was administered seven weeks prior to conditioning, quantified in (h); two-way ANOVA (genotype, F1,26 = 0.03642, p = 0.8501) with Sidak’s post hoc tests comparing cre-negative vs. Myrf icKO during conditioning (difference: 5.241 ± 6.245, 95% CI: −9.579 to 20.06, p = 0.6507) and 24 hour (difference: 3.556 ± 6.245, 95% CI: −11.26 to 18.37, p = 0.8185), n = 8 cre-negative and 7 Myrf icKO mice. i, Expanded quantification of Fos+ cell density across brain regions following 30-day retrieval sessions; unpaired two-tailed t-tests, PL (difference: 62.14 ± 24.56, 95% CI: 10.54 to 113.7, t21 = 72.53, p = 0.0209), IL (difference: 65.70 ± 28.64, 95% CI: 5.532 to 125.9, t21 = 2.294, p = 0.034), ACC (difference: 99.84 ± 21.22, 95% CI: 55.27 to 144.4, t21 = 4.706, p = 0.0002), BA (difference: 80.55 ± 24.87, 95% CI: 28.66 to 132.4, t21 = 3.238, p = 0.0041), LA (difference: 6.494 ± 9.138, 95% CI: −12.70 to 25.69, t21 = 0.7107, p = 0.4864), DG (difference: 163.5 ± 55.29, 95% CI: 48.50 to 278.5, t21 = 2.957, p = 0.0075), CA3 (difference: 175.4 ± 63.83, 95% CI: 42.70 to 308.2, t21 = 2.749, p = 0.012), NR (difference: 84.08 ± 22.50, 95% CI: 35.83 to 132.3, t21 = 3.737, p = 0.0022), vDG (difference: 88.20 ± 32.23, 95% CI: 18.58 to 157.8, t21 = 2.737, p = 0.017), vCA3 (difference: 55.39 ± 24.33, 95% CI: 2.831 to 108.0, t21 = 7.361, p = 0.0404), vPAG (difference: 105.9 ± 18.71, 95% CI: 66.04 to 145.8, t21 = 5.662, p < 0.0001), SCC (difference: 21.86 ± 53.48, 95% CI: −89.35 to 133.1, t21 = 0.4088, p = 0.6868), n = 12 cre-negative and 11 Myrf icKO mice. j, Within-genotype comparisons of Fos+ cell density between the PL and IL; paired two-tailed t-tests, cre-negative (difference: 35.68 ± 33.66, 95% CI: −40.47 to 111.8, t9 = 0.4088, p = 0.3168), Myrf icKO (difference: 3.320 ± 21.65, 95% CI: −45.65 to 52.29, t9 = 0.4088, p = 0.8815), n = 10 mice per genotype. Within-genotype comparisons of freezing responses between males and females for animals represented in a-e for cre-negative (k) and Myrf icKO animals (l); two-way ANOVA for cre-negative (F4,44 = 0.6815, p = 0.6085) and Myrf icKO animals (F4,44 = 1.649, p = 0.1833), n = 8 males and 5 females for cre-negative mice, n = 5 males and 6 females for Myrf icKO mice. Data are presented as mean ± SEM, with asterisks indicating the following p-value ranges: * ≤ 0.05, ** ≤ 0.01, *** ≤ 0.001, **** ≤ 0.0001.
Extended Data Fig. 4 |
Extended Data Fig. 4 |. innate anxiety-like and locomotor behaviors are unchanged in the absence of new myelin formation.
Quantification of time spent in the closed arms of the elevated plus maze (EPM) (a) and the periphery of the open field test (OFT) (b); unpaired two-tailed t-test, EPM (difference: −16.38 ± 12.29, 95% CI: −42.59 to 9.818, t15 = 1.333, p = 0.2025), OFT (difference: 20.94 ± 22.43, 95% CI: −27.17 to 69.05, t15 = 0.9334, p = 0.3664). (c) Quantification of total distance traveled in the open field test; unpaired two-tailed t-test (difference: 788.3 ± 780.0, 95% CI: −884.6 to 2461, t15 = 1.011, p = 0.3293). Heatmaps representing relative frequency (red - frequent, blue - infrequent) of cre-negative and Myrf icKO animals in the elevated plus maze (d) (dashed lines demarcate the closed arms), and open field test (e). Data are presented as mean ± SEM. For a-c, n = 5 cre-negative and 11 Myrf icKO mice.
Extended Data Fig. 5 |
Extended Data Fig. 5 |. Supplementary data for fiber photometry experiments.
a, Schematic of fiber photometry recording setup. b, Representative trace of a recorded retrieval session depicting the raw GCaMP (blue) and isobestic (black) signal, with no detectable motion artifact. Quantification of the z-scored mean ΔF/F during the two seconds pre- and post-bout transition at 24 hours and 30 days for control (c) and Myrf icKO (d) animals; n = 10 bouts across 7 mice (controls) and 7 mice (Myrf icKO); paired two-tailed t-tests comparing z-scored signal intensity pre- and post-bout for control 24 hour (difference: −0.2016 ± 0.1564, 95% CI: −0.5095 to 0.1064, t138 = 1.289, p = 0.0202), control 30 day (difference 0.1051 ± 0.1118, 95% CI: −0.1150 to 0.3251, t138 = 0.9396, p = 0.055), Myrf icKO 24 hour (difference: −0.2216 ± 0.1650, 95% CI: −0.5494 to 0.1063, t138 = 1.343, p < 0.0001), and Myrf icKO 30 day (difference: −0.1837 ± 0.1502, 95% CI: −0.4810 to 0.1136, t138 = 1.223, p = 0.0032). e, Quantification of the mean ΔF/F over a five-minute home cage recording taken just prior to the 24-hour and 30-day retrieval sessions; n = 7 (controls) and 7 mice (Myrf icKO); unpaired two-tailed t-tests, 24 hour (difference: −0.0001284 ± 0.006472, 95% CI: −0.01423 to 0.01397, t13 = 0.01984, p = 0.6534), 30 day (difference: 0.004054 ± 0.01353, 95% CI: −0.03350 to 0.04161, t13 = 0.9334, p = 0.8892). f, Representative image of Iba1 staining under the implant site, quantified in (g); paired two-tailed t-test (difference: −32.40 ± 26.10, 95% CI: −92.58 to 27.78, t16 = 0.908, p = 0.2496), n = 9 mice. Scale bar: 100 μm. For box-and-whisker plots, the center, boxes, and whiskers represent the median, interquartile range, and the 10th and 90th percentiles, with asterisks indicating the following p-value ranges: * ≤ 0.05, ** ≤ 0.01, **** ≤ 0.0001.
Extended Data Fig. 6 |
Extended Data Fig. 6 |. induction of new myelin formation preserves remote fear memory recall.
a, Extended experimental timeline for cohort represented in Fig. 7a,e. b, Freezing responses in the conditioning context; two-way ANOVA (F4,108 = 5.884, p = 0.0003) with Sidak’s post hoc tests for conditioning (difference: 0.8941 ± 4.116, 95% CI: −9.860 to 11.65, p = 0.9928), 24 hour (difference: −0.8004 ± 4.116, 95% CI: −11.55 to 9.954, p = 0.9948), 7 day (difference: −11.91 ± 4.116, 95% CI: −22.67 to −1.160, p = 0.0221), 21 day (difference: −16.77 ± 4.116, 95% CI: −27.52 to −6.013, p = 0.004), and 30 day (difference: −17.49 ± 4.116, 95% CI: −16.00 to −0.3832, p = 0.0002), n = 15 vehicle and 14 clemastine mice. c, Freezing responses in the similar context; two-way ANOVA (F1,27 = 8.277, p = 0.0077) with Sidak’s post hoc tests for 7 day (difference: 0.4158 ± 3.894, 95% CI: −7.391 to 8.222, p = 0.9154) and 21 day (difference: −8.190 ± 3.894, 95% CI: −28.24 to −6.733, p = 0.401), or across days within vehicle- (difference: −5.845 ± 2.078, 95% CI: −10.77 to −0.9248, p = 0.018) and clemastine-treated (difference: −14.45 ± 2.151, 95% CI: −19.54 to −9.357, p < 0.0001) animals, n = 15 vehicle and 14 clemastine mice. d, Experiment assessing the effects of continuous vehicle injections/handling, compared against home cage animals; two-way ANOVA (F4,36 = 9.926, p < 0.0001) with Sidak’s post hoc tests for conditioning (difference: −0.6013 ± 5.615, 95% CI: −15.66 to 14.46, p > 0.9999), 24 hour (difference: 0.2373 ± 5.615, 95% CI: −14.82 to 15.30, p > 0.9999), 7 day (difference: 22.20 ± 5.615, 95% CI: 7.137 to 37.25, p = 0.0014), 21 day (difference: 31.96 ± 5.615, 95% CI: 16.91 to 47.02, p < 0.0001), and 30 day (difference: 26.78 ± 5.615, 95% CI: 11.72 to 41.83, p < 0.0001), n = 5 mice per treatment group. e, Expanded quantification of Fos+ cell density following 30-day retrieval sessions; unpaired two-tailed t-tests, PL (difference: 279.0 ± 43.19, 95% CI: 188.6 to 369.4, t19 = 6.459, p < 0.0001), IL (difference: 198.6 ± 68.81, 95% CI: 49.90 to 347.2, t19 = 2.886, p = 0.274), ACC (difference: 127.4 ± 51.52, 95% CI: 18.66 to 236.1, t19 = 2.472, p = 0.0069), BA (difference: 86.21 ± 19.27, 95% CI: 45.87 to 126.5, t19 = 4.473, p = 0.0044), LA (difference: 128.6 ± 44.43, 95% CI: 35.89 to 221.2, t19 = 2.894, p = 0.009), DG (difference: 268.7 ± 56.69, 95% CI: 150.0 to 387.3, t19 = 4.739, (p < 0.0001), CA3 (difference: 270.5 ± 77.34, 95% CI: 109.2 to 431.8, t19 = 3.497, p =0.0023), NR (difference: 110.7 ± 34.65, 95% CI: 37.59 to 183.8, t19 = 3.195, p = 0.0026), vDG (difference: 153.9 ± 34.77, 95% CI: 80.51 to 227.2, t19 = 4.426, p = 0.0013), vCA3 (difference: 139.2 ± 36.88, 95% CI: 61.42 to 217.0, t19 = 3.775, p = 0.0019), vPAG (difference: 193.0 ± 48.67, 95% CI: 90.28 to 295.6, t19 = 3.965, p = 0.0017), SSC (difference: 79.25 ± 55.73, 95% CI: −38.33 to 196.8, t19 = 1.422, p = 0.1731), n = 13 vehicle and 8 clemastine mice. f, Within-treatment group comparisons of Fos+ cell density between the PL and IL; unpaired two-tailed t-tests, vehicle (difference: 80.43 ± 48.18, 95% CI: −20.78 to 181.6, t18 = 1.67, p = 0.3657), n = 13 PL- and 7 IL-sampled mice, clemastine (difference: −24.05 ± 65.62, 95% CI: −162.5 to 114.4, t17 = 0.3666, p = 0.7185), n = 8 PL- and 11 IL-sampled mice. Freezing responses for experimental timeline described in (a) for home cage (g), no shock (h), and immediate shock (i) animals; (g) two-way ANOVA (F3,24 = 2.217, p = 0.1122) (h) two-way ANOVA (F4,32 = 2.674, p = 0.0496) (i) two-way ANOVA (F4,32 = 0.7811, p = 0.5496); for g-I, n = 5 animals per condition. j, Extended experimental timeline for clemastine injections in Myrf icKO animals. k, Individual fear expression for vehicle- and clemastine-treated Myrf icKO animals represented in (j); two-way ANOVA (F4,48 =1.357, p = 0.2629), n = 6 vehicle and 8 clemastine mice. l, Quantification of the z-scored mean ΔF/F during pre- and post-bout transitions at 30 days for vehicle- (left) and clemastine-treated (right) animals; paired two-tailed t-tests comparing pre- and post-transition for vehicle (difference: 1.075 ± 0.1560, 95% CI: 0.7685 to 1.382, t78 = 6.894, p < 0.0001) and clemastine (difference: 0.8792 ± 0.1548, 95% CI: 0.5745 to 1.184, t78 = 5.678, p < 0.0001). m, Quantification of the z-scored mean ΔF/F of the pre- and post-bout transition for vehicle- and clemastine-treated animals; unpaired two-tailed t-test (difference: −0.1963 ± 0.2099, 95% CI: −0.6094 to 0.2168, t78 = 0.9352, p = 0.3504). For l-m, n = 10 bouts per animal, 4 animals per treatment group. For box-and-whisker plots, the center, boxes, and whiskers represent the median, interquartile range, and the 10th and 90th percentiles. For dot plots, data are presented as mean ± SEM, with asterisks indicating the following p-value ranges: * ≤ 0.05, ** ≤ 0.01, *** ≤ 0.001, **** ≤ 0.0001.
Fig. 1 |
Fig. 1 |. Fear learning induces oPC proliferation in the mPFC.
a, Experimental paradigm for EdU injections and contextual fear conditioning. b, Freezing responses pre-shock and during 24-h recall for home cage (HC), contextual fear conditioned (CFC), no shock (NS) and immediate shock (IS) groups. One-way ANOVA (F2,20 = 28.35, P < 0.0001) with Sidak’s post hoc tests comparing CFC versus NS (difference: −31.19 ± 6.179; 95% CI: −44.54 to −17.84; P < 0.0001) and CFC versus IS (difference: −32.94 ± 5.536; 95% CI: −44.81 to −21.07; P < 0.0001). c, Total EdU+ cell density in the mPFC of HC, CFC, NS and IS animals. One-way ANOVA (F3,26 = 7.238, P = 0.0012) with Sidak’s post hoc tests comparing HC versus CFC (difference: −1.616 ± 0.5212; 95% CI: −2.946 to −0.2868; P = 0.0137), HC versus NS (difference: 0.7080 ± 0.5382; 95% CI: −0.6654 to 2.081; P = 0.4878) and HC versus IS (difference: −0.1819 ± 0.5212; 95% CI: −1.512 to 1.148; P = 0.9803). d, EdU+Olig2+ cell density in the mPFC of HC, CFC, NS and IS animals. One-way ANOVA (F3,26 = 7.672, P = 0.0008) with Sidak’s post hoc tests comparing HC versus CFC (difference: −1.393 ± 0.47; 95% CI: −2.592 to −0.1933; P = 0.0192), HC versus NS (difference: 0.7474 ± 0.4854, 95% CI: −0.4912 to 1.986; P = 0.3544) and HC versus IS (difference: 0.1734 ± 0.47; 95% CI: −1.026 to 1.373; P = 0.9769) at 24 h post-conditioning. e,f, Representative images of EdU (green) and Olig2 (magenta) staining in the mPFC of HC (e) and CFC (f) animals, with arrows indicating colocalized EdU+Olig2+ cells; inset depicts separate color channels for representative EdU+ and Olig2+ cells. For all panels, n = 7 mice (HC), 8 mice (CFC), 7 mice (NS) or 8 mice (IS). Scale bar, 50 μm. For box-and-whisker plots, the center, boxes and whiskers represent the median, interquartile range, and the 10th and 90th percentiles, respectively. *P ≤ 0.05, ****P ≤ 0.0001.
Fig. 2 |
Fig. 2 |. Fear learning experience induces oPC maturation into myelinating oLs in the mPFC.
a, Experimental paradigm for EdU injections and contextual fear conditioning. b, Freezing responses during pre-conditioning and 24-h and 30-day retrieval sessions. One-way ANOVA (F2,21 = 19.42, P < 0.0001) with Sidak’s post hoc tests comparing conditioning versus 24 h (difference: −48.53 ± 9.402; 95% CI: −71.17 to −25.89; P < 0.0001) and conditioning versus 30 days (difference: −52.71 ± 9.402; 95% CI: −75.34 to −30.07; P < 0.0001). c, EdU+ASPA+ (left bars) and EdU+Olig2+ (right bars) density in the mPFC of HC and CFC animals at 30 days post-conditioning. Unpaired two-tailed t-tests for HC versus CFC for EdU+ASPA+ (difference: 3.629 ± 1.125; 95% CI: 1.199 to 6.060; t13 = 3.226, P = 0.0066) and for EdU+Olig2+ (difference: 7.555 ± 6.944; 95% CI: −7.446 to 22.56; t13 = 1.088, P = 0.2963) cell density. d,e, Representative images of EdU (green) and ASPA (magenta) in the mPFC of HC (d) and CFC (e) animals, with arrows indicating colocalized EdU+ASPA+ cells; inset depicts separate color channels for representative EdU+ASPA+ cells. f, Quantification of myelinated axon density per field of view in the mPFC. Unpaired two-tailed t-tests comparing HC versus CFC (difference: 23.07 ± 5.882; 95% CI: 10.95 to 35.18; t25 = 3.922, P = 0.0006). g,h, Representative electron micrographs of myelinated axons (arrows) in mPFC gray matter for HC (g) and CFC (h) animals. For bc, n = 7 mice (HC) or 8 mice (CFC); for f, n = 5 mice (HC) or 4 mice (CFC), 3 fields of view per mouse. Scale bars, 50 μm (de) or 2 μm (gh). For box-and-whisker plots, the center, boxes and whiskers represent the median, interquartile range, and the 10th and 90th percentiles, respectively. **P ≤ 0.01, ***P ≤ 0.001, ****P ≤ 0.0001.
Fig. 3 |
Fig. 3 |. oPC maturation into myelinating oLs occurs over several weeks in adult gray matter.
a, Experimental paradigm for tamoxifen injections, EdU injections, contextual fear conditioning and perfusions. b,c, Representative images of GFP+ (green) and MBP (magenta) pre-myelinating OLs at 7 days post-tamoxifen (b) and GFP+MBP+ myelinating OLs (arrows) at 30 days post-tamoxifen (c) in the mPFC of CFC mice; inset depicts separate color channels for representative GFP+MBP+ cells. d, Quantification of GFP+MBP+ (left bars) and GFP+MBP (right bars) cell density in the mPFC over time. For GFP+MBP+ density, one-way ANOVA (F2,19 = 6.586, P = 0.0067) with Sidak’s post hoc tests comparing 7 versus 14 days (difference: −2.695 ± 1.070; 95% CI: −5.292 to −0.09785; P = 0.0614) and 7 versus 30 days (difference: −4.045 ± 1.129; 95% CI: −6.787 to −1.304; P = 0.004). For GFP+MBP density, one-way ANOVA (F2,21 = 0.07572, P = 0.9274) with Sidak’s post hoc tests comparing 7 versus 14 days (difference: 2.354 ± 6.908; 95% CI: −14.41 to 19.12; P = 0.9308) and 7 versus 30 days (difference: 2.540 ± 7.292; 95% CI: −15.16 to 20.24; P = 0.9279). e, EdU+ASPA+ density in the mPFC over time. One-way ANOVA (F2,18 = 7.209, P = 0.005) with Sidak’s post hoc tests comparing 7 versus 14 days (difference: −0.5957 ± 0.5125; 95% CI: −1.846 to 0.6543; P = 0.4529) and 7 versus 30 days (difference: −1.817 ± 0.4975; 95% CI: −3.031 to −0.6038; P = 0.0036). f,g, Representative images of GFP+MBP+ASPA+ myelinating OLs (f, arrows) and GFP+MBPASPA pre-myelinating OLs (g, arrowheads) in the mPFC at 30 days post-conditioning. For all panels, n = 6 mice (7 days), 9 mice (14 days) or 7 mice (30 days). Scale bars, 50 μm (b,c) or 10 μm (f,g). For box-and-whisker plots, the center, boxes and whiskers represent the median, interquartile range, and the 10th and 90th percentiles, respectively. **P ≤ 0.01.
Fig. 4 |
Fig. 4 |. inhibition of new myelin formation impairs remote fear memory recall.
a, Experimental paradigm for contextual fear conditioning with tamoxifen administered 3 weeks before conditioning. b, Experimental paradigm for contextual fear conditioning with tamoxifen administered 5 days before conditioning. c, Representative images of GFP (green) and MBP (magenta) staining in the mPFC of MyrfloxP/+;tau-mGFPloxP/loxP;NG2CreERT+ (left, control) animals and in MyrfloxP/loxP;tau-mGFPloxP/loxP;NG2CreERT+ (right, Myrf icKO) animals 30 days post-conditioning; inset depicts separate color channels for representative GFP+MBP+ cells. d, Quantification of GFP+MBP+ cell density in the mPFC of control and Myrf icKO animals 30 days post-conditioning; n = 6 mice per condition (control, Myrf icKO), unpaired two-tailed t-test (difference: −5.806 ± 0.9062, 95% CI: −7.825 to −3.786, t10 = 6.406, P < 0.0001). e,f, Individual fear expression over time for Myrf icKO and control animals administered tamoxifen 3 weeks (e) and 5 days (f) before conditioning. For e, two-way ANOVA (F4,80 = 3.437, P = 0.0121) with Sidak’s post hoc tests comparing Cre-negative versus Myrf icKO during conditioning (difference: −2.416 ± 5.790; 95% CI: −17.58 to 12.74; P = 0.9965), 24 h (difference: −5.169 ± 5.790; 95% CI: −20.33 to 9.991; P = 0.9040) and 30 days (difference: −24.37 ± 5.790; 95% CI: −39.53 to −9.209; P = 0.0003), n = 11 mice per genotype. For f, two-way ANOVA (F4,80 = 1.435, P = 0.2291) with Sidak’s post hoc tests comparing Cre-negative versus Myrf icKO during conditioning (difference 1.467 ± 7.398; 95% CI: −13.19 to 16.13; P = 0.8431), 24 h (difference: 0.9199 ± 7.398; 95% CI: −13.74 to 15.58; P = 0.9013) and 30 days (difference: 18.43 ± 7.398; 95% CI: 3.767 to 33.09; P = 0.0142), n = 14 Cre-negative and 10 Myrf icKO mice. g, Freezing responses for Myrf icKO animals from the cohort in f 24 h after being reconditioned 31 days post-conditioning. Paired two-tailed t-test (difference: 48.76 ± 6.624; 95% CI: 33.48 to 64.04; t8 = 7.361, P < 0.0001). Scale bar, 50 μm. For box-and-whisker plots, the center, boxes and whiskers represent the median, interquartile range, and the 10th and 90th percentiles, respectively. For dot plots, data are presented as the mean ± s.e.m. *P ≤ 0.05, ****P ≤ 0.0001.
Fig. 5 |
Fig. 5 |. immediate early gene expression following remote recall is impaired in the absence of new myelin formation.
a, Quantification of Fos+ cell density across brain regions following 30-day retrieval sessions in Myrf icKO versus Cre-negative controls (the key to the chart also applies to b,fj). Unpaired two-tailed t-tests, mPFC (difference: 84.27 ± 23.89; 95% CI: −34.09 to 134.5; t21 = 3.528, P = 0.0024), BLA (difference: 80.55 ± 24.87; 95% CI: 28.66 to 132.4; t21 = 3.238, P = 0.0041), DG (difference: 163.5 ± 55.29, 95% CI: 48.50 to 278.5, t21 = 2.957, P = 0.0075), CA3 (difference: 175.4 ± 63.83; 95% CI: 42.70 to 308.2; t21 = 2.749, P = 0.012), SSC (difference: 21.86 ± 53.48; 95% CI: −89.35 to 133.1; t21 = 0.4088, P = 0.6868), n = 12 Cre-negative and 11 Myrf icKO mice. b, Quantification of baseline HC Fos+ cell density across brain regions in Myrf icKO versus Cre-negative controls. Unpaired two-tailed t-tests, mPFC (difference: 4.591 ± 19.85; 95% CI: −39.64 to 48.82; t10 = 0.2313, P = 0.8218), BLA (difference: −3.475 ± 25.49; 95% CI: −60.28 to 53.33; t10 = 0.1363, P = 0.8943), DG (difference: −24.73 ± 56.36; 95% CI: −150.3 to 100.8; t10 = 0.4387, P = 0.6702), CA3 (difference: 11.42 ± 36.00; 95% CI: −68.79 to 91.63; t10 = 0.3172, P = 0.7576), n = 6 mice per genotype. ce, Representative images of Fos induction (cyan) in the mPFC (c), dHPC (d) and BLA (e, outlined in dashed lines) of Cre-negative and Myrf icKO animals following 30-day retrieval. f, Quantification of Fos+ density across brain regions following 24-h retrieval sessions. Unpaired two-tailed t-tests, mPFC (difference: −18.95 ± 25.61; 95% CI: −76.90 to 38.99; t9 = 0.74, P = 0.4781), BLA (difference: 41.33 ± 39.72; 95% CI: −48.53 to 131.2; t9 = 1.041, P = 0.3252), DG (difference: 64.80 ± 111.0; 95% CI: −186.2 to 315.8; t9 = 0.5839, P = 0.5736), CA3 (difference: −45.58 ± 123.5; 95% CI: −324.9 to 233.7; t9 = 0.3692, P = 0.7205), n = 5 Cre-negative and 6 Myrf icKO mice. gj, Individual 30-day freezing responses plotted against Fos+ cell density in the mPFC (g), the BLA (h), the DG (i) and the CA3 (j). Two-tailed Spearman’s correlation test, mPFC (Rs = 0.589; 95% CI: 0.1853 to 0.8231; P = 0.0062), BLA (Rs = 0.467; 95% CI: 0.04322 to 0.7483; P = 0.0284), DG (Rs = 0.451; 95% CI: 0.03545 to 0.7343; P = 0.305), CA3 (Rs = 0.535; 95% CI: 0.1449 to 0.7812; P = 0.0085), n = 23 mice. Scale bars, 200 μm (ce). Data are presented as the mean ± s.e.m. *P ≤ 0.05, **P ≤ 0.01.
Fig. 6 |
Fig. 6 |. Prefrontal population calcium dynamics in the mPFC are altered in the absence of new myelin formation.
a, Experimental paradigm for surgeries, tamoxifen administration and fiber photometry recordings during contextual fear conditioning and retrieval. b,c, Schematic and anatomical location (CG, cingulate gyrus) (b) for delivery of calcium indicator and optical fiber and representative image (c) of GCaMP expression (green) and fiber placement (outlined by dashed line) in the mPFC. d, Representative ΔF/F trace across a conditioning session, with foot shocks overlaid in yellow. e, Heatmap of ΔF/F values 5 s pre- and post-shock for the first shock delivered in five representative animals; color map represents the ΔF/F. f, Representative ΔF/F trace across a 24-h retrieval session with freezing overlaid in blue. g, Representative z-scored ΔF/F traces across a time window spanning 2 s pre- and post-bout transition. h, Quantification of the mean ΔF/F during the 5 s pre- and post-shock, stratified by genotype; n = 14 bouts per 7 mice (control) and 6 bouts per 3 mice (Myrf icKO). Paired two-tailed t-tests comparing pre- and post-shock for control (difference: 0.08767 ± 0.007947; 95% CI: 0.07051 to 0.1048; t13 = 11.03, P < 0.0001) and Myrf icKO (difference: 0.08468 ± 0.02609; 95% CI: 0.01760 to 0.1518; t5 = 3.245, P = 0.0031) animals. Unpaired two-tailed t-test comparing post-shock across genotypes (difference: 0.001432 ± 0.01574; 95% CI: −0.03163 to 0.03449; t18 = 0.09098, P = 0.9285). i, Quantification of the difference between the z-scored mean ΔF/F of the 2 s pre- and post-bout transition for control and Myrf icKO animals, plotted during 24-h (left bars) and 30-day (right bars) retrieval; n = 10 bouts for 7 mice (control) and 7 mice (Myrf icKO). Unpaired two-tailed t-tests comparing across genotypes at 24 h (difference −0.02001 ± 0.1516; 95% CI: −0.3192 to 0.2792; t138 = 0.132, P = 0.8951) and 30 days (difference: −0.2963 ± 0.07301; 95% CI: −0.4403 to −0.1524; t138 = 4.5059, P < 0.0001). Scale bar, 100 μm. For box-and-whisker plots, the center, boxes and whiskers represent the median, interquartile range, and the 10th and 90th percentiles. n.s., not significant, P > 0.05, **P ≤ 0.01, ****P ≤ 0.0001.
Fig. 7 |
Fig. 7 |. induction of new myelin formation preserves remote fear memory recall.
a, Experimental paradigm for clemastine injections and contextual fear conditioning. b,c, Representative images of ASPA (green) and MBP (gray) signal in the mPFC of vehicle-treated mice (b) and clemastine-treated mice (c) 30 days post-conditioning. d, Quantification of ASPA+ cell density (left bars) and MBP mean fluorescence (right bars) in the mPFC of vehicle-and clemastine-treated animals, Unpaired two-tailed t-tests comparing vehicle versus clemastine for ASPA+ density (difference: 156.9 ± 43.21; 95% CI: 67.00 to 246.7; t21 = 3.63, P = 0.0016) and MBP fluorescence (difference: 17.10 ± 5.640; 95% CI: 5.370 to 28.83; t21 = 3.032, P = 0.0063), n = 11 vehicle-treated and 12 clemastine-treated mice. e, Individual fear expression over time for vehicle-treated mice and clemastine-treated mice. Two-way ANOVA (F4,108 = 5.884, P = 0.0003) with Sidak’s post hoc tests comparing across treatment groups for conditioning (difference: 0.8941 ± 4.116; 95% CI: −9.860 to 11.65; P = 0.9928), 24 h (difference: −0.8004 ± 4.116; 95% CI: −11.55 to 9.954; 0.9948) and 30 days (difference: −17.49 ± 4.116; 95% CI: −16.00 to −0.3832; P = 0.0002), n = 15 vehicle-treated and 14 clemastine-treated mice. f, Experimental timeline controlling for the duration of clemastine injections, in which the entire injection protocol is completed before initiation of fear conditioning and recent memory recall; n = 10 mice per treatment. g, Individual freezing responses during recent memory recall testing for animals pretreated with clemastine in the experimental timeline shown in f. Two-way ANOVA (F1,18 = 0.0003928, P = 0.9844). h, Experimental paradigm for clemastine injections in Myrf icKO animals. i, Individual fear expression over time for vehicle-treated mice and clemastine-treated Myrf icKO mice. Two-way ANOVA (F4,48 = 1.357, P = 0.2629), n = 6 vehicle-treated and 8 clemastine-treated mice. Scale bars, 100 μm (b,c). Data are presented as the mean ± s.e.m. **P ≤ 0.01, ****P ≤ 0.0001.
Fig. 8 |
Fig. 8 |. induction of new myelin formation increases immediate early gene expression following remote fear memory recall.
a, Quantification of Fos+ cell density across brain regions in vehicle-treated mice and clemastine-treated mice following 30-day retrieval. Unpaired two-tailed t-tests, mPFC (difference: 280.7 ± 54.50; 95% CI: 167.0 to 394.4; t19 = 5.15, P < 0.0001), BLA (difference: 75.06 ± 20.12; 95% CI: 32.95 to 117.2; t19 = 3.73, P = 0.0014), DG (difference: 268.7 ± 56.69; 95% CI: 150.0 to 387.3; t19 = 4.739, P < 0.0001), CA3 (difference: 270.5 ± 77.34; 95% CI: 109.2 to 431.8, t19 = 3.497; P = 0.0023), SSC (difference: 79.25 ± 55.73; 95% CI: −38.33 to 196.8; t19 = 1.422, P = 0.1731), n = 13 vehicle-treated and 8 clemastine-treated mice. b,c, Representative images of Fos induction (cyan) in the mPFC (b) and dHPC (c) of vehicle- and clemastine-treated animals following 30-day retrieval. d, Quantification of Fos+ cell density across brain regions in vehicle-pretreated mice and clemastine-pretreated mice, represented in Fig. 7f,g, following 24-h retrieval. Unpaired two-tailed t-tests, mPFC (difference: 6.885 ± 35.98; 95% CI: −68.71 to 82.48; t18 = 0.1913, P = 0.8504), BLA (difference: −22.53 ± 17.11; 95% CI: −58.48 to 13.42; t18 = 1.317, P = 0.2045), DG (difference: 3.547 ± 41.64; 95% CI: −83.94 to 91.04; t18 = 0.08518, P = 0.9331), CA3 (difference: 5.178 ± 33.28; 95% CI: −64.74 to 75.10; t18 = 0.1556, P = 0.8781), n = 10 mice per treatment group. e, Quantification of Fos+ cell density across brain regions in HC vehicle-treated animals and clemastine-treated animals, represented in Extended Data Fig. 6a,g, in the absence of fear learning. Unpaired two-tailed t-tests, mPFC (difference: 10.88 ± 35.04; 95% CI: −62.73 to 84.50; t18 = 0.3106, P = 0.7597), BLA (difference: −25.98 ± 22.03; 95% CI: −72.27 to 20.31; t18 = 1.179, P = 0.2537), DG (difference: 26.58 ± 21.51; 95% CI: −18.61 to 71.77; t18 = 1.236, P = 0.2324), CA3 (difference: −29.91 ± 29.50; 95% CI: −91.88 to 32.06; t18 = 1.014, P = 0.3239), n = 10 mice per treatment group. Scale bars, 100 μm (b) or 200 μm (c). Data are presented as the mean ± s.e.m. **P ≤ 0.01, ****P ≤ 0.0001.

Comment in

References

    1. Hill R, Patel K, Goncalves C, Grutzendler J & Nishiyama A Modulation of oligodendrocyte generation during a critical temporal window after NG2 cell division. Nat. Neurosci 17, 1518–1527 (2014). - PMC - PubMed
    1. Hill R, Li AM & Grutzendler J Lifelong cortical myelin plasticity and age-related degeneration in the live mammalian brain. Nat. Neurosci 21, 683–695 (2018). - PMC - PubMed
    1. Hughes E, Kang S, Fukaya M & Bergles D Oligodendrocyte progenitors balance growth with self-repulsion to achieve homeostasis in the adult brain. Nat. Neurosci 16, 668–676 (2013). - PMC - PubMed
    1. Hughes E, Orthmann-Murphy J, Langseth A & Bergles D Myelin remodeling through experience-dependent oligodendrogenesis in the adult somatosensory cortex. Nat. Neurosci 21, 696–706 (2018). - PMC - PubMed
    1. Kang SH, Fukaya M, Yang JK, Rothstein JD & Bergles DE NG2+ CNS glial progenitors remain committed to the oligodendrocyte lineage in postnatal life and following neurodegeneration. Neuron 68, 668–681 (2010). - PMC - PubMed

Publication types

MeSH terms

Substances