. 2020 Mar;23(3):351-362.
doi: 10.1038/s41593-020-0585-y. Epub 2020 Feb 10.

Cxcr4 distinguishes HSC-derived monocytes from microglia and reveals monocyte immune responses to experimental stroke

Affiliations

Cxcr4 distinguishes HSC-derived monocytes from microglia and reveals monocyte immune responses to experimental stroke

Yves Werner et al. Nat Neurosci. 2020 Mar.

Abstract

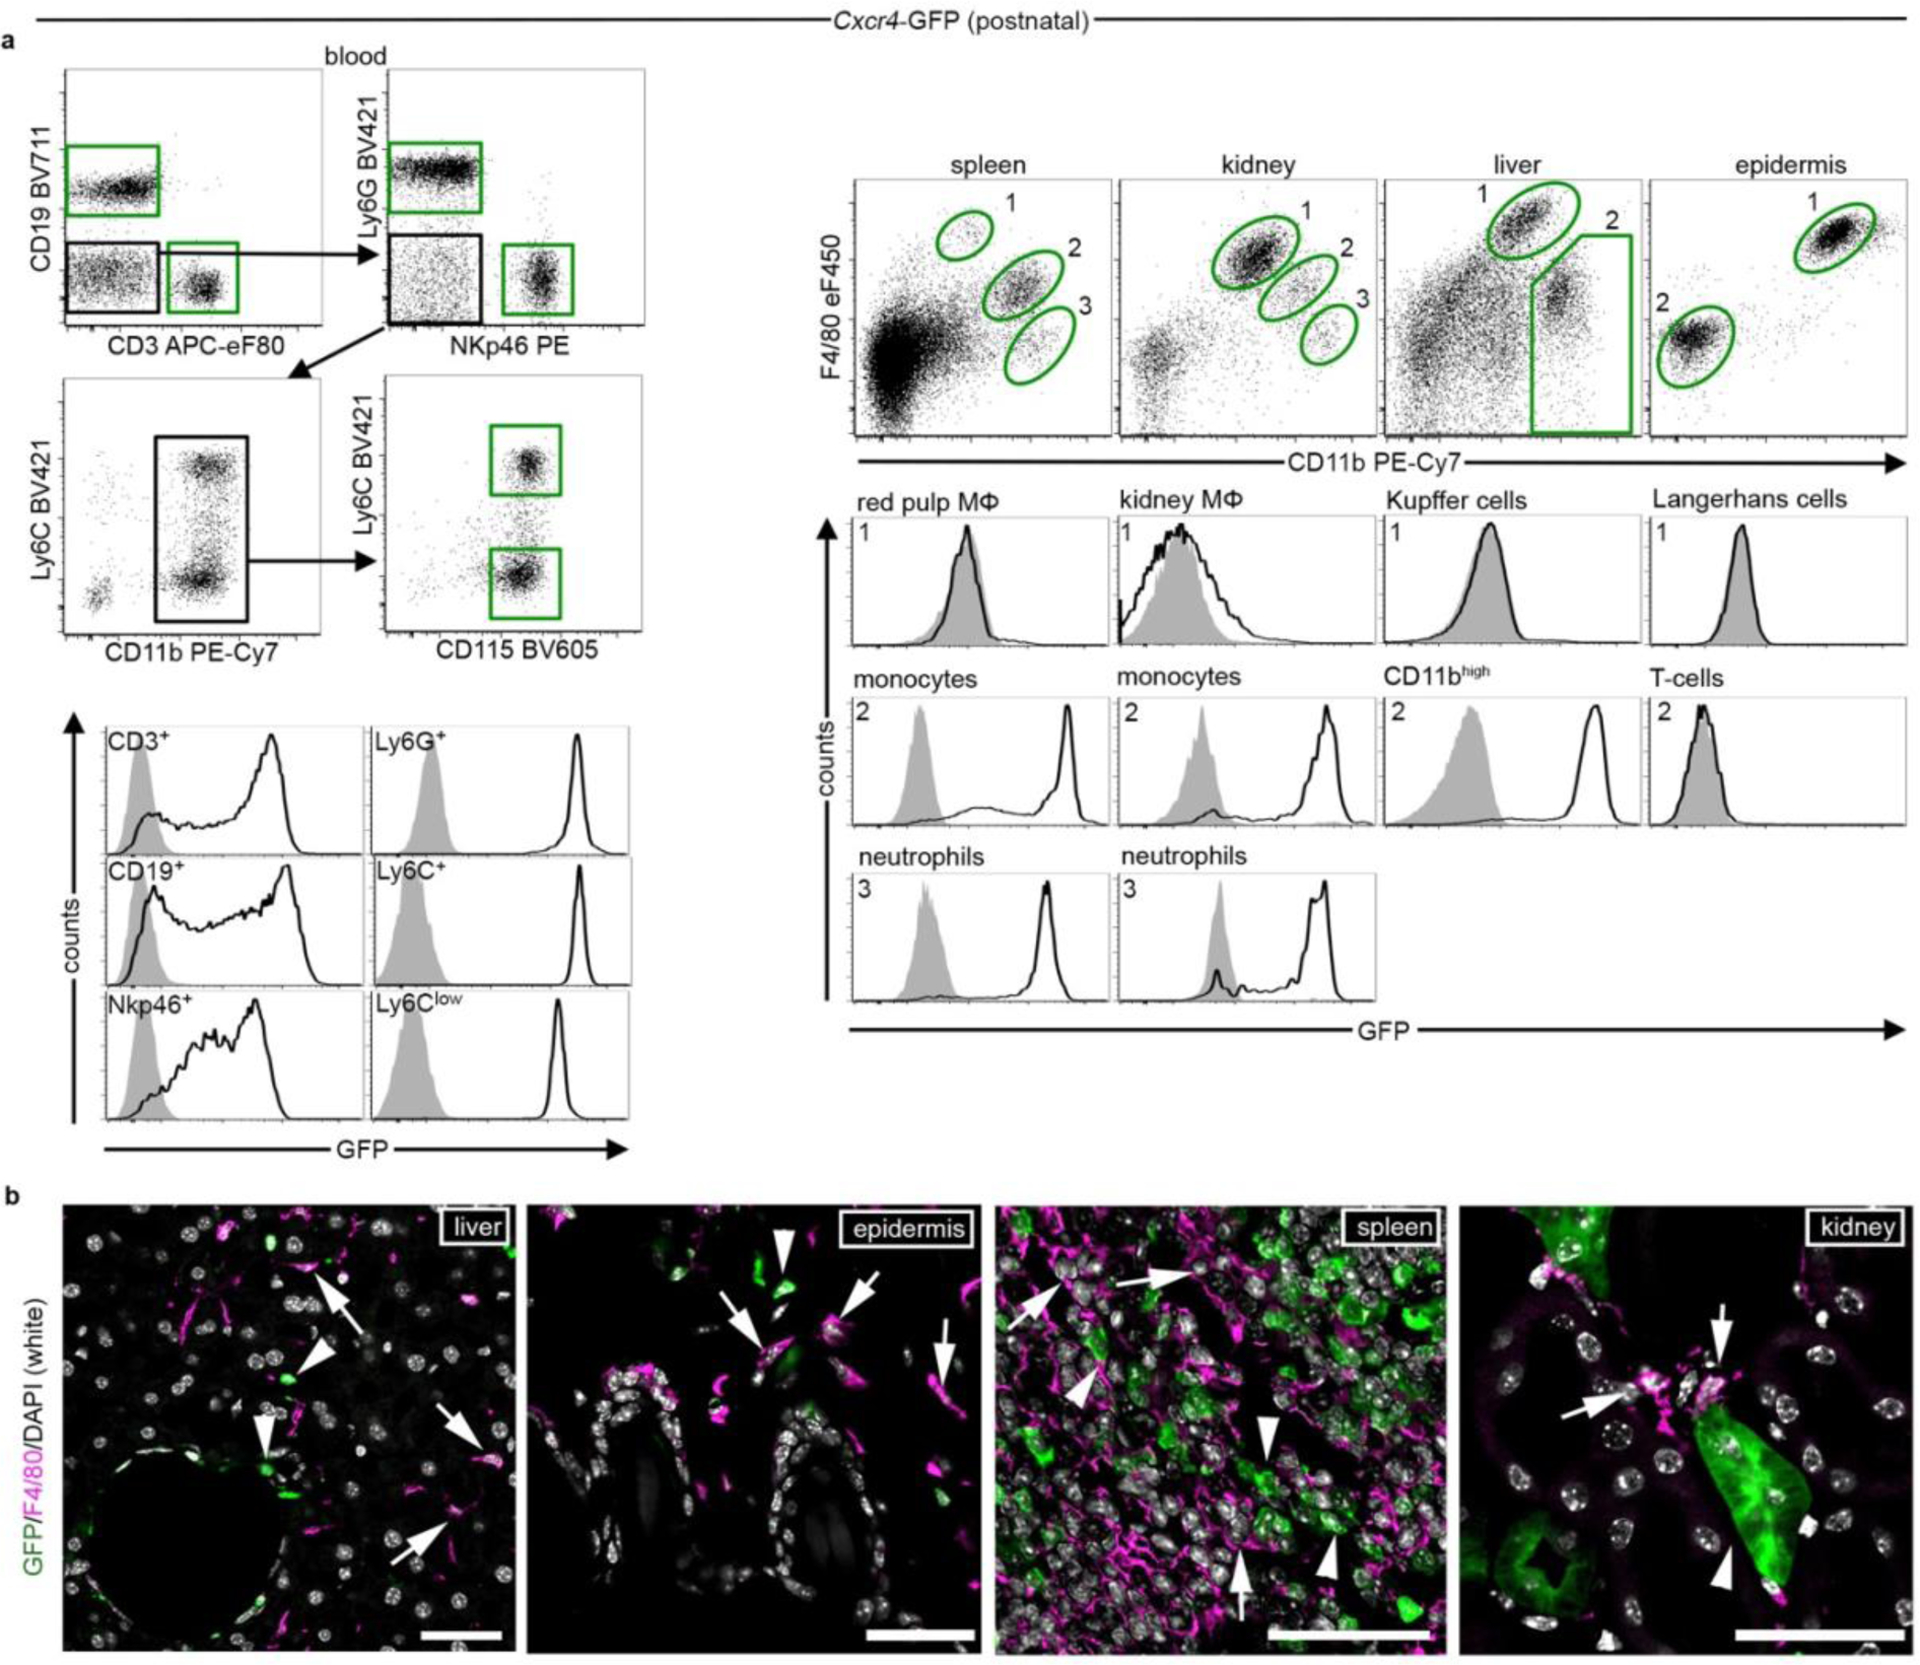
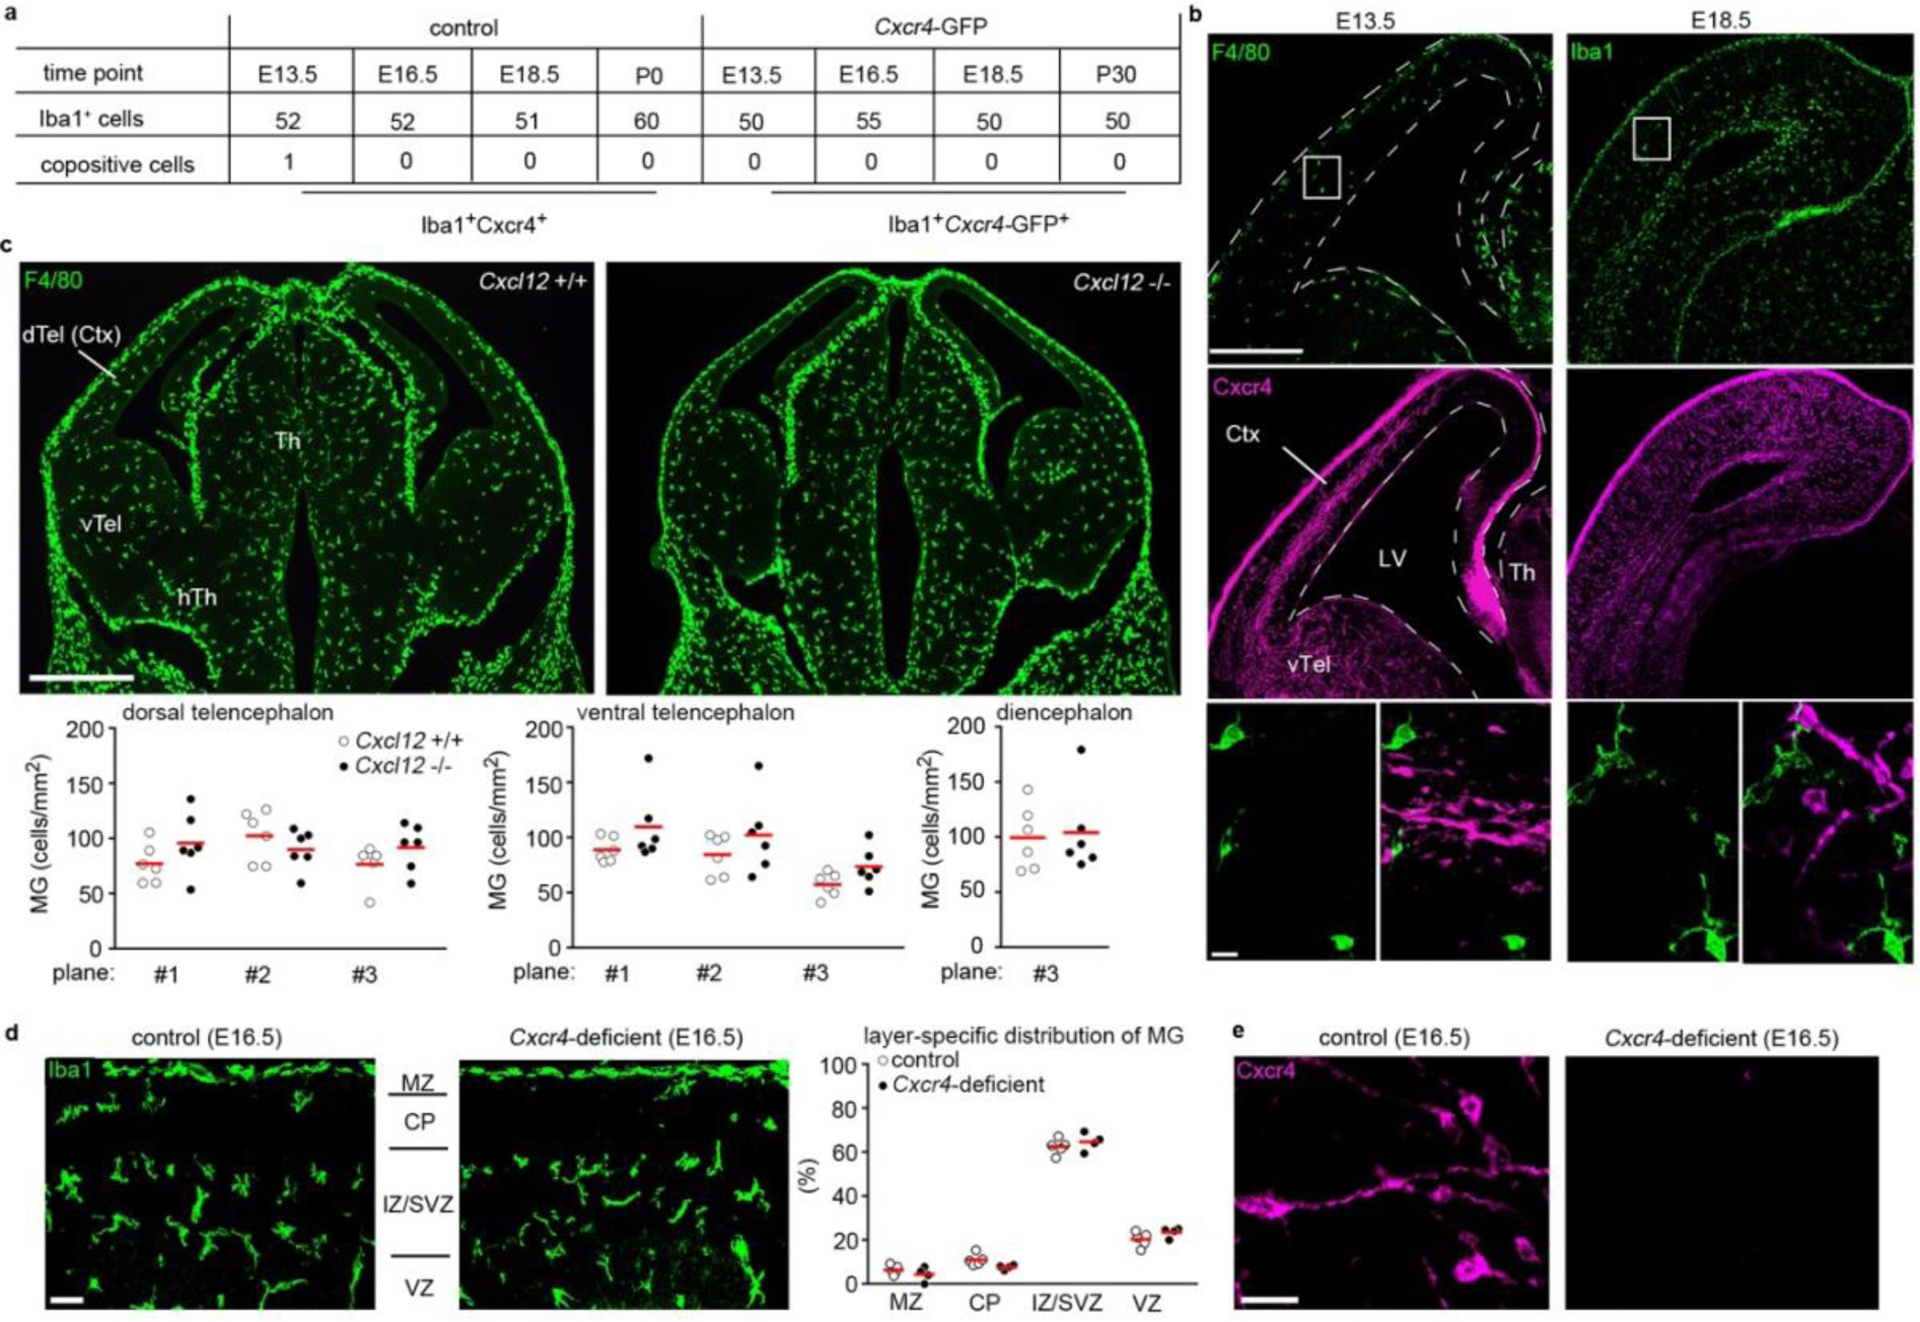
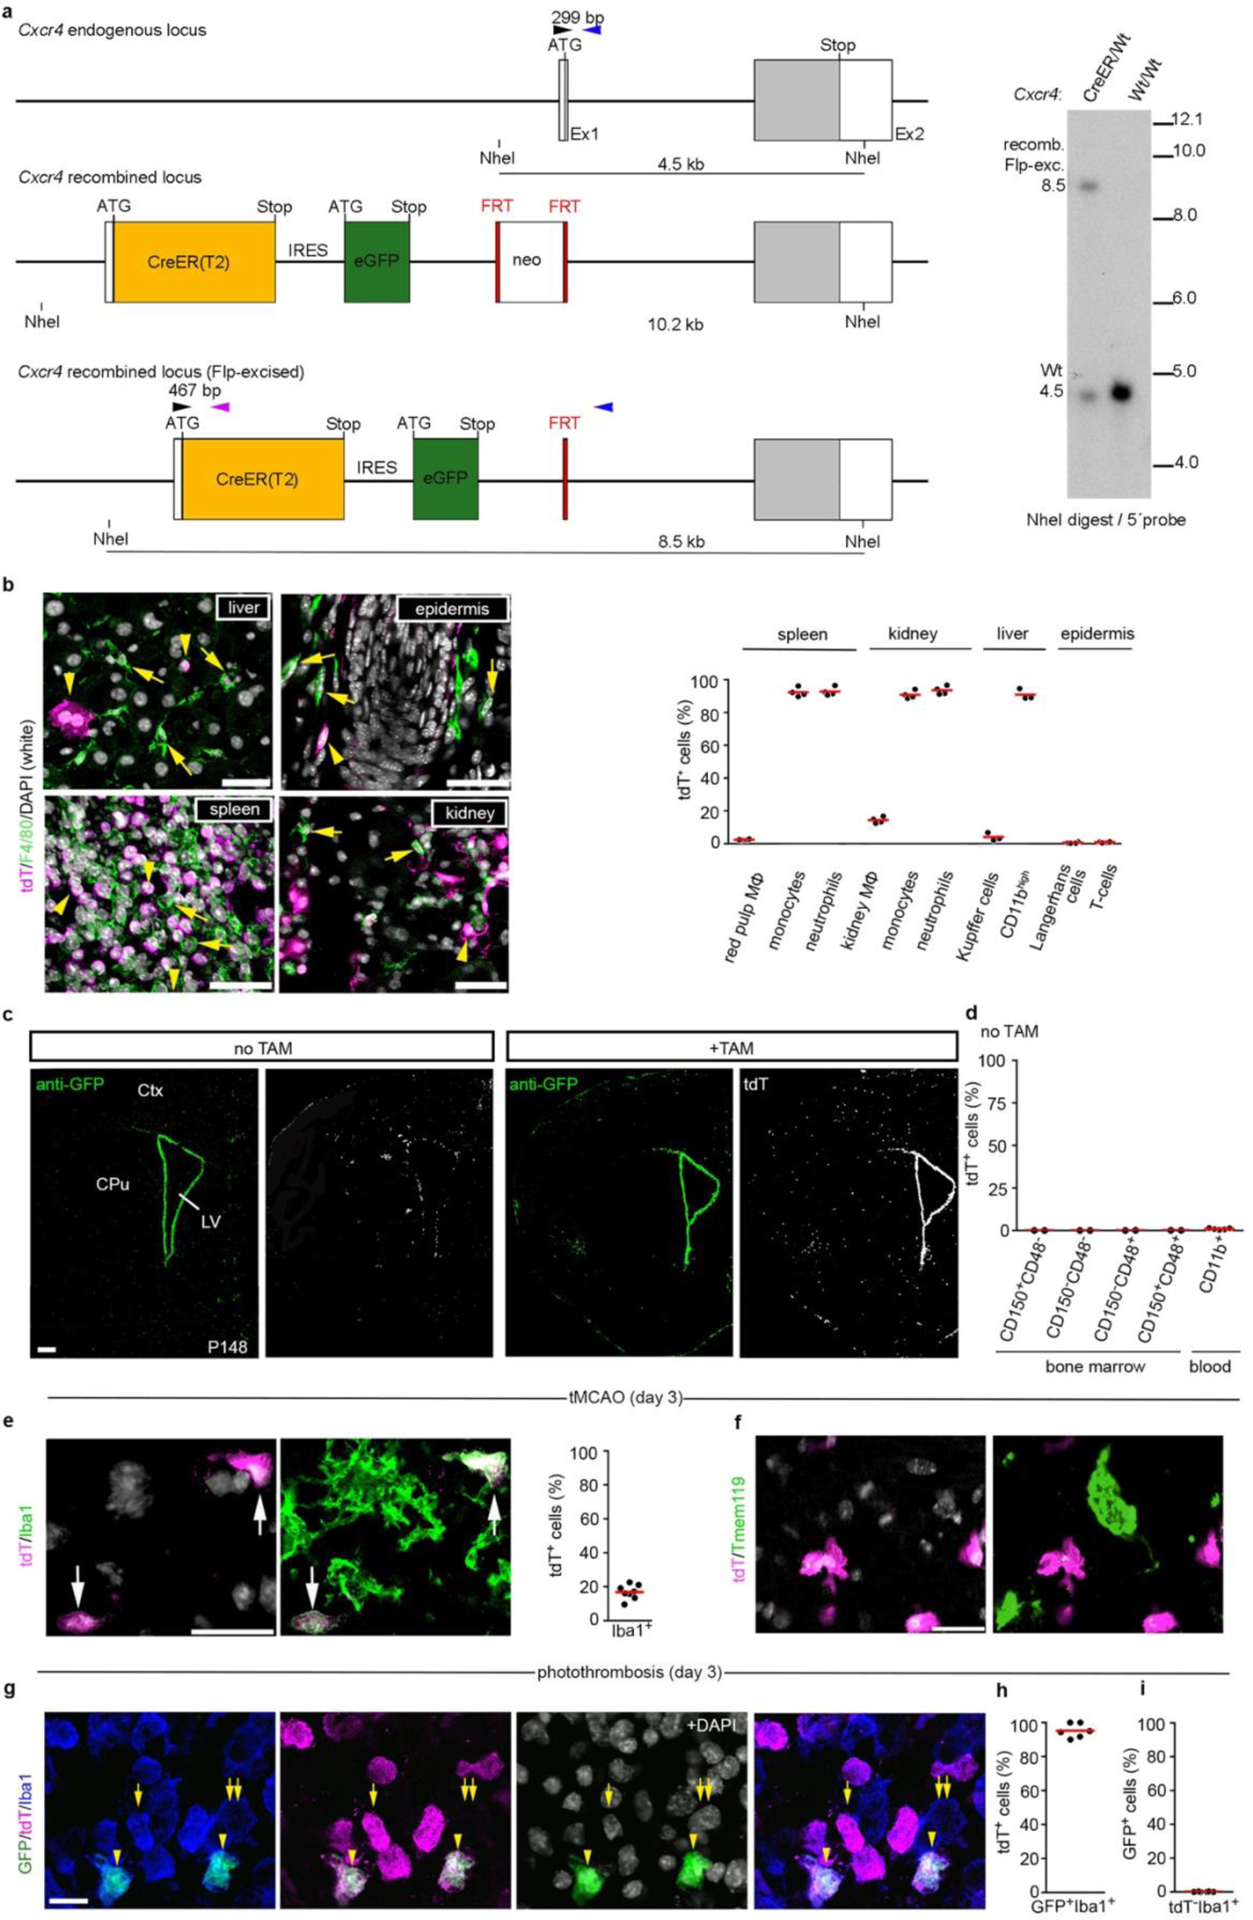
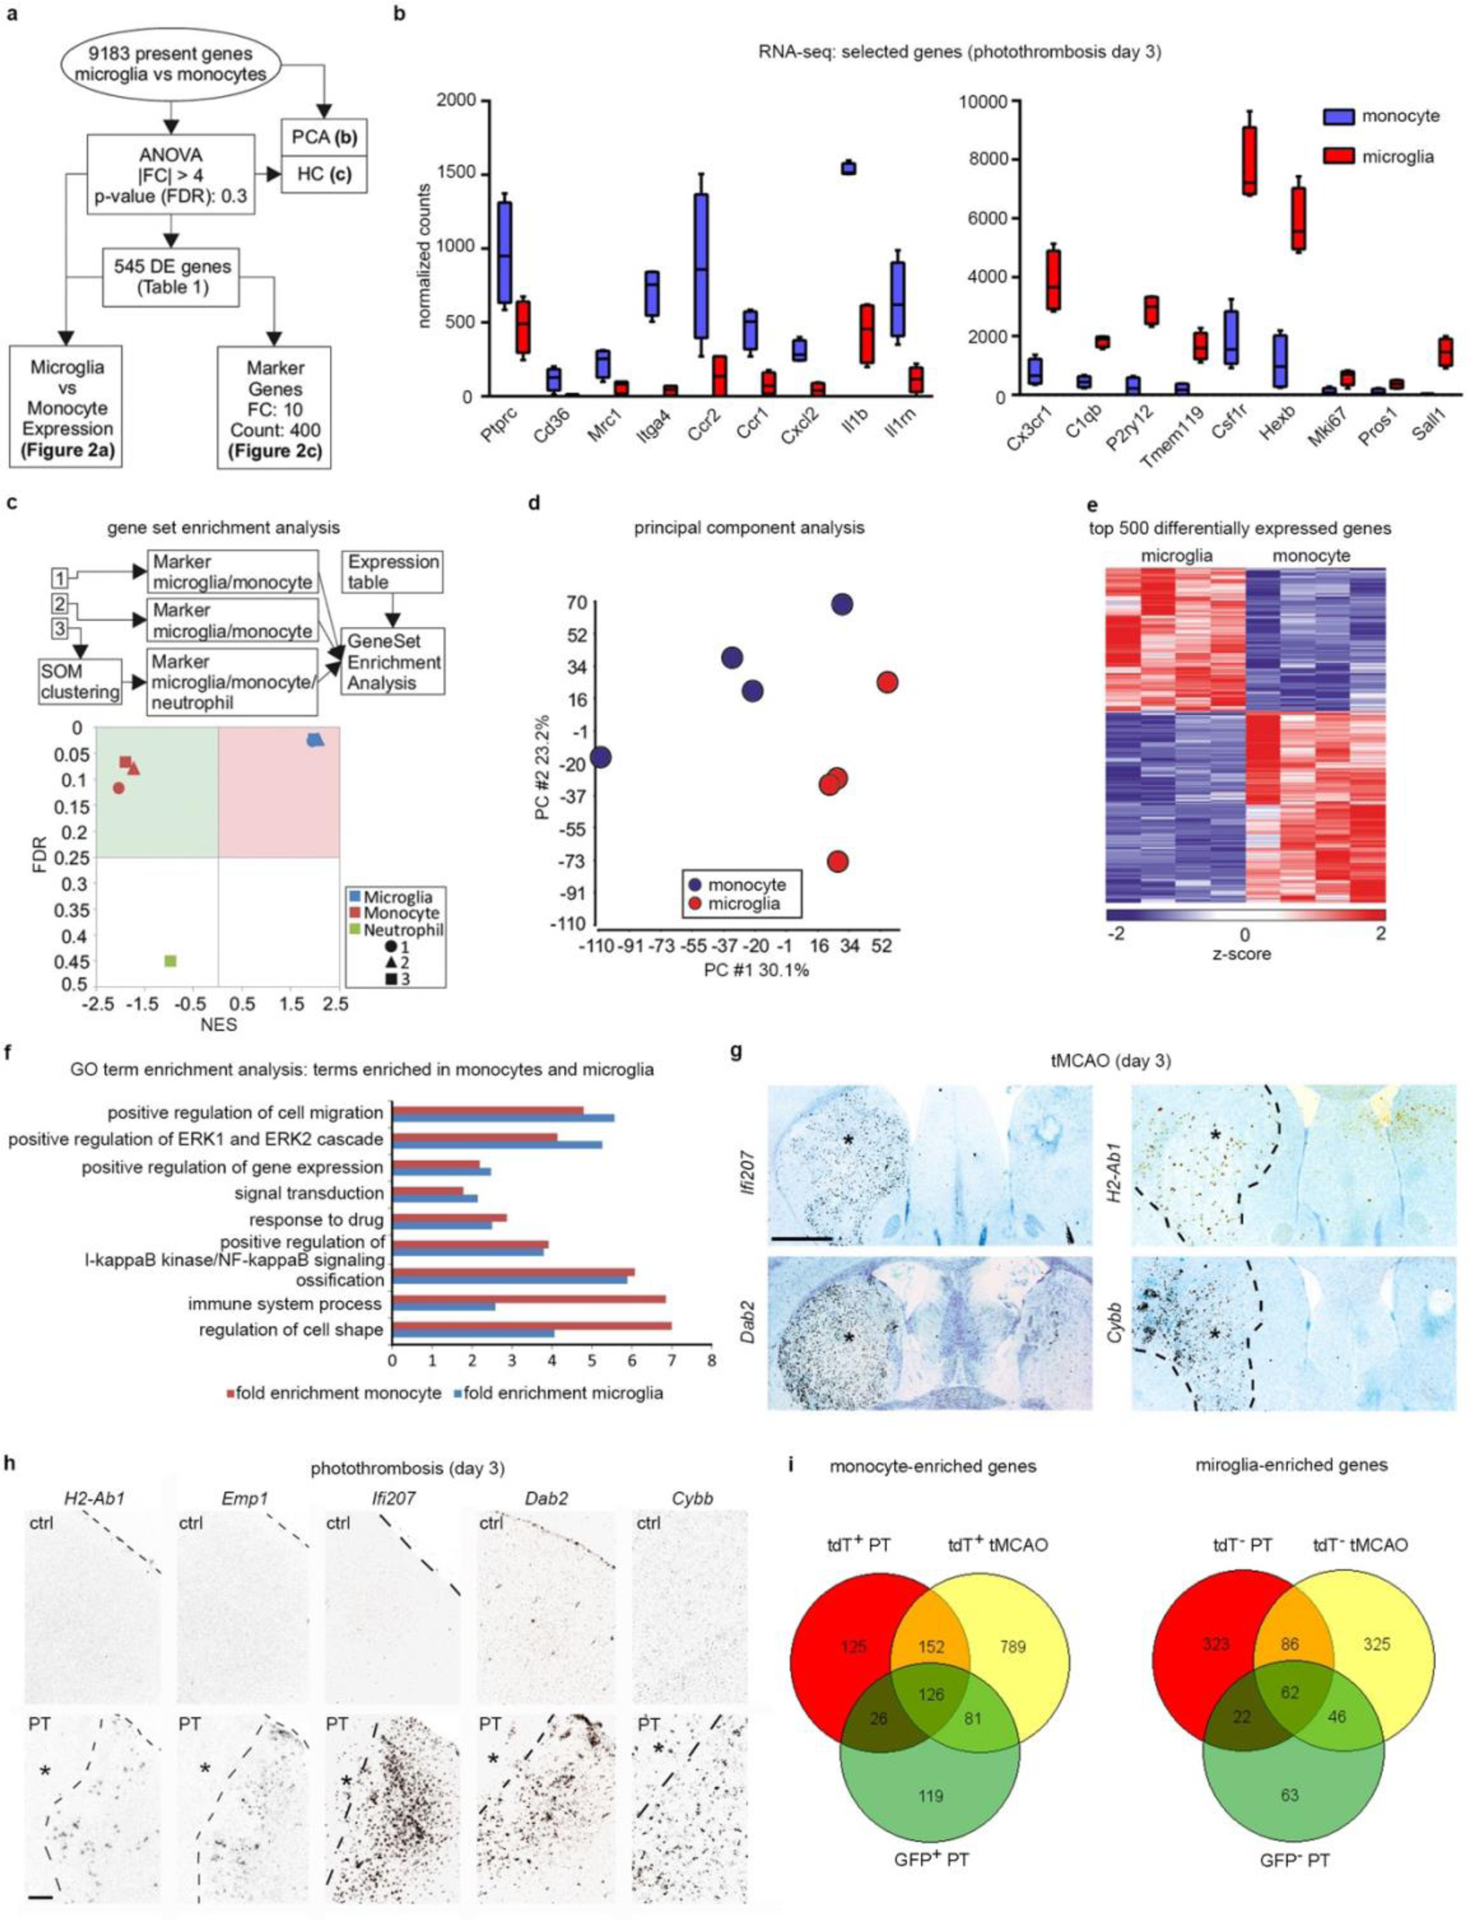
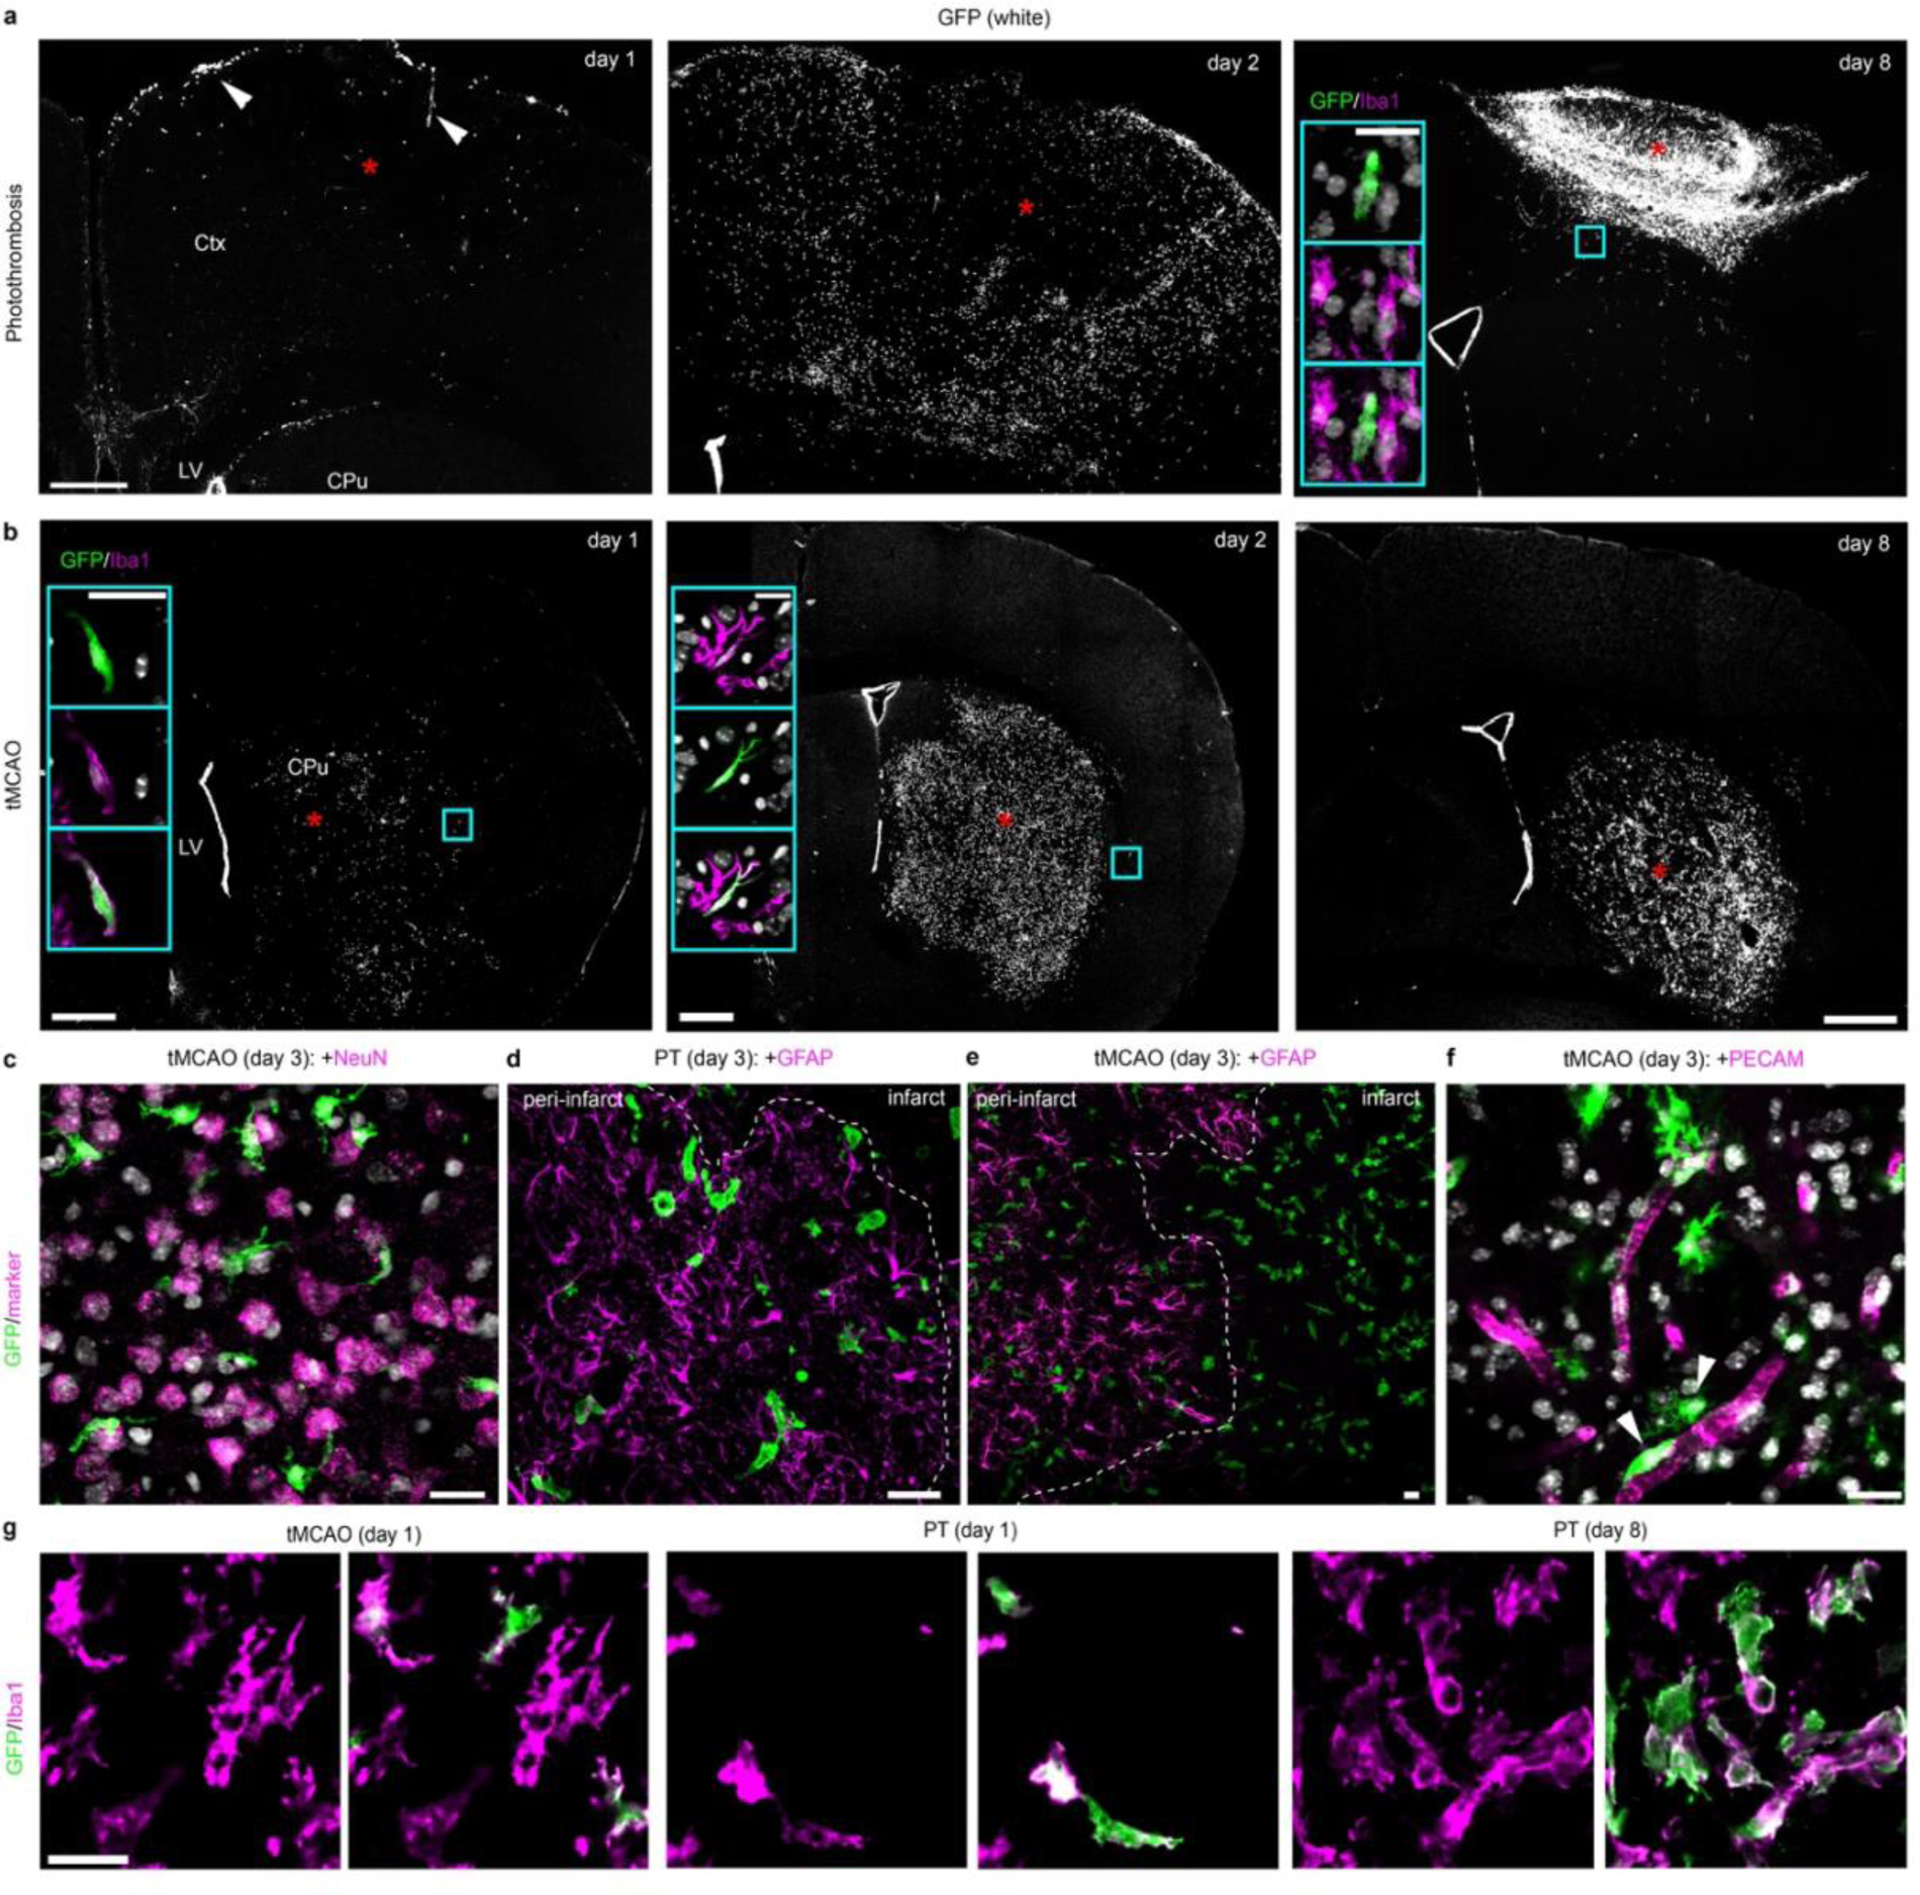
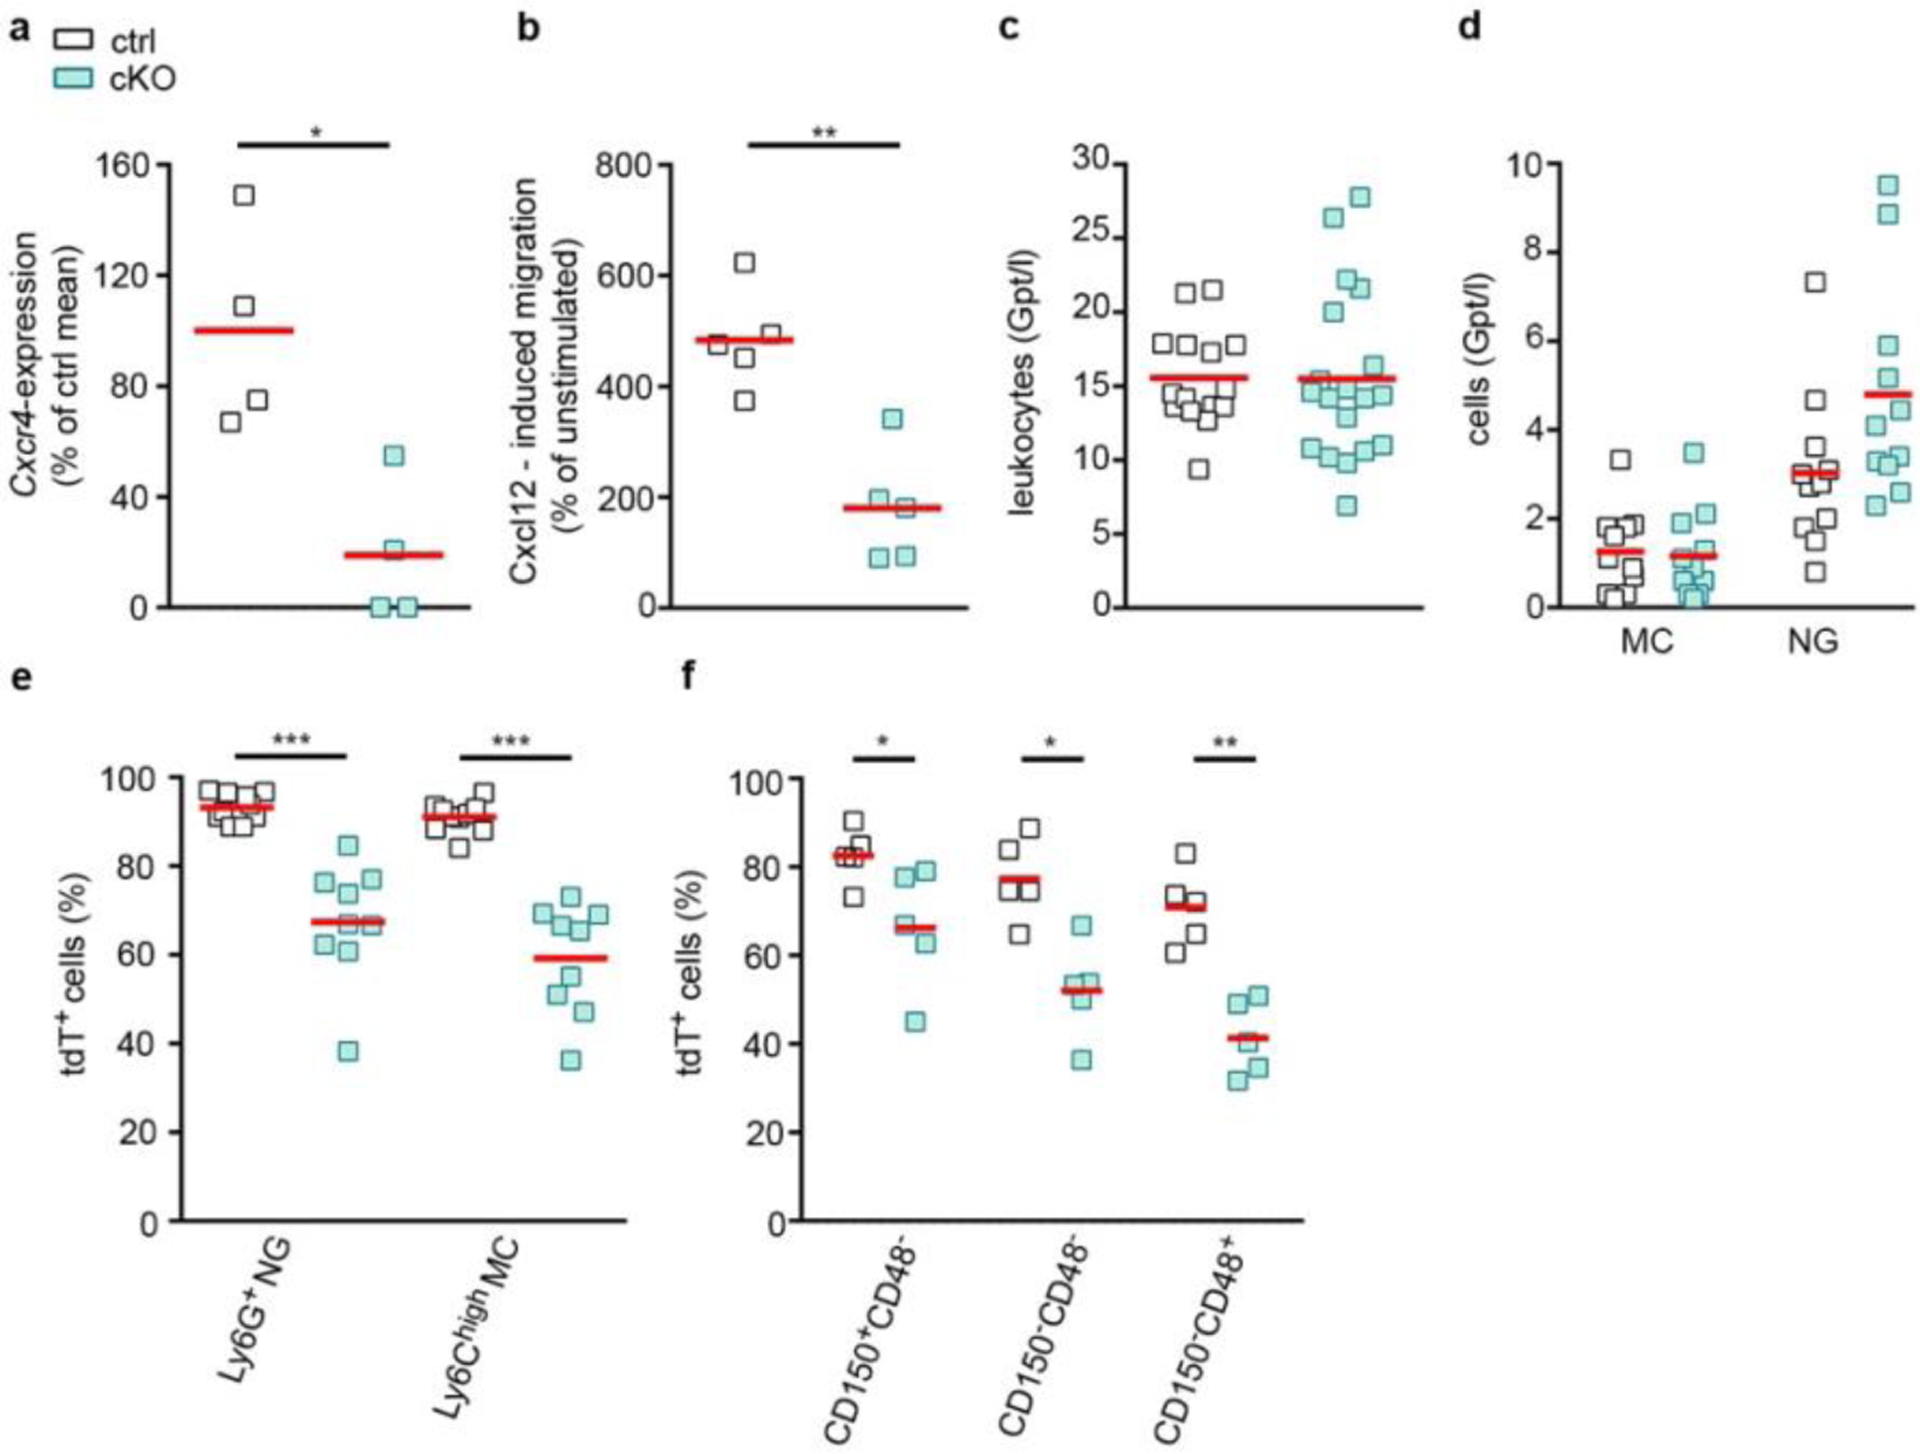
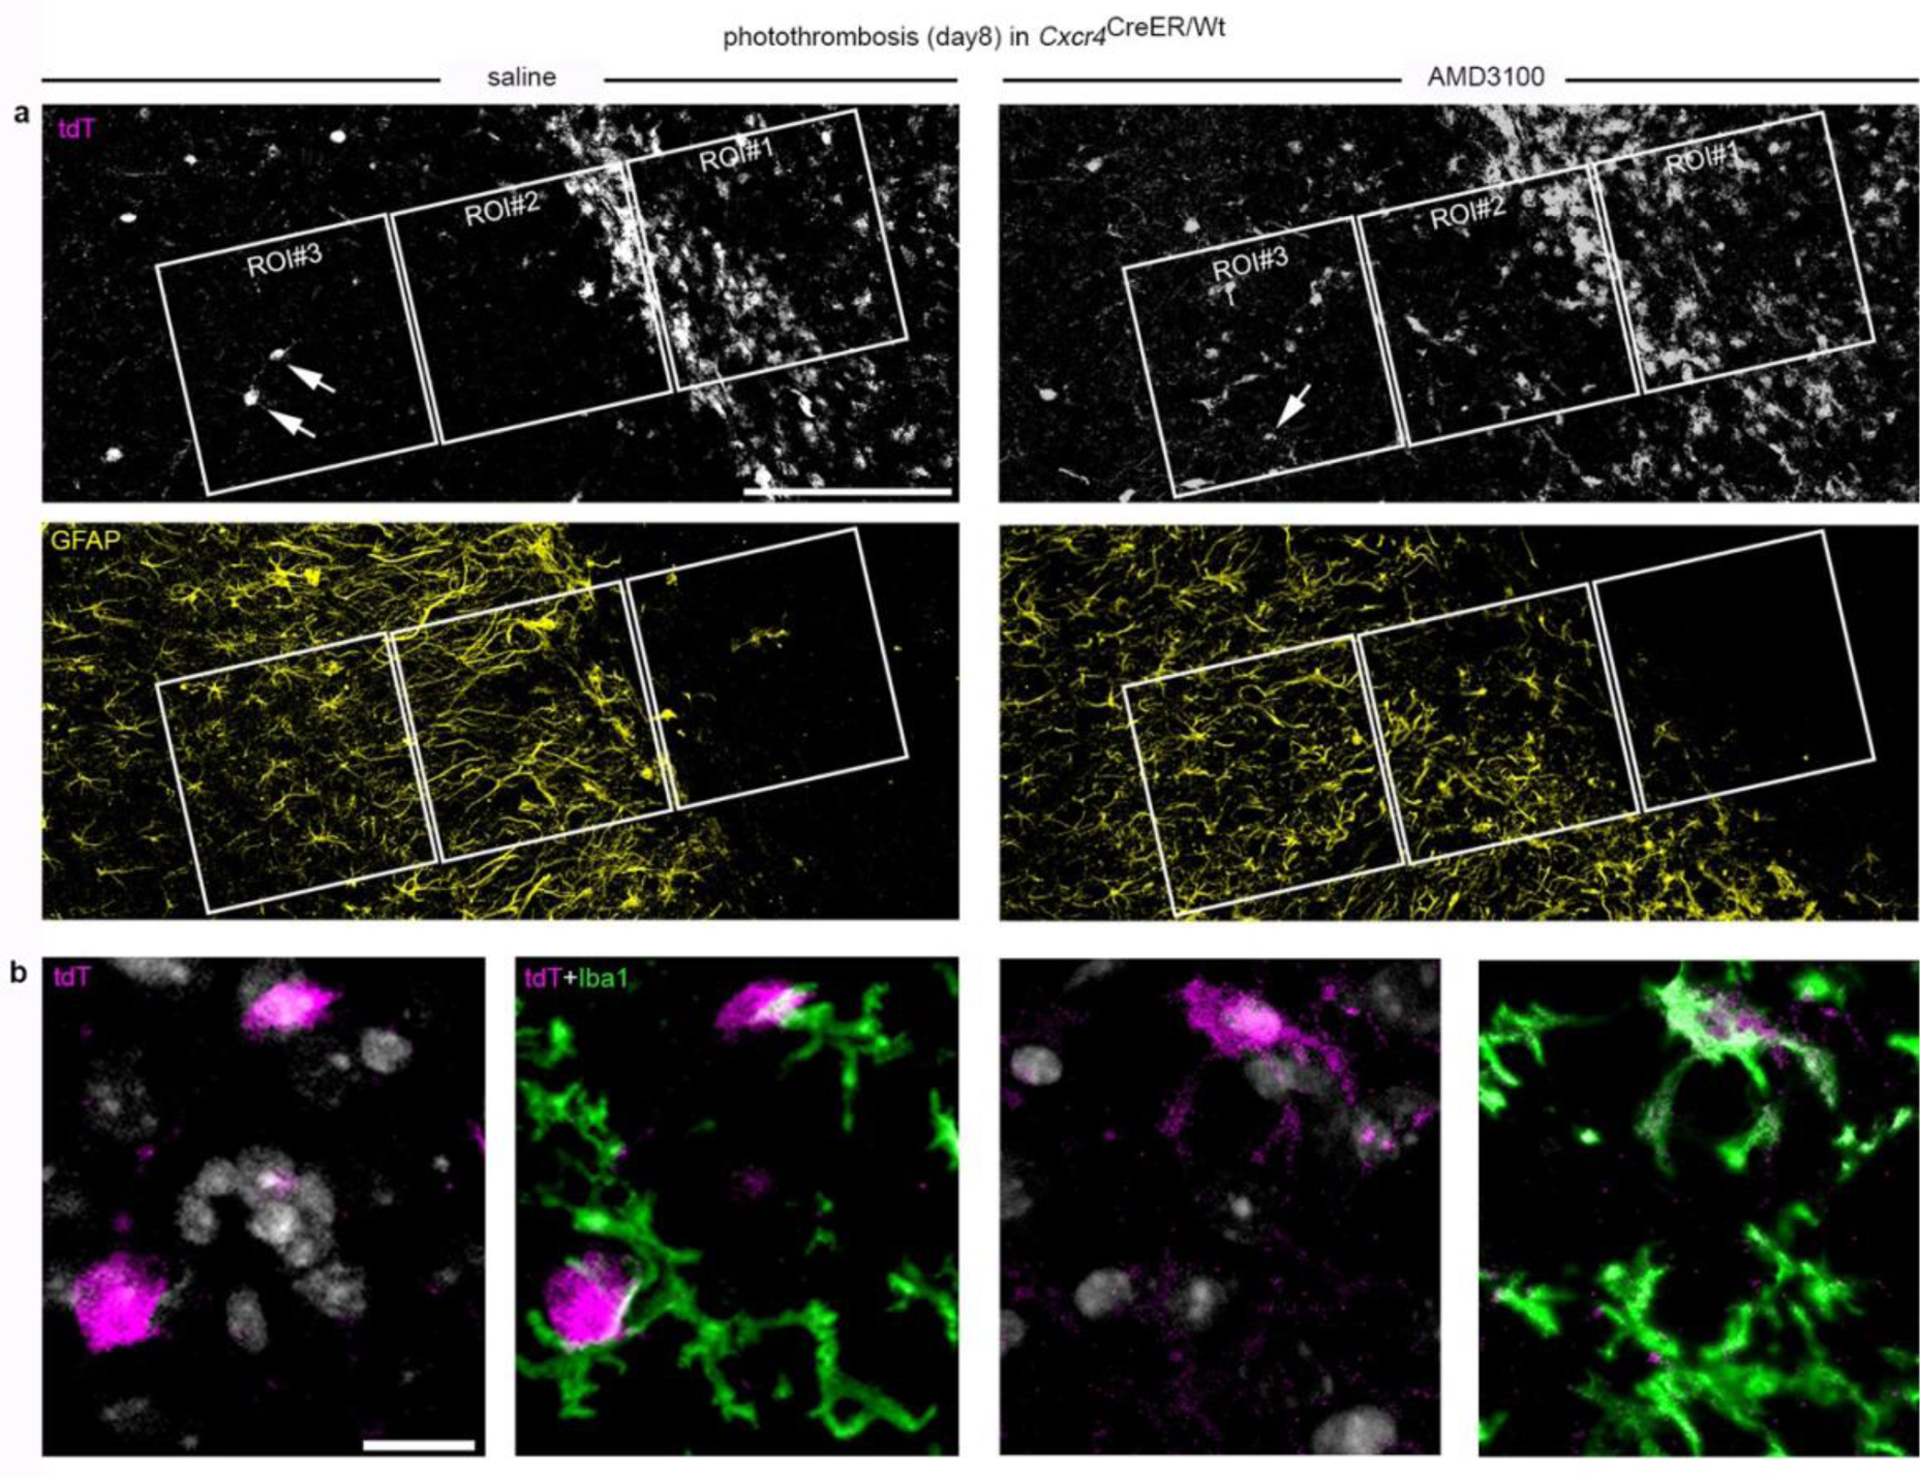
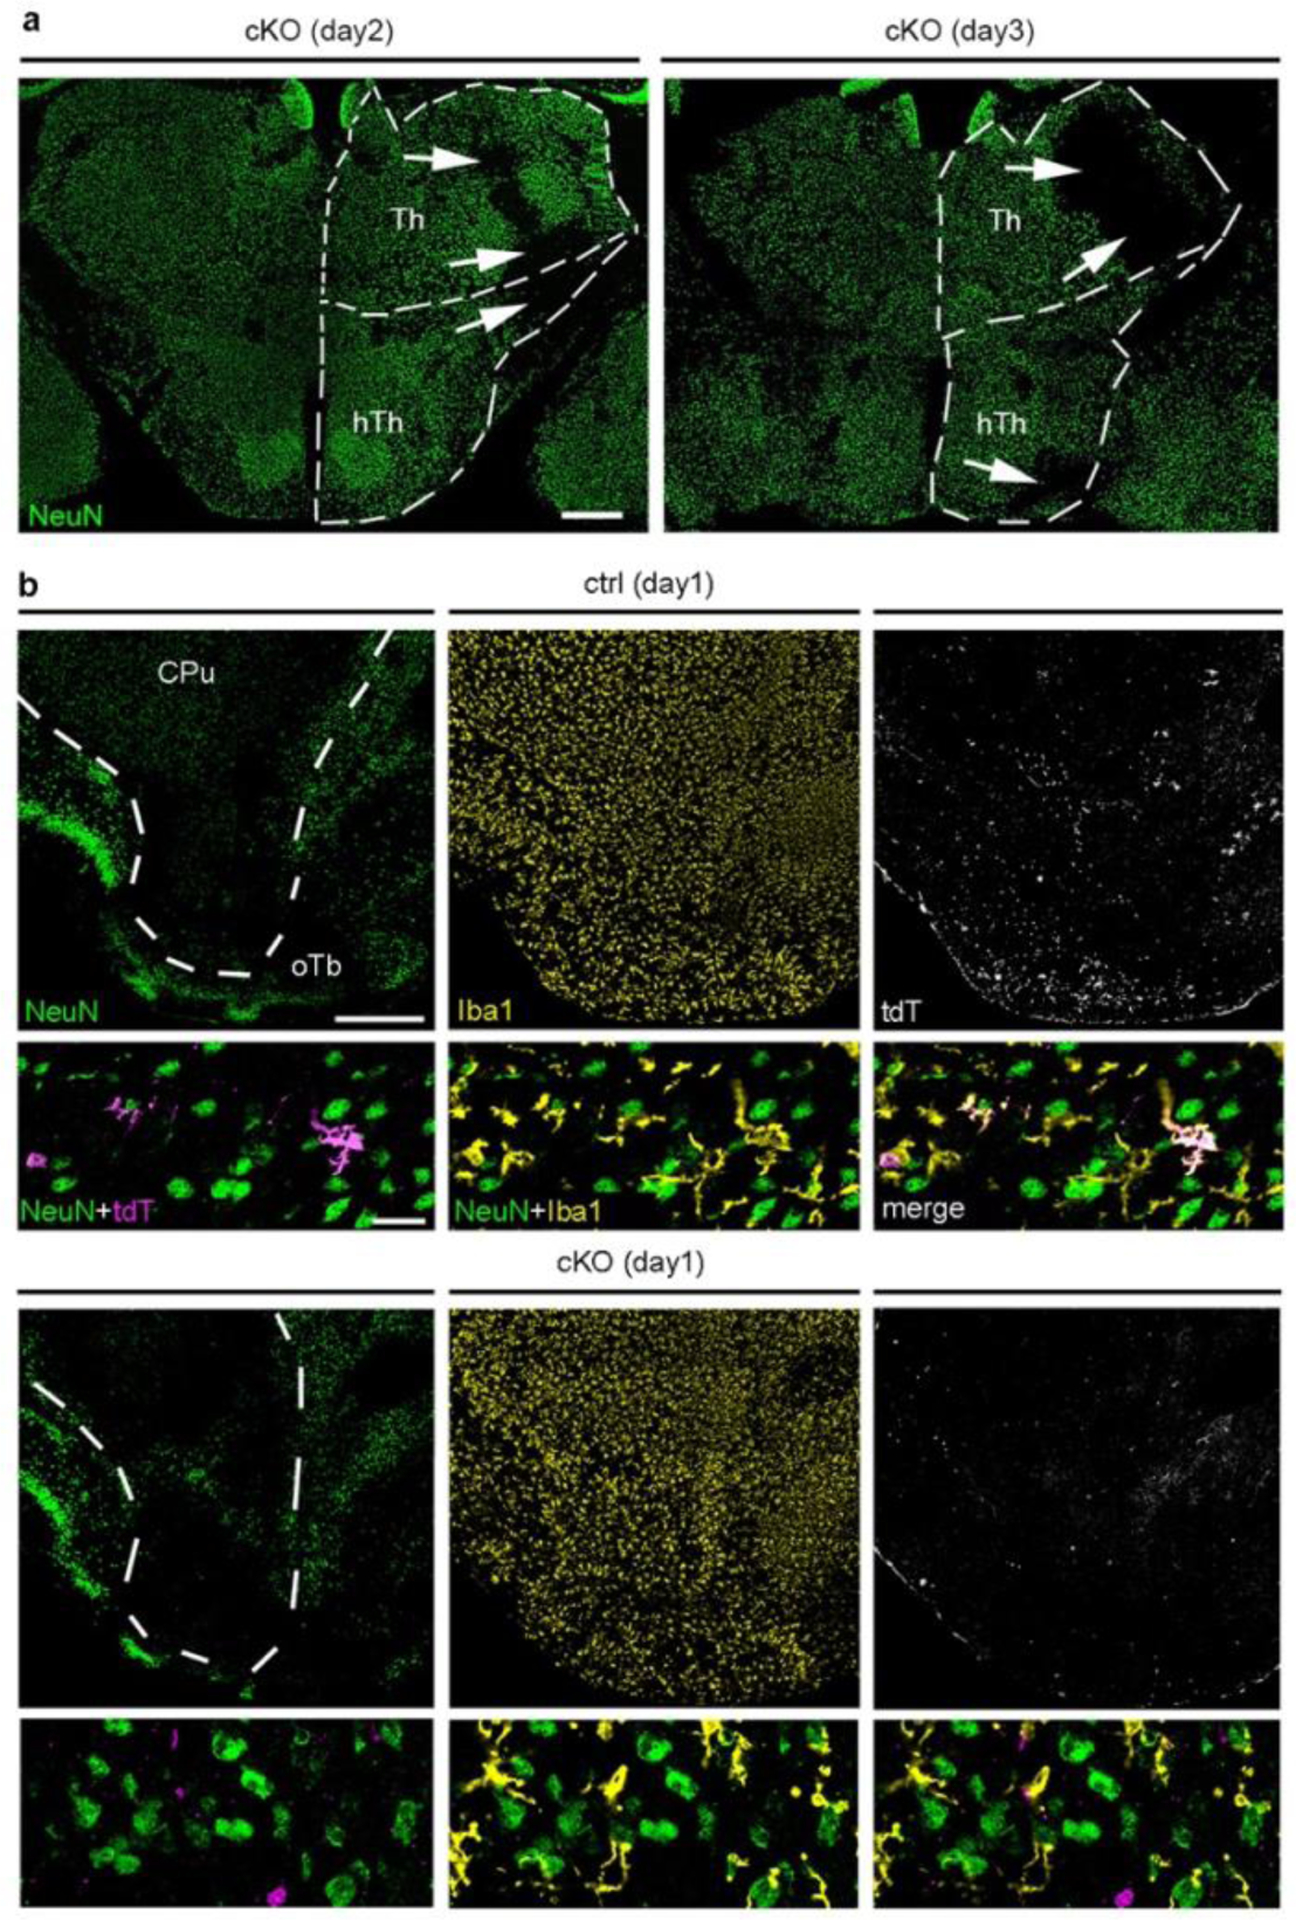
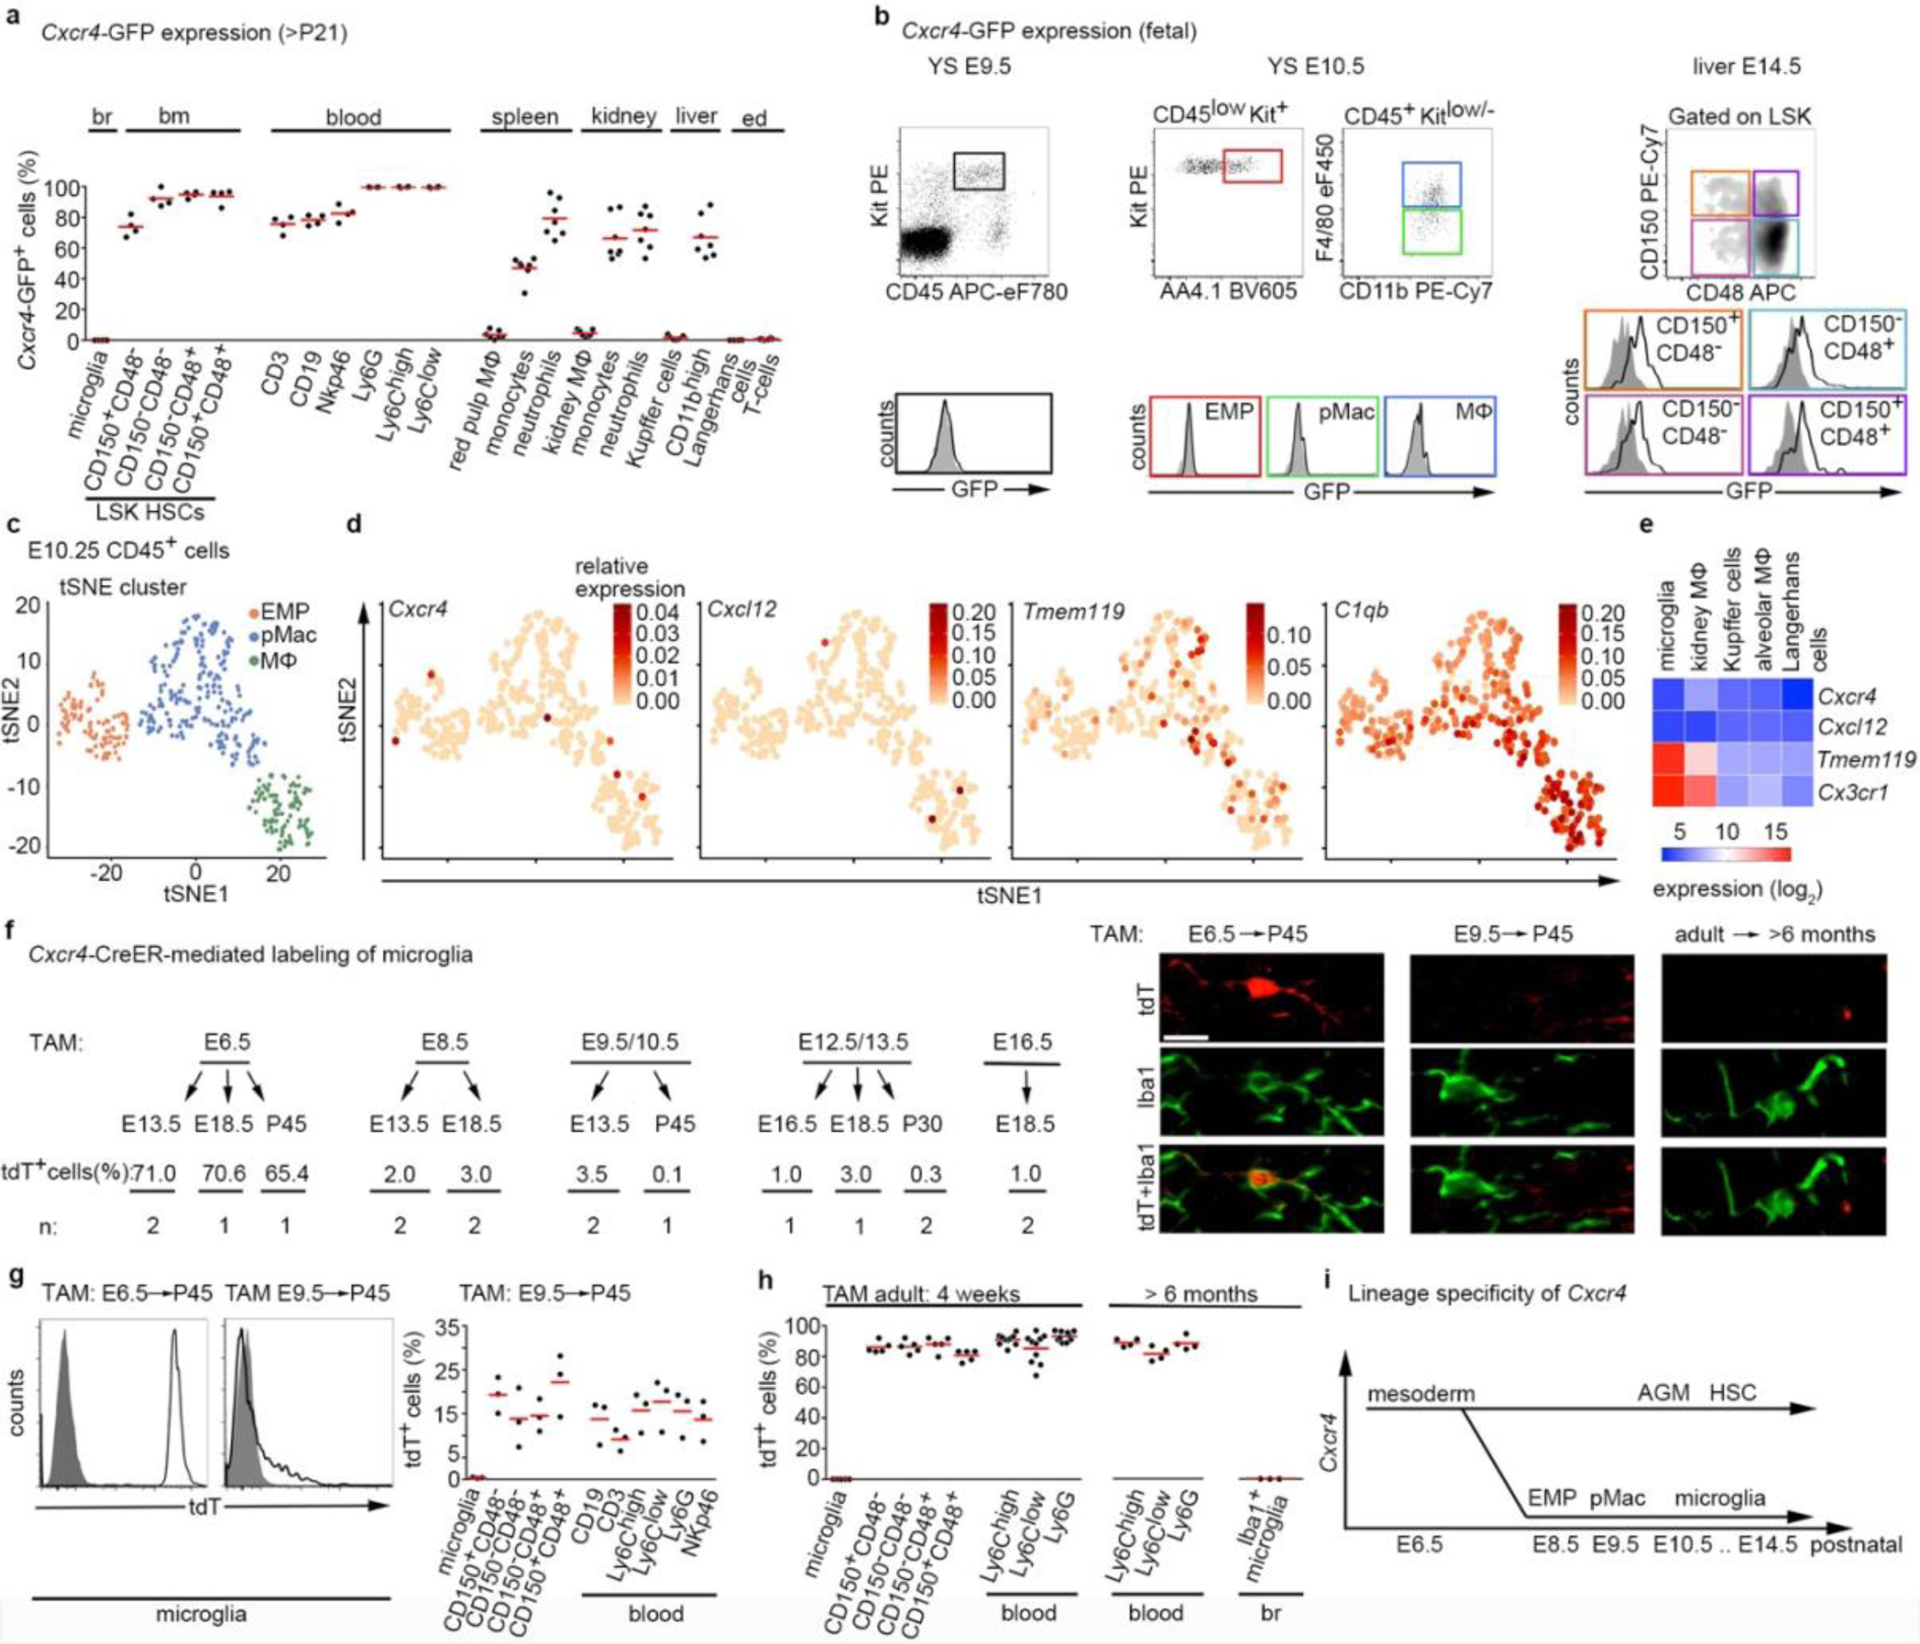
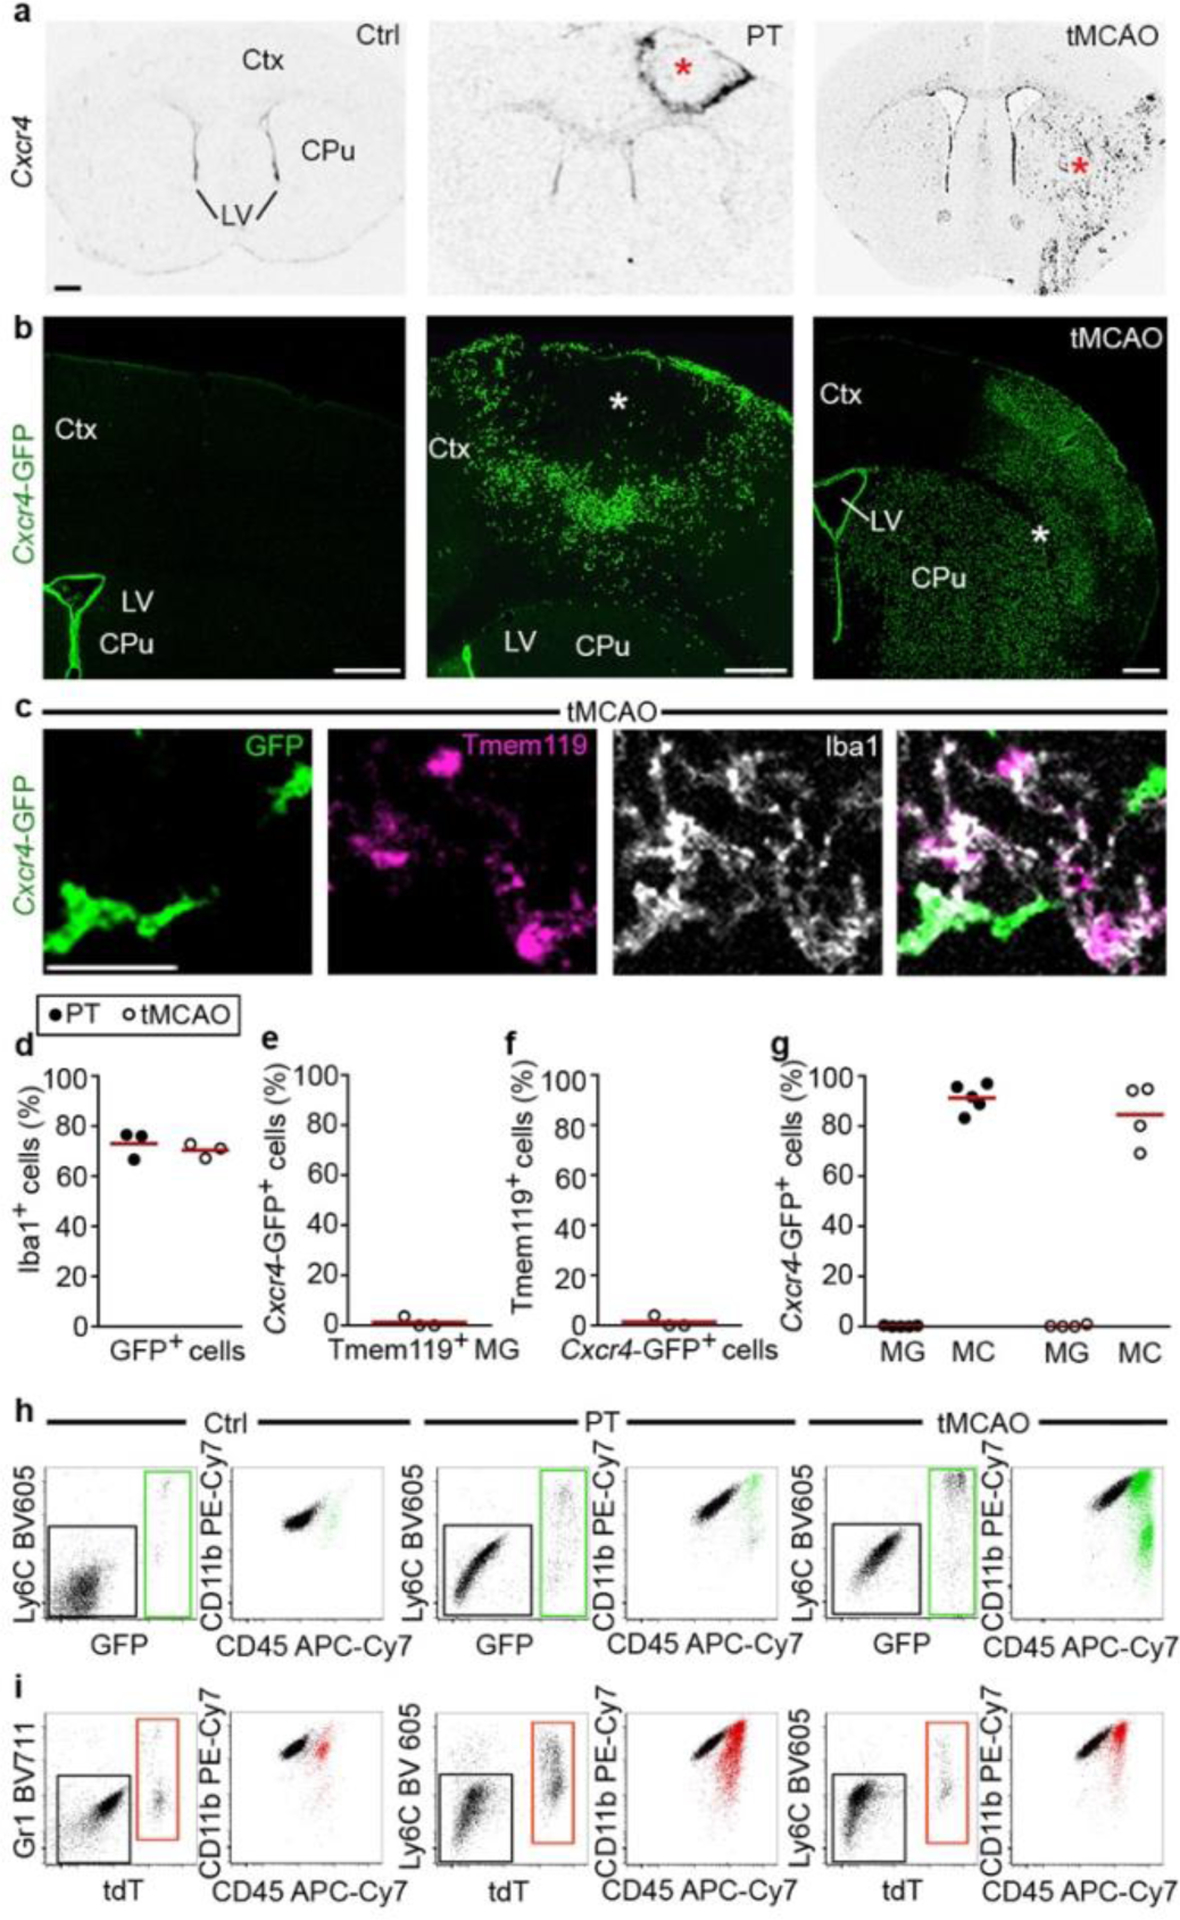
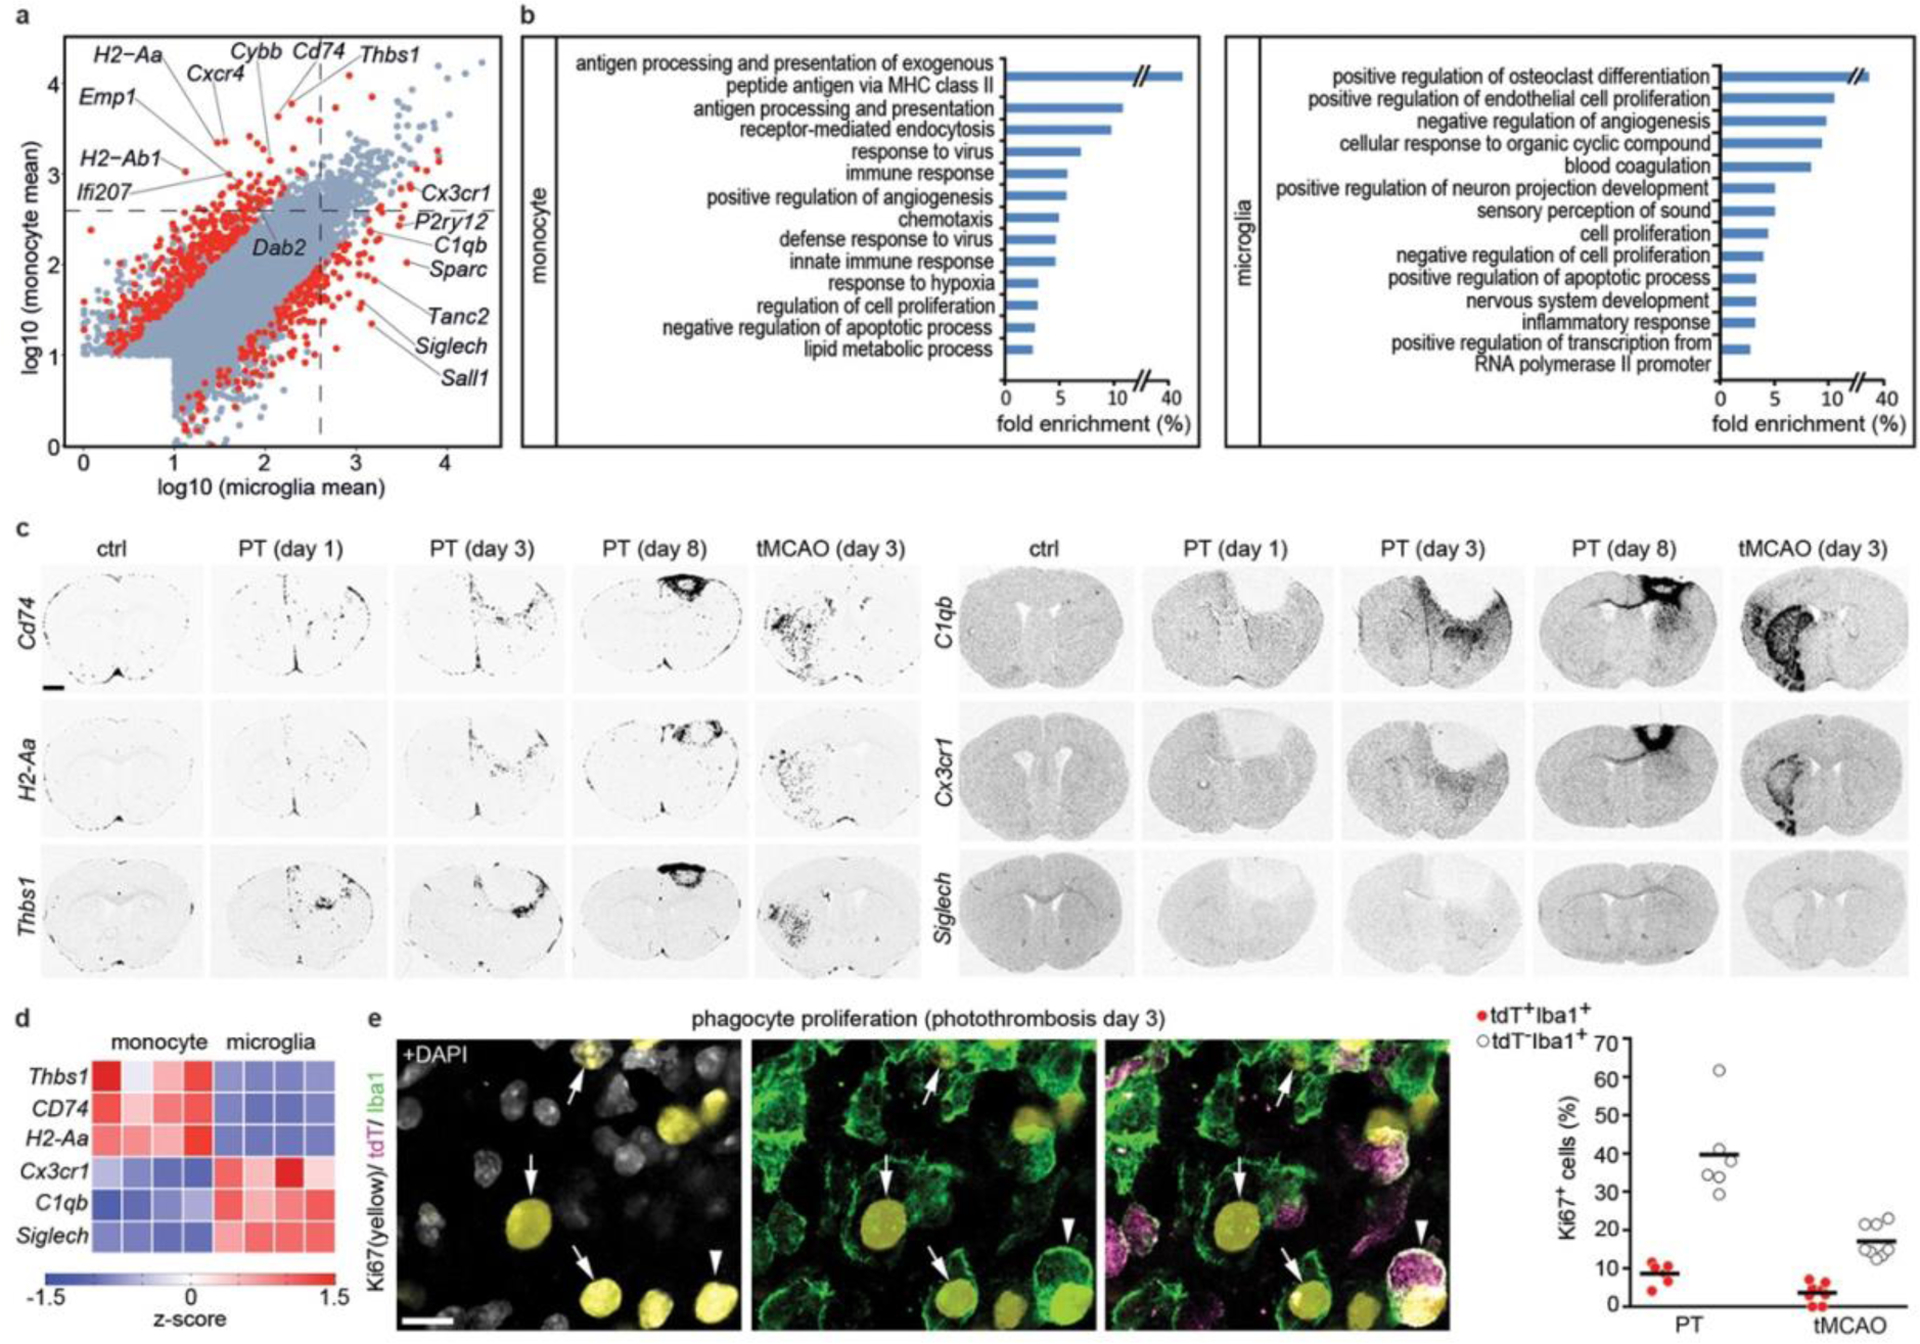
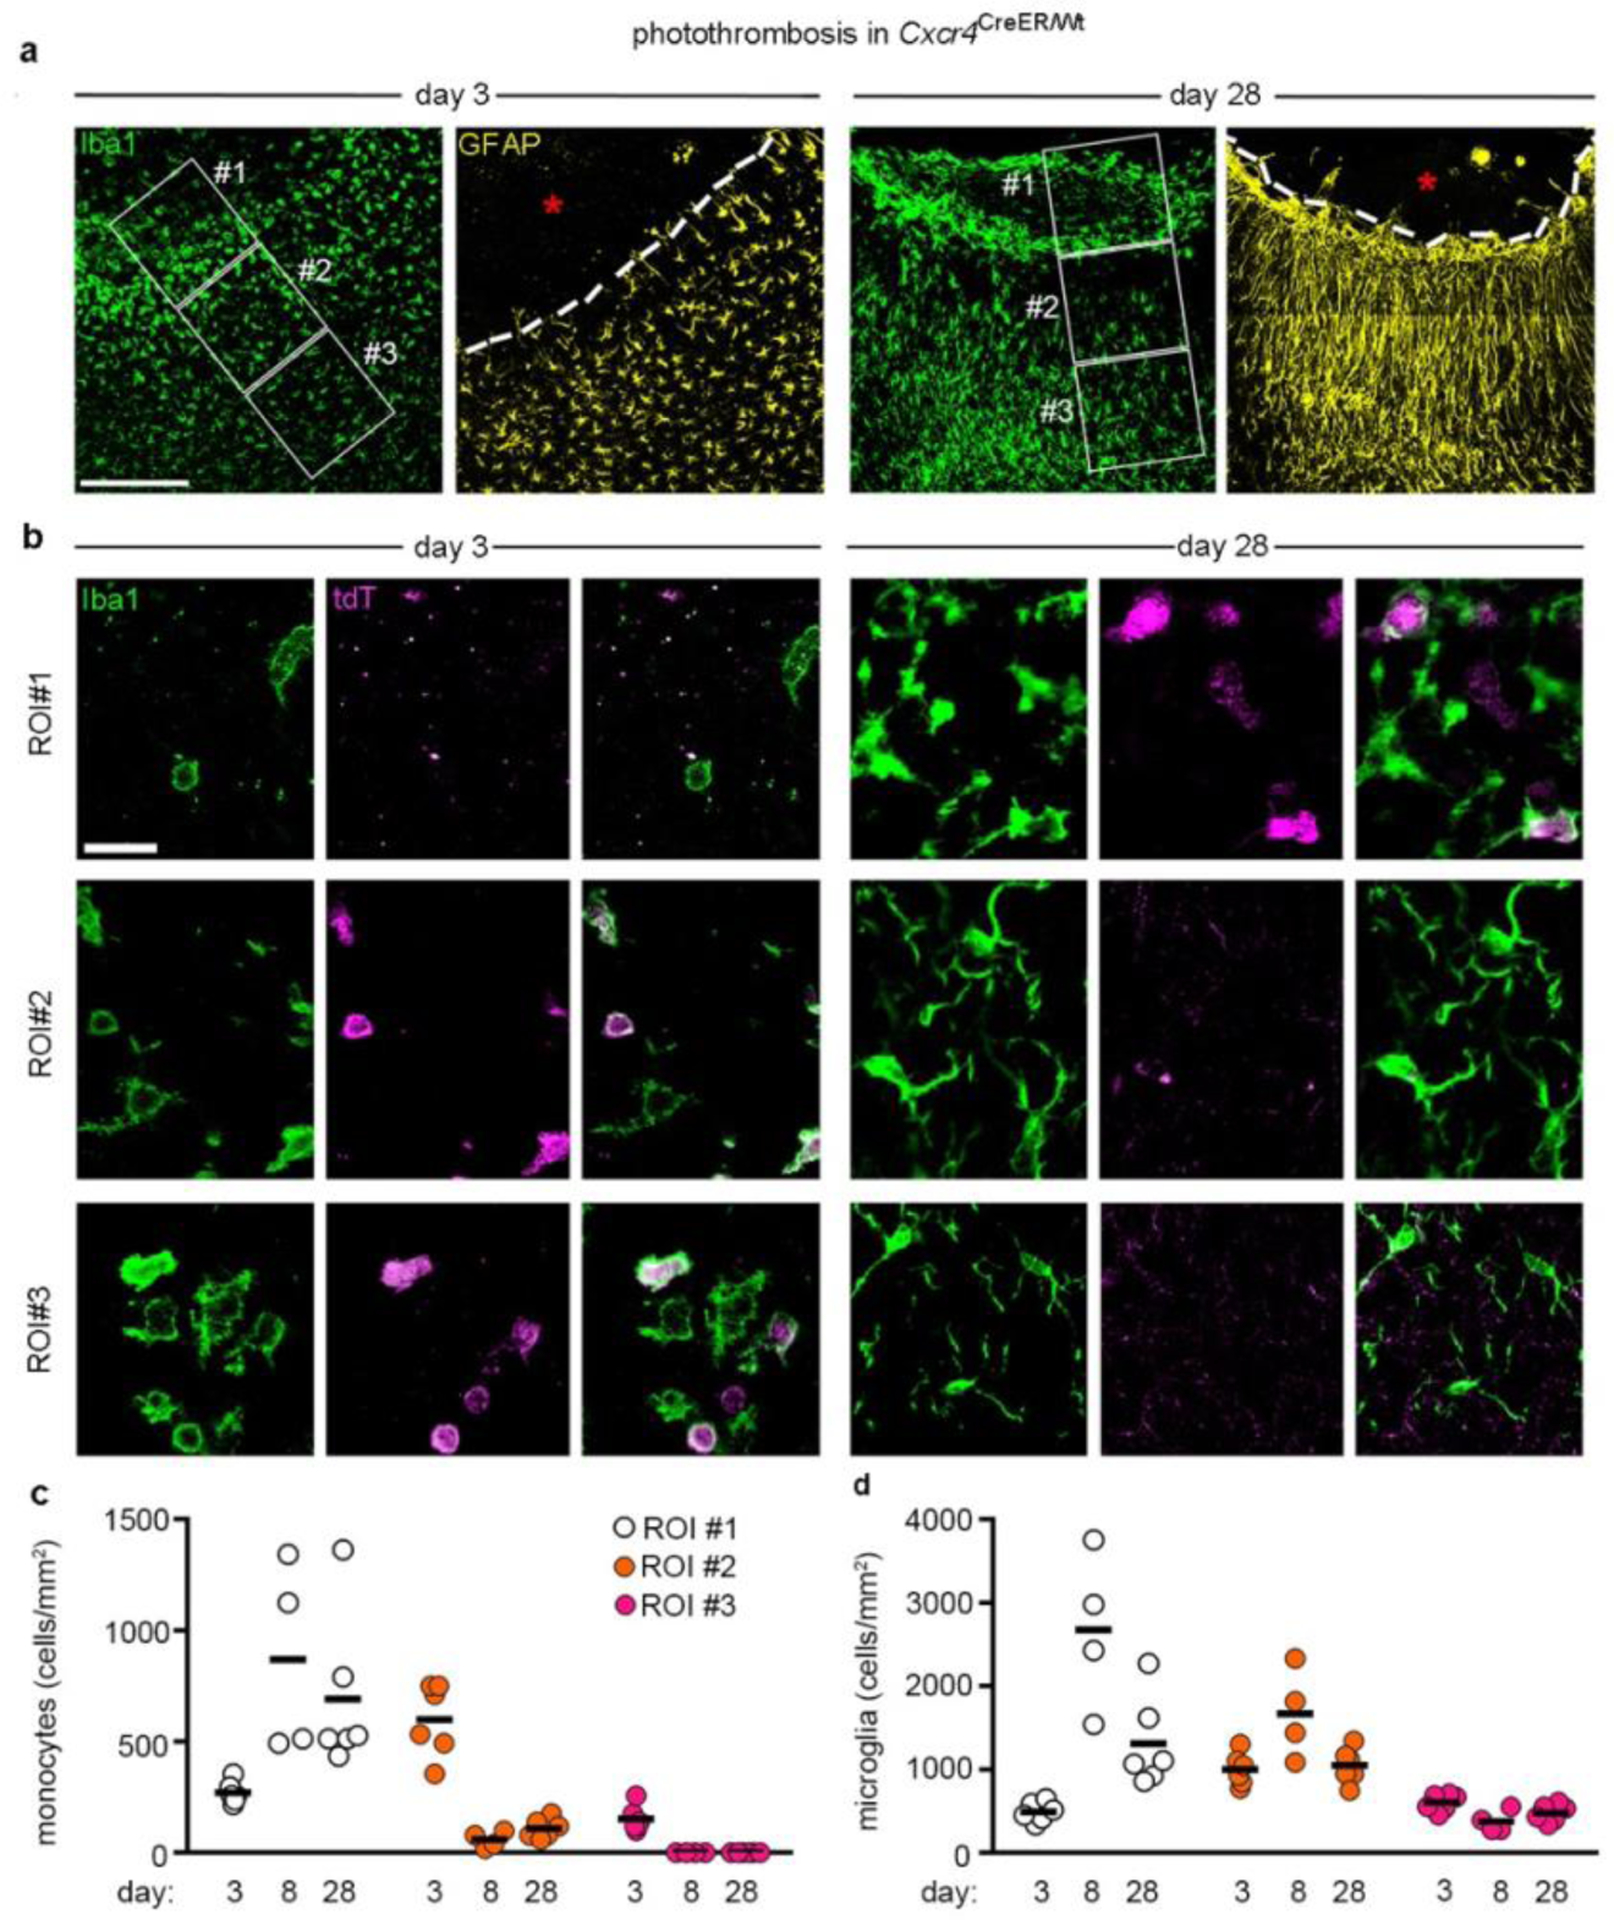
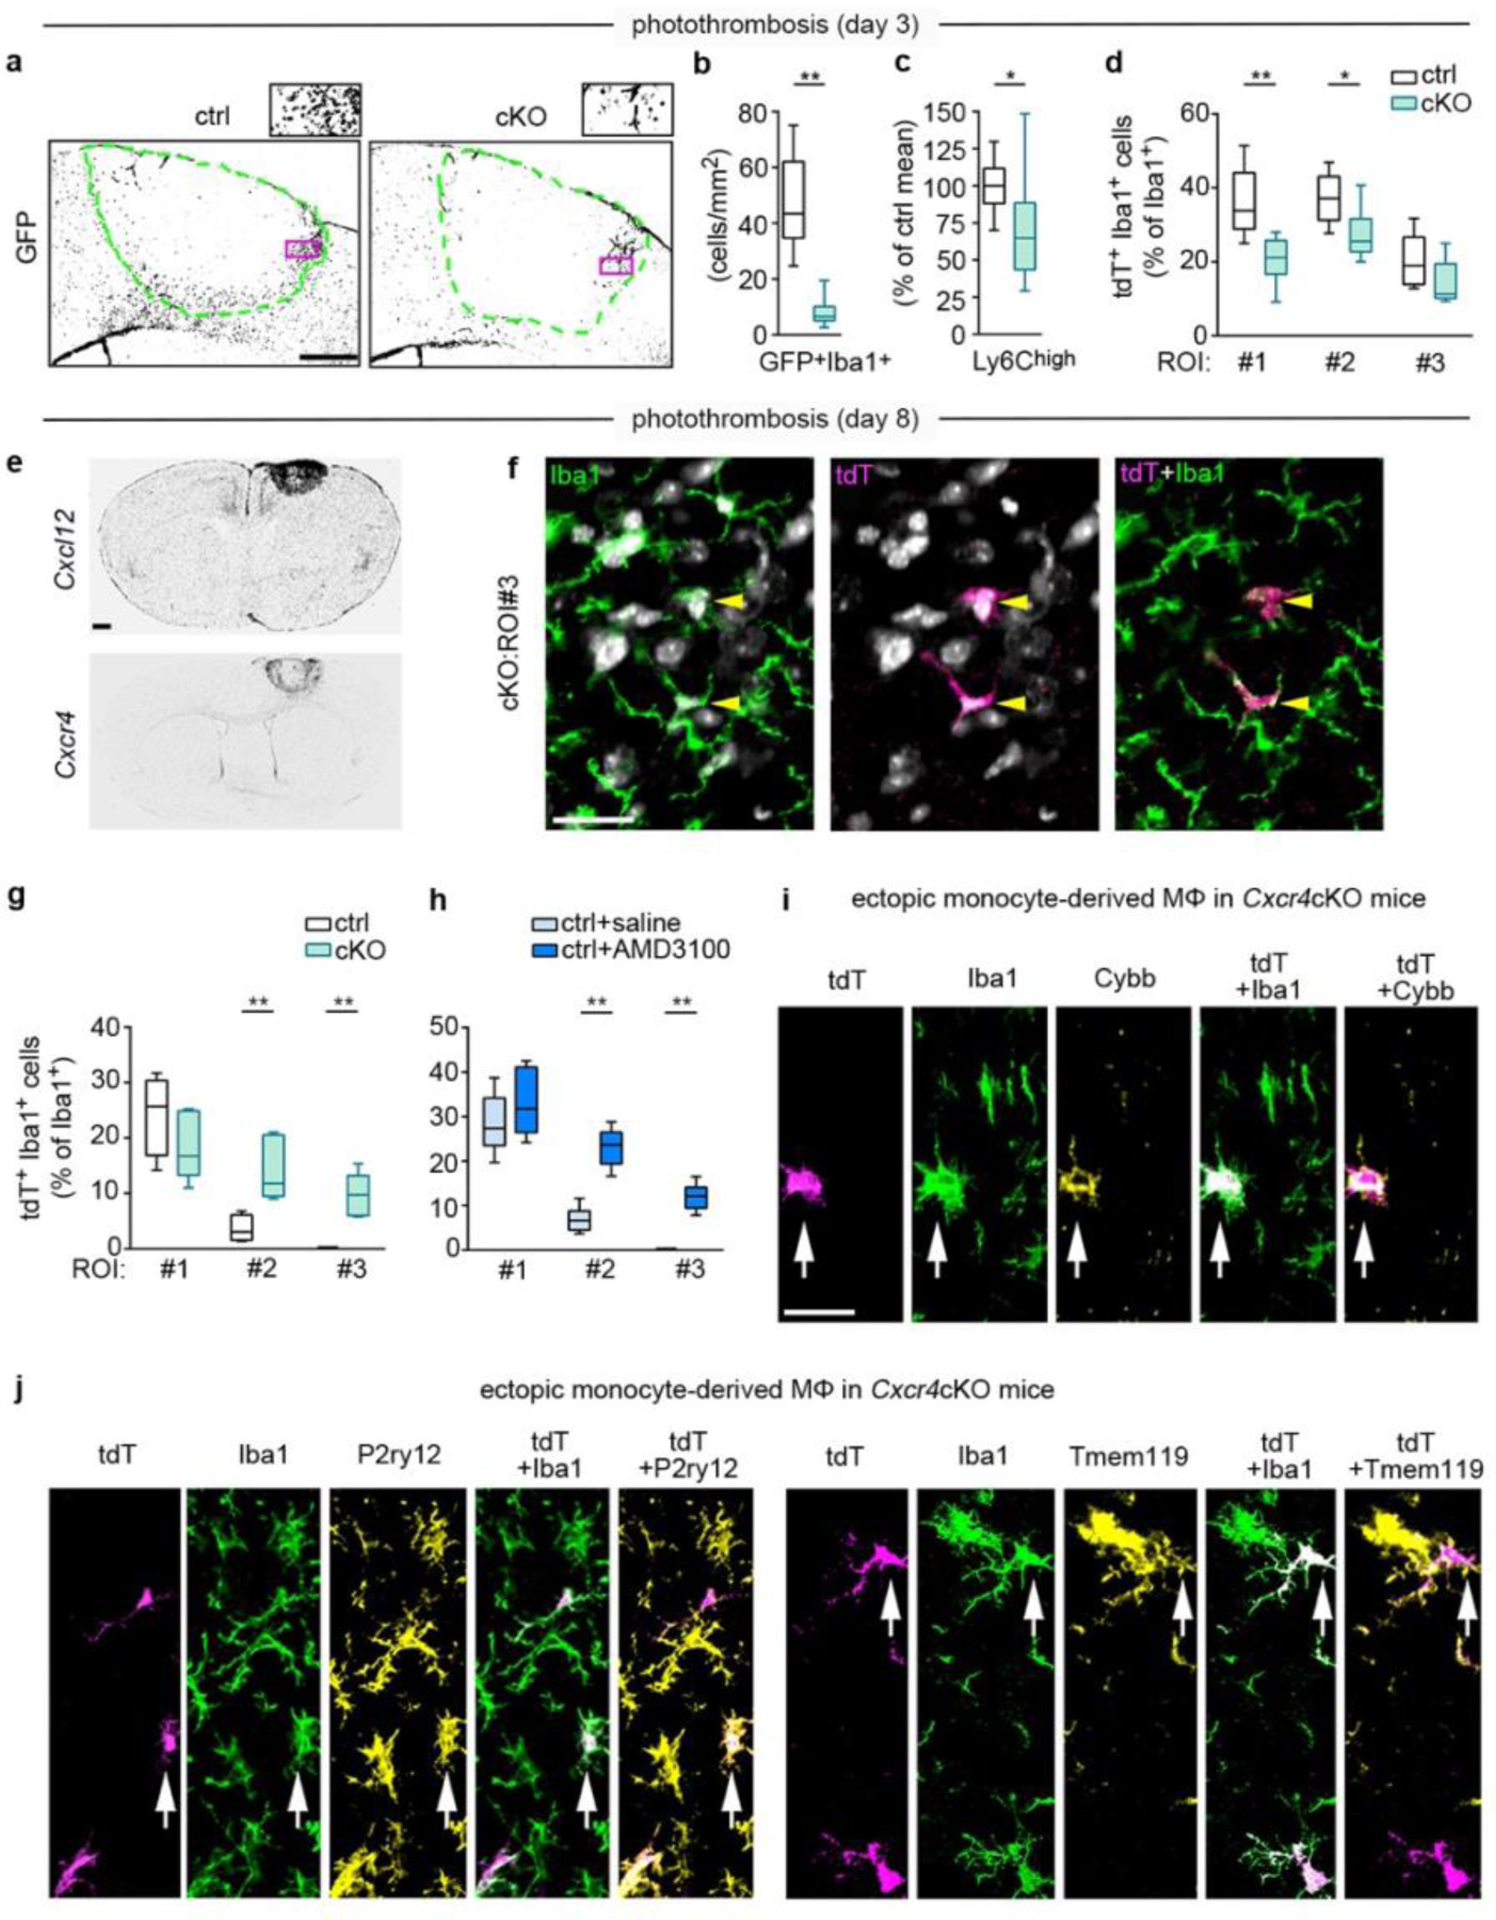
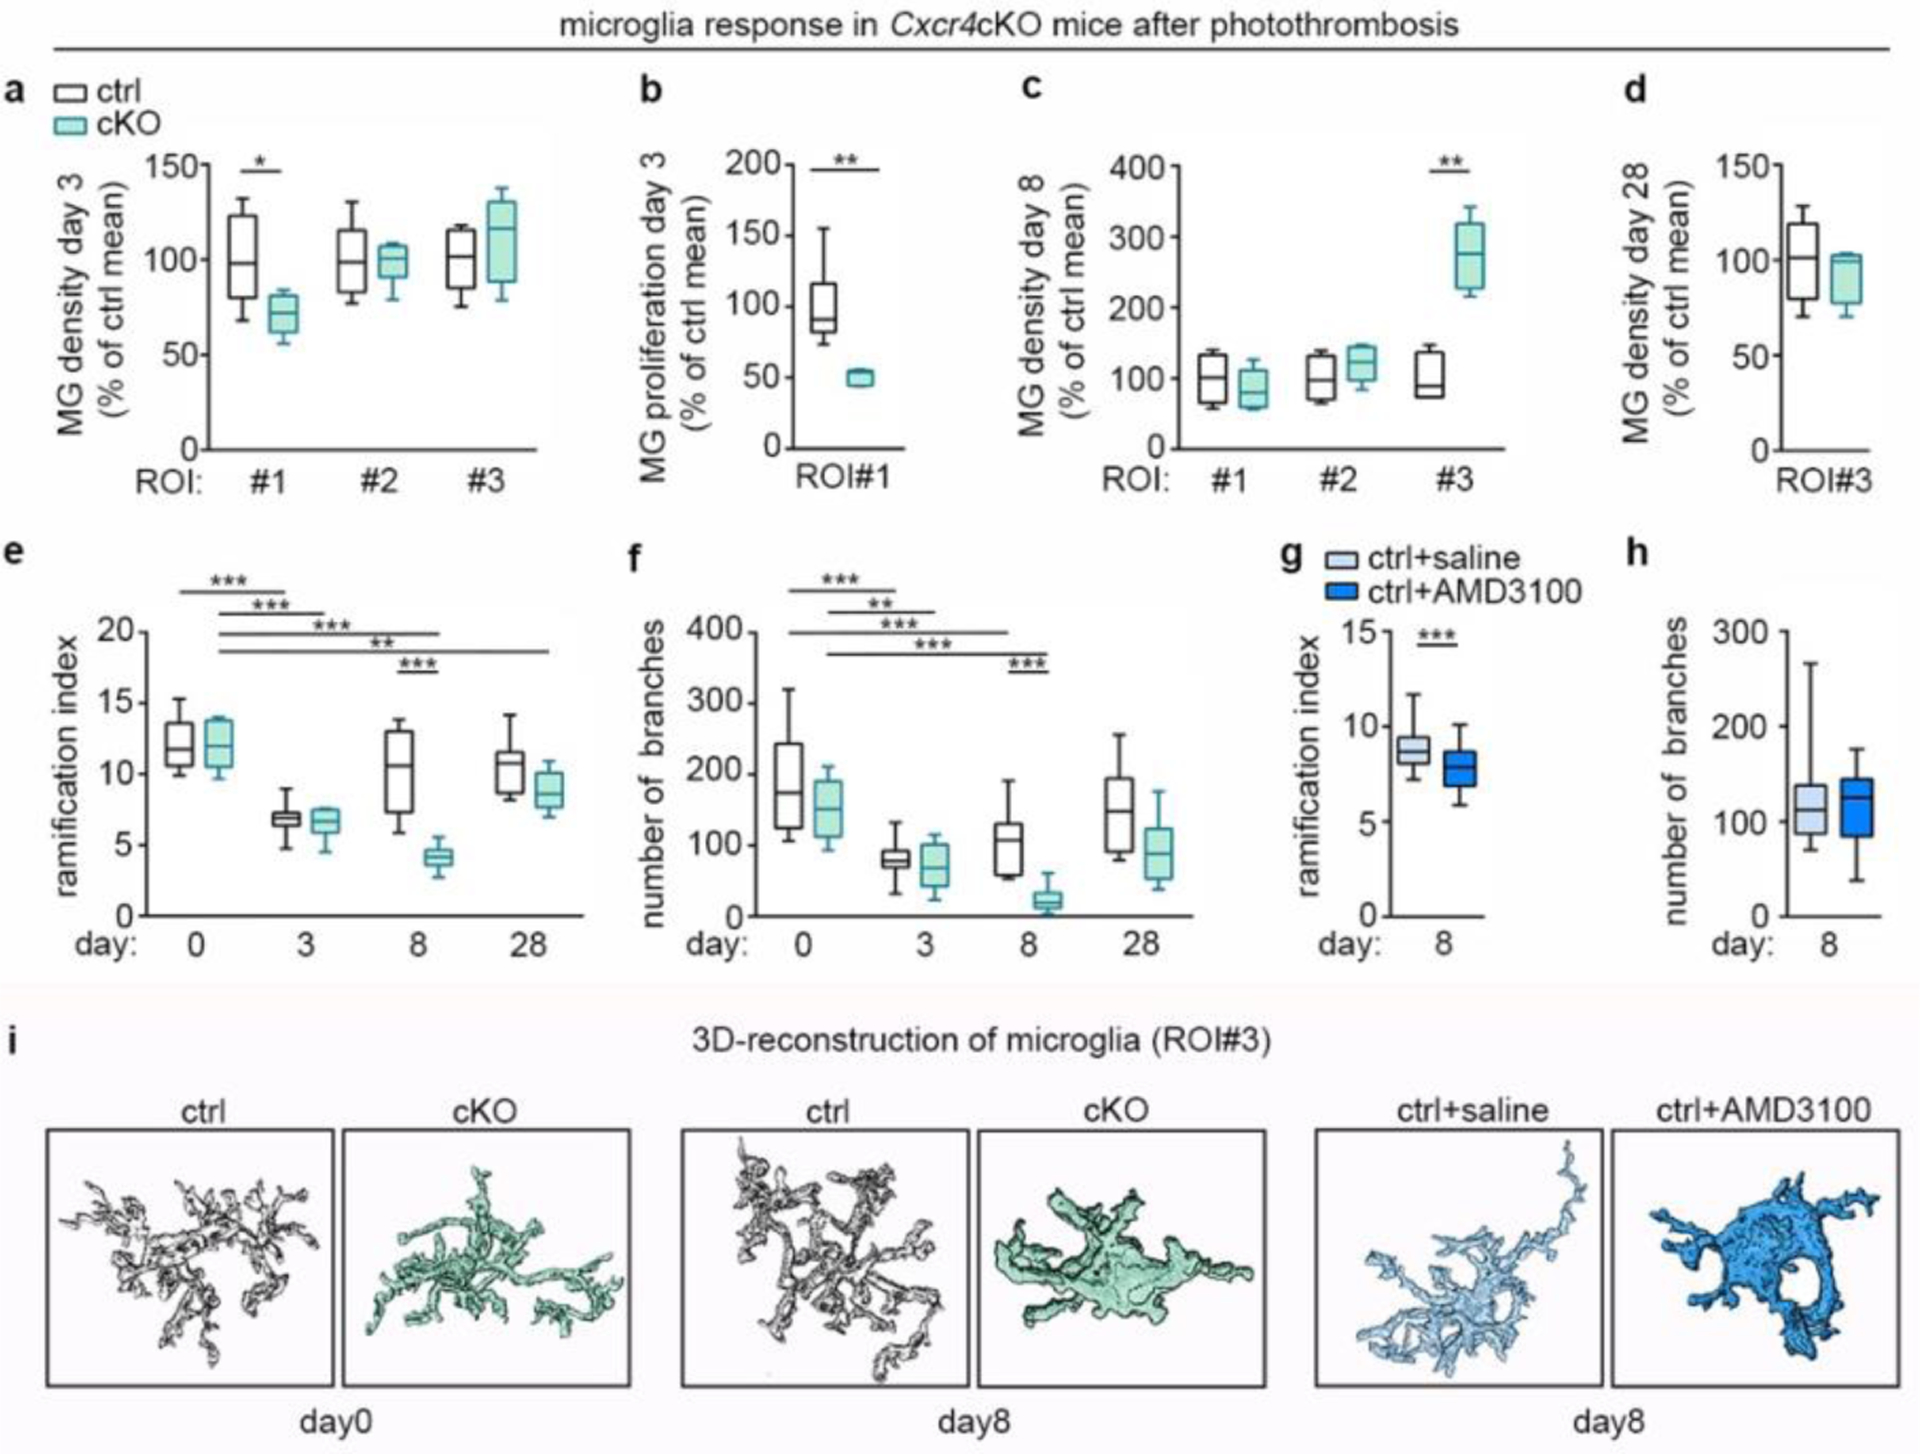
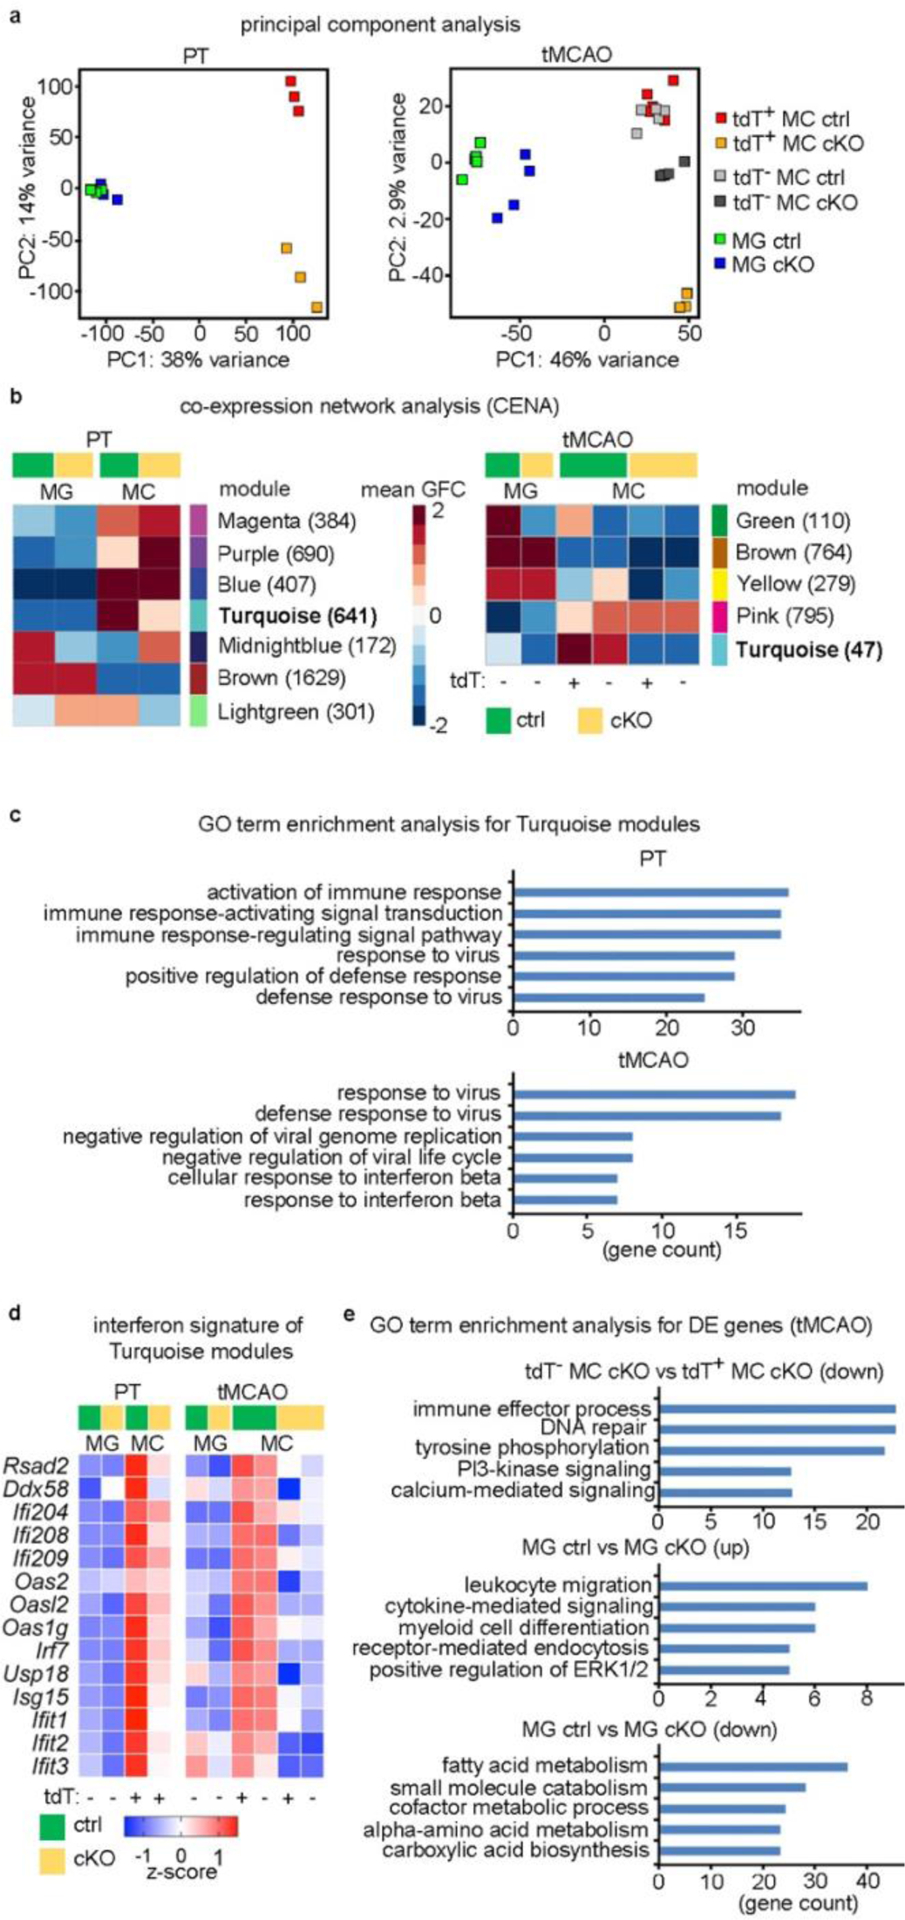
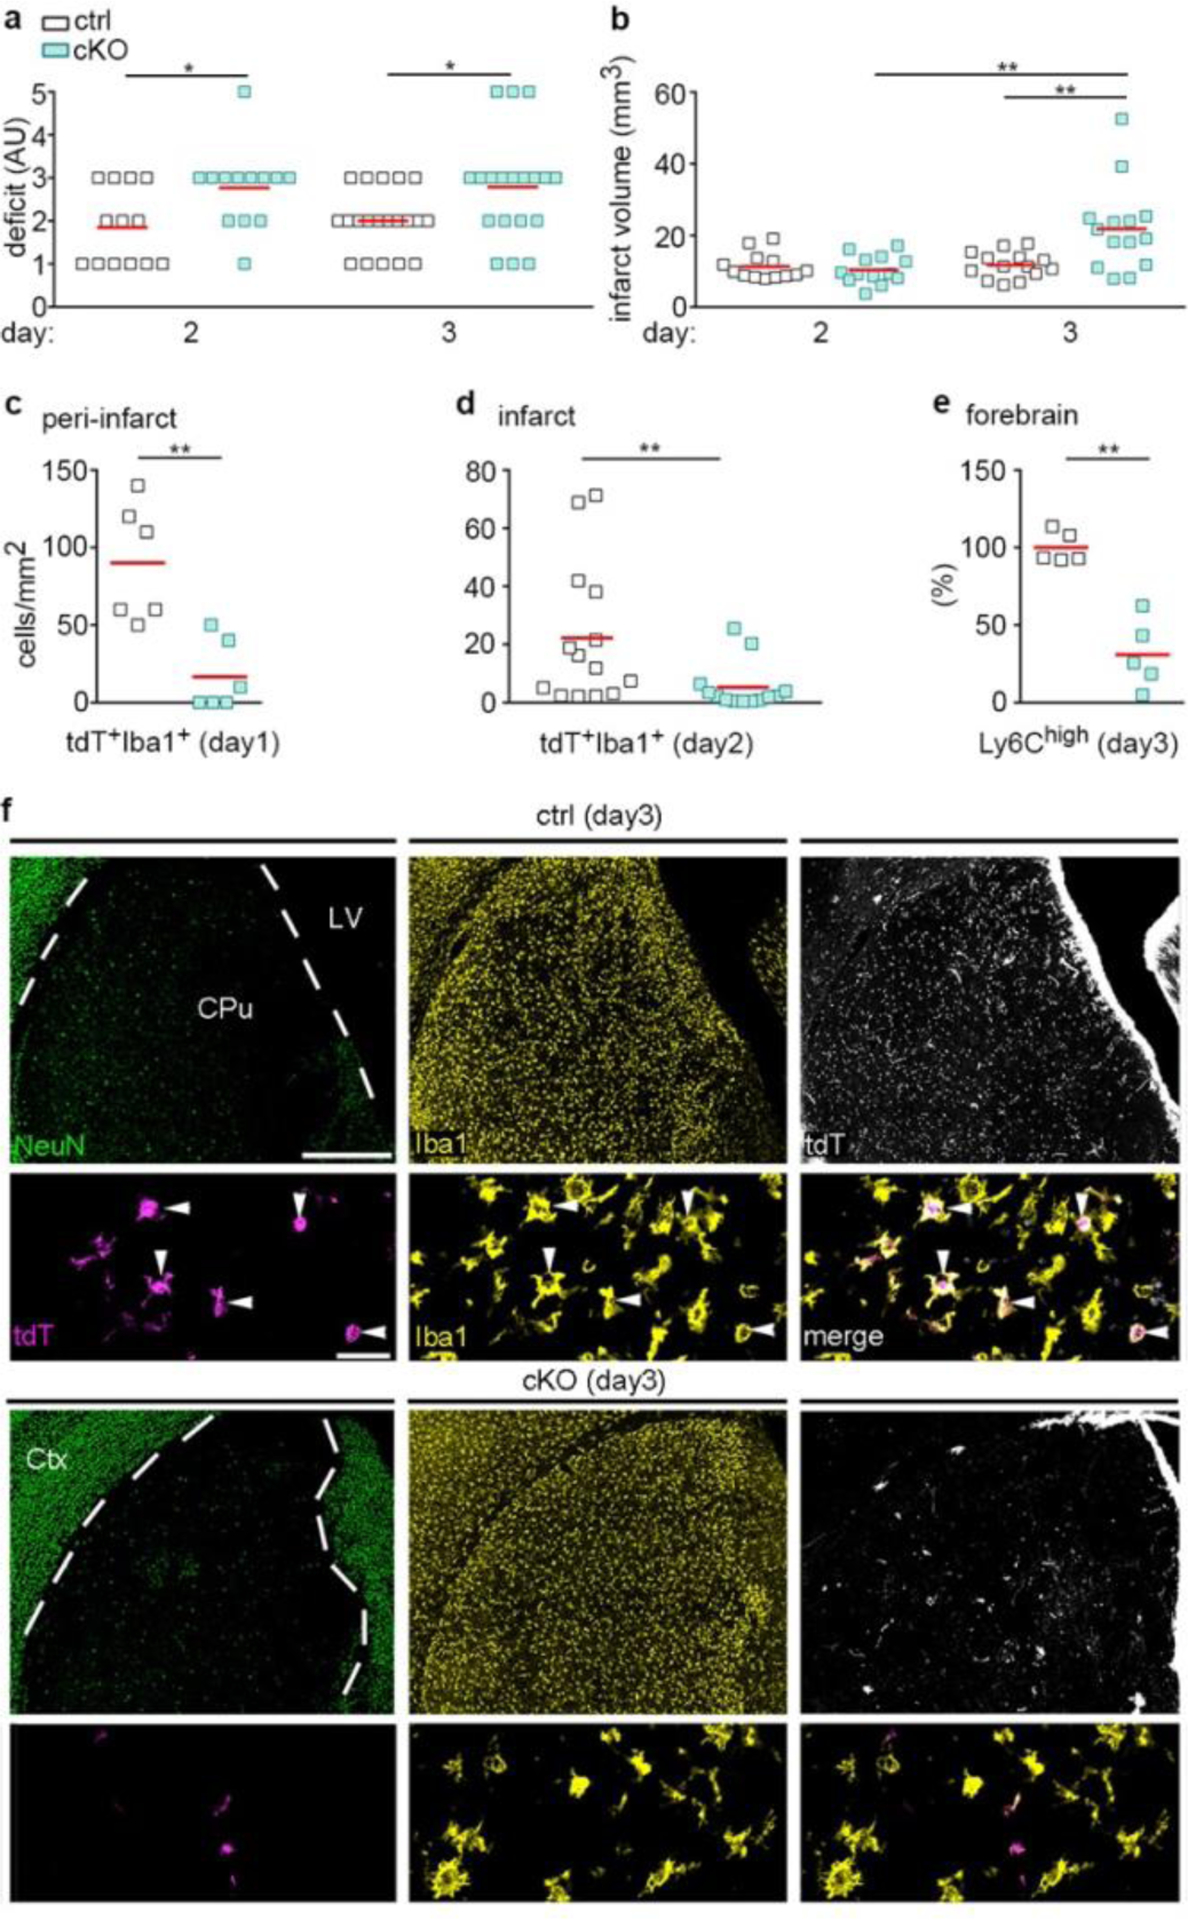
Monocyte-derived and tissue-resident macrophages are ontogenetically distinct components of the innate immune system. Assessment of their respective functions in pathology is complicated by changes to the macrophage phenotype during inflammation. Here we find that Cxcr4-CreER enables permanent genetic labeling of hematopoietic stem cells (HSCs) and distinguishes HSC-derived monocytes from microglia and other tissue-resident macrophages. By combining Cxcr4-CreER-mediated lineage tracing with Cxcr4 inhibition or conditional Cxcr4 ablation in photothrombotic stroke, we find that Cxcr4 promotes initial monocyte infiltration and subsequent territorial restriction of monocyte-derived macrophages to infarct tissue. After transient focal ischemia, Cxcr4 deficiency reduces monocyte infiltration and blunts the expression of pattern recognition and defense response genes in monocyte-derived macrophages. This is associated with an altered microglial response and deteriorated outcomes. Thus, Cxcr4 is essential for an innate-immune-system-mediated defense response after cerebral ischemia. We further propose Cxcr4-CreER as a universal tool to study functions of HSC-derived cells.


Conflict of interest statement

Competing Interests Statement

All authors declare no competing interests.

Figures

Extended Data Fig. 1:
Analysis of Cxcr4-GFP expression. a, Flow cytometry analysis of GFP signal in postnatal (>P21) Cxcr4-GFP mice (solid line histograms) and wild-type controls (filled histograms). Cells analyzed were blood leukocytes including B-cells (CD19+), T-cells (CD3+), natural killer cells (NKp46+), neutrophils (Ly6G+), Ly6Clow and Ly6Chi monocytes (CD115+ Ly6Clow/Ly6Chi), CD11b+ F4/80high tissue MΦ (gate 1), and CD11bhigh tissue myeloid cells (gates 2 and 3). Data are representative for n=4 (blood), n=7 (spleen, kidney, and liver), and n=6 (epidermis) mice. b, Confocal micrographs of immunofluorescences for GFP (green) and F4/80 (magenta) in the indicated tissues of postnatal Cxcr4-GFP mice (≥P28). Arrowheads point to Cxcr4-GFP+ F4/80 and arrows to Cxcr4-GFP F4/80+ cells. Representative for n=3 mice each. Scale bars: 45μm (b)
Extended Data Fig. 2:
Cxcl12 is dispensable for microglia to colonize the embryonic brain. a, Confocal analysis of Cxcr4 and Cxcr4-GFP expression in Iba1+ microglia at the indicated embryonic and postnatal stages (n=1 mouse each). The table shows the number of analyzed Iba1+ cells and the number of co-positives. b, Confocal micrographs demonstrate F4/80/Cxcr4 and Iba1/Cxcr4 dual immunofluorescences at E13.5 and E18.5, respectively (images are representative for n=1 mouse each). c, F4/80 immunofluorescence in coronal head sections of a wild-type mouse and a Cxcl12−/− littermate at E13.5. Graphs depict the number of F4/80+ cells per mm2 determined in 3 matched sectional planes in the dorsal and ventral telencephalon and in one sectional plane in the diencephalon of E13.5 wild-type mice and Cxcl12−/− littermates (images are representative for n=6 mice each). d, Layering of Iba1+ microglia in cortices of a Cxcr4-deficient mouse and a wild-type littermate at E16.5. The microglia-dense layer to the top represents the subdural meninx (images are representative for n=4 mice each). The graph shows the frequency of Iba1+ microglia in the indicated cortical layers as percentage of all counted microglia (n=4 mice each). e, Cxcr4 immunostaining in cortices of a Cxcr4-deficient mouse and a control littermate at E16.5 (n=4 mice each). Abbreviations: CP, cortical plate; Ctx, cerebral cortex; dTel, dorsal telencephalon; hTh, hypothalamus; IZ, intermediate zone; LV, lateral ventricle; MZ, marginal zone; SVZ, subventricular zone; Th, thalamus; vTel, ventral telencephalon; VZ, ventricular zone. Graphs and statistics: Circles and red lines show individual mice and mean values, respectively. No significant differences as by two-way ANOVA for sectional plane/genotype interaction for dorsal telencephalon (c, p=0.06) and ventral telencephalon (c, p=0.96) and for layer/genotype interaction for cerebral cortex (d, p=0.08) and by two-sided t test for diencephalon (c, p=0.8). Scale bars: 250 μm and 20 μm (b), 500 μm (c), 40 μm (d), and 10 μm (e).
Extended Data Fig. 3:
Characterization of Cxcr4CreER/wt; R26CAG-LSL-tdT mice. a, Schematic of the Cxcr4-CreER(T2)-IRES-eGFP allele generated by homologous recombination. Upper panel: Cxcr4 exons 1 and 2 (Ex1, Ex2) with the coding sequence in grey. Middle panel: In-frame fusion of the ATG in exon 1 with sequences for CreER(T2), internal ribosomal entry site (IRES), and eGFP. The insertions disrupt the Cxcr4 coding sequence. A neomycin positive selection cassette (neo) flanked by FRT sequences was placed downstream of eGFP. Lower panel: The recombined allele after excision of neo. Primers used for genotyping (arrowheads): Cxcr4-upper (black), Cxcr4-lower (blue), Cxcr4-CreER-lower (purple); primer sequences are detailed in the Methods. Right panel: Southern blot of NheI-digested genomic DNA hybridized with a 5′ Cxcr4 probe identifies the 8.5 kb Flp-excised Cxcr4-CreER fragment and the 4.5 kb Cxcr4 wild-type fragment (blot is representative for n=7 mice). b, Analysis of tdT signal in tissue MΦ and blood cells in adult mice 4 weeks after TAM. Immunofluorescences show tdT (magenta) and F4/80 (green) in the indicated tissues with DAPI in white. Arrowheads identify tdT+ F4/80 cells and arrows tdT F4/80+ cells. Images are representative for n=3 mice. The graph shows flow cytometry analyses of the tdT+ percentage for the indicated cell types (spleen, kidney, and epidermis: n=4 mice; liver: n=3 mice). c, Immunostained Cxcr4-IRES-GFP and tdT in TAM-naïve (−TAM) and TAM-treated (+TAM) P148 mice receiving TAM from P113–P11 (images are representative for n=3 mice each). d, The graph shows the tdT+ percentage for LSK HSCs (n=2 mice) and CD11b+ blood cells (n=5 mice) in adult TAM-naïve (−TAM) condition. e–g, Stroke was induced by tMCAO or PT in adult mice ≥28 d after TAM treatment. Micrographs show dual immunofluorescences for tdT/Iba1 (e, representative for n=8 mice) and tdT/Tmem119 (f, representative for n=8 mice) in the striatal infarct 3 days after tMCAO and a triple immunofluorescence for Cxcr4-IRES-GFP/tdT/Iba1 in the cortical infarct 3 days after PT (g, representative for n=6 mice). DAPI appears white. Graphs depict the tdT+ percentage for Iba1+ cells (e, n=8 mice) and for GFP+ Iba1+ cells (h, n=6 mice) as well as the GFP+ percentage for tdT Iba1+ cells (i, n=6 mice). Graphs: Circles and red lines represent individual mice and mean values, respectively. Scale bars: 40 μm (b), 500μm (c), 40 μm (d), 20 μm (e,f), and 15 μm (g).
Extended Data Fig. 4:
RNA-seq analysis of the gene expression of monocytes and microglia in photothrombotic infarcts. a–f,i, RNA-seq was performed with Cxcr4-GFP+ Ly6Chigh monocytes (Ly6G CD11b+ CD45high) and Cxcr4-GFP microglia (Ly6G CD11b+ CD45low) sorted from the injured cortex at day 3 after PT (n=4 mice). a, Scheme describing the workflow. Differentially expressed (DE) genes were defined by |fold change (FC)|>4 and false discovery rate (FDR)<0.3. Statistical test: one-way ANOVA. b, Normalized RNA-seq counts for the indicated genes (center line, median; box limits, 25th to 75th percentiles; whiskers, min to max) (n=4 mice each). c, Gene Set Enrichment Analysis (GSEA) with all present genes using markers of monocytes, microglia, and neutrophils as gene sets. The plot shows normalized enrichment scores (NES) versus enrichment p-values (FDR). Sources of the marker sets [1] – [3] are detailed in the Methods. Statistical test for nominal p-value of the enrichment score: empirical phenotype-based permutation test. d, Principal component analysis (PCA) with all present genes. e, Hierarchical clustering (HC) showing z-transformed normalized expression values of the top 500 most variable DE genes colored from blue to red. f, GeneOntology (GO) term enrichment analysis of DE genes. Bars depict fold enrichment for terms with p-value <0.05. Statistical test: EASE Scores (one-tail) calculated with DAVID Bioinformatics. g,h, The indicated transcripts were detected by in situ hybridization (black signal). Images depict the ipsilateral CPu after tMCAO (g) and the border zone of the cortical infarct after PT (h). Infarcts are indicated by asterisks. The contralateral side and the cortex of naïve mice (ctrl) serve as references in (g) and (h), respectively. Sections from mice undergoing tMCAO were counterstained with cresyl violet. Images are representative for n=2 (ctrl) and n=3 (stroke). i, Venn diagrams for DE monocyte and microglia genes. The GFP+ monocyte and GFP microglia gene sets correspond to the data shown in (a). DE genes (|FC|>1.5 and FDR<0.05) for tdT+ monocytes and tdT microglia were obtained by RNA-seq with cells isolated from Cxcr4CreER/wt; R26CAG-LSL-tdT mice at day 3 after PT (n=3) and tMCAO (n=5). Statistical test: Wald test with likelihood ratio test. See Supplementary Table 4 for lists of the DE genes and intersecting sets. Scale bars: 1000 μ(g), 200 μm (h).
Extended Data Fig. 5:
Reperfusion facilitates monocyte infiltration in the infarct territory. a,b, Low magnification images show Cxcr4-GFP at the indicated time points after PT (a) and tMCAO (b) in coronal sections immunostained for GFP and Iba1 (asterisks identify the infarct). Insets represent the framed areas and demonstrate that GFP+ cells in the peri-infarct area are frequently Iba1+ at days 1 and 2 but are Iba1 at day 8. Images are representative for n=3 mice (day 1 and day 8) and n=2 mice (day 2) per condition. c–f, High-power confocal images of double-immunofluorescences for GFP/NeuN (c), GFP/GFAP (d,e), and GFP/PECAM (f) at day 3 after stroke induction with GFP in green and NeuN, GFAP, and PECAM in magenta. Cxcr4-GFP+ phagocytes are demonstrated next to NeuN+ neurons (c) and GFAP+ astrocytes (d,e). Few Cxcr4-GFP+ infiltrates are associated with PECAM+ endothelial cells (f, arrowheads). Images are representative for n=3 mice per condition. g, Dual immunofluorescences for GFP/Iba1 in the infarct area at day 1 and day 8 after PT and at day 1 after tMCAO. Images are representative for n=3 mice per condition. Abbreviations: CPu, caudate-putamen; Ctx, cerebral cortex; LV, lateral ventricle. Scale bars: 500 μm (a,b) and 20 μm (c–g).
Extended Data Fig. 6:
Effect of Cxcr4cKO on blood leukocytes. Cxcr4CreER/wt; R26CAG-LSL-tdT (ctrl) and Cxcr4CreER/LoxP; R26CAG-LSL-tdT mice (cKO) received TAM at adult age and were analyzed ≥4 weeks after TAM. a, Relative Cxcr4 expression determined by real-time PCR with cDNA from sorted tdT+ blood monocytes. Single values were normalized to the mean of CreER/Wt. b, Migration index for Cxcl12-induced transwell migration of CD11b+ BM cells. c,d, Numbers of total leukocytes, monocytes (MC), and neutrophilic granulocytes (NG) in gigaparticles (Gpt) per liter blood as determined by leukograms. e,f, Flow cytometry analysis of tdT+ percentages for neutrophilic granulocytes, monocytes, and LSK HSCs. Red lines indicate mean values and squares individual mice. Abbreviations: MC, monocytes; NG, neutrophilic granulocytes. Statistics: a, *p=0.03 (n=4 mice each); b, **p=0.008 (n=5 mice each); c, p=0.79 (ctrl, n=15 mice; cKO, n=19 mice); d, p=0.86 (MC), p=0.07 (NG) (n=11 mice); e, ***p<0.0001 (ctrl, n=10 mice, cKO, n=9 mice); f, *p=0.03 (CD150+ CD48), *p=0.02 (CD150 CD48), **p=0.008 (CD150 CD48+) (n=5 mice each). a–f, Two-sided Mann-Whitney U test.
Extended Data Fig. 7:
Intrainfarct application of AMD3100 induces ectopic positioning of MDM after PT. Cxcr4CreER/wt; R26CAG-LSL-tdT mice received saline or AMD3100 into the infarct at day 8 after PT via stereotactically-controlled injection. Images were captured 6 hours after substance application. a, Counterstained tdT and GFAP. Regions of interest (ROIs) used to quantify the presence of MDM are illustrated (ROI#1: infarct, ROI#2: peri-infarct, ROI#3: intact region). b, Iba1 staining (green) is shown for cells labeled with arrows in a. DAPI appears white. The depicted tdT+ cells in the saline-treated animal are Iba1 presumptive neurons. The tdT+ Iba1+ cell in the AMD3100-treated animal represents an ectopic MDM in ROI#3. a,b, Images are representative for n=6 each. Scale bars: 200 μm (a), 20 μm (b).
Extended Data Fig. 8:
Diencephalic infarcts and reduced monocyte infiltration in Cxcr4cKO mice undergoing tMCAO. a, Images demonstrate degenerated areas in the diencephalon of two Cxcr4cKO mice undergoing tMCAO. Segmented lines identify the thalamus and hypothalamus. Arrows point to degenerated/NeuN regions. Images are representative for n=13 mice (day 2) and n=15 mice (day 3). b, Confocal images of Neu/Iba1/tdT immunofluorescences in a Cxcr4-control (ctrl) and a Cxcr4cKO (cKO) at day 1 after tMCAO. Segmented lines identify the infarct area. High magnification images were photographed in the NeuN+ peri-infarct area in the olfactory tubercle. Images are representative for n=6 mice each. Abbreviations: CPu, caudate putamen; hTh, hypothalamus; oTb, olfactory tubercle; Th, thalamus. Scale bars: 500 μm (a); 500 μm and 30 μm (b).
Figure 1.
Figure 1.
Developmental expression of Cxcr4 in hematopoietic cells. a, Flow cytometry analysis of GFP in Cxcr4-GFP mice. The graph depicts the GFP+ percentage for microglia (CD11b+CD45low), LSK HSCs, blood leukocytes (CD3+ T-cells, CD19+ B-cells, NKp46+ natural killer cells, Ly6G+ neutrophils and CD115+ Ly6Clow/Ly6C+ monocytes), CD11b+ F4/80high tissue macrophages (MΦ), including Kupffer cells and Langerhans cells and CD11b+ F4/80−/low tissue myeloid cells from Cxcr4-GFP mice (>P21). b, Flow cytometry analysis of GFP expression in hematopoietic cells from fetal Cxcr4-GFP (solid line) and wild-type (filled) mice. Cells analyzed were Kit+ EMPs, F4/80 pMacs and F4/80+ macrophages in E9.5 and E10.5 yolk sac (YS), as well as LSK HSCs in E14.5 liver. c, t-Distributed stochastic neighbor embedding (tSNE) plot of single-cell RNA-seq data showing distribution of CD45low/+ cells from E10.25 embryos into three clusters. Cluster distribution based on DBScan is overlaid onto the graph and corresponds to EMPs, pMacs, and macrophages. d, tSNE plot as in (c), overlaid with the relative expression values for Cxcr4, Cxcl12, Tmem119 and C1qb. e, Heatmap representation of selected genes from bulk RNA-seq of macrophages from indicated P21 tissues. f, Left: contribution of Cxcr4 lineage-derived cells to microglia in Cxcr4CreER/wt;R26CAG-LSL-tdT mice pulsed with TAM at the indicated stages of embryonic development. The tdT signal was assessed by confocal microscopy in ≥100 microglia per mouse. Data represent mean values of the tdT+ percentage (n: number of analyzed mice). Right: confocal micrographs demonstrate double immunofluorescence for Iba1 and tdT. Scale bar, 10μm (applies to all images). g, Left: solid line histograms showing the tdT signal in CD11b+CD45low microglia from E6.5-pulsed and E9.5-pulsed P45 Cxcr4CreER/wt; R26CAG-LSL-tdT mice. Filled histograms show TAM- Cxcr4CreER/wt; R26CAG-LSL-tdT controls. Right: scatter dot plot show the percentage of tdT+ cells for microglia (CD11b+CD45low), LSK HSCs, and leukocyte subpopulations obtained from P45 Cxcr4CreER/wt;R26CAG-LSL-tdT mice receiving TAM at E9.5. h, Percentage of tdT+ cells for microglia, HSCs and leukocytes from Cxcr4CreER/wt; R26CAG-LSL-tdT mice receiving TAM at adult age. Flow cytometry analyses took place 4 weeks and >6 months after TAM as indicated. Iba1+ microglia in the >6 months cohort was assessed by confocal microscopy. i, Schematic summarizing developmental expression of Cxcr4 in the hematopoietic lineages giving rise to tissue-resident macrophages and HSCs. AGM, aorta-gonad-mesonephros. In all graphs, circles and lines represent individual mice and mean values, respectively. Statistics: a, n=6 (brain, BM, blood and epidermis) or 7 (spleen, kidney and liver) mice; b, data are representative for n=5 mice each; c,d, data represent 408 single cells from n = 2 independent experiments with four and six embryos per experiment. e, mean from n = 2 animals and n = 2 technical replicates, except lung, where n = 1 animal and n = 2 technical replicates; g, data for both graphs are representative for n = 3 mice each. h, for analyses at 4 weeks n = 5 (microglia and BM) or 10 (blood) mice; for >6 months: n = 4 (blood) or 3 (microglia) mice. Panel c adapted from , with permission from AAAS.
Figure 2.
Figure 2.
Cxcr4 is differentially expressed in MDMs and reactive microglia at day 3 after stroke induction. a, ISH for Cxcr4 in coronal brain sections of wild-type mice, with the cerebral cortex (Ctx), caudate putamen (CPu) and lateral ventricle (LV) highlighted. Images depict the control condition (Ctrl), PT and tMCAO. b, Immunofluorescence for GFP in Cxcr4-GFP mice. Asterisks in (a) and (b) identify the infarct territory. Scale bar, 500μm (applies to all images in (a) and (b)). c, Confocal images showing triple immunofluorescence for GFP, Tmem119 and Iba1 in the infarct of a Cxcr4-GFP mouse undergoing tMCAO. Scale bar, 45μm. d–f, Overlap of Cxcr4-GFP with Iba1 and Tmem119 in the infarct territory as determined by confocal microscopy. Graphs show the Iba1+ percentage for Cxcr4-GFP+ cells (d), the GFP+ percentage for Iba1+Tmem119+ microglia (e) and the Tmem119+ percentage for GFP+ Iba1+ cells (f). Keys in (d) applies to (e) – (g). g–i, Immunophenotyping of GFP+ cells (green) from Cxcr4-GFP mice (g,h) and tdT+ cells (red) from Cxcr4CreER/wt;R26CAG-LSL-tdT mice (i) using CD11b, CD45 and Ly6C/Gr1 as markers. Phenotyping was performed with CD3-CD19-Ly6Glow cells from the telencephalon under control conditions and from the affected brain area after PT or tMCAO. Data in g show Cxcr4-GFP+ percentages for microglia (MG: CD11b+CD45low) and monocytes (MC: CD11b+CD45highLy6Chigh). For all graphs, circles and lines represent individual mice and mean values, respectively. Statistics: a–c, Data are representative for n≥3 mice each; d–f, data represent n=3 mice; g, data represent n=5 (PT) or 4 (tMCAO) mice. h,i, data are representative of n=6 (i, Ctrl), 5 (i, PT), 4 (i, tMCAO), 4 (h, Ctrl), 8 (h, PT), or 6 (h, tMCAO) mice.
Figure 3.
Figure 3.
Gene expression profiles of monocytes in stroke. a, Scatter plot depicting expression levels of individual genes in Cxcr4-GFP microglia (CD11b+CD45low) and Cxcr4-GFP+Ly6Chigh monocytes (CD11b+ CD45high) as determined by RNA-seq. Data represent log10 (mean of normalized RNA counts; n=4 mice) for monocytes/microglia sorted from suspensions of the ipsilateral cortex at day 3 after PT. Genes with fold change |FC|>4 and FDR-adjusted p-value<0.3 are marked in red. Statistical test: one-way ANOVA. Dashed lines separate genes with at least 400 counts in the one or other condition. b, Gene Ontology (GO) term enrichment analysis of DEGs. Bars depict fold enrichment for terms with p-value <0.05. Statistical test: EASE Score (one-tailed) calculated using DAVID Bioinformatics. c, X-ray autoradiograms of in situ hybridized coronal brain sections under control conditions (ctrl) and after stroke. Images are representative for n=2 (ctrl) and n=3 mice per time point after PT or tMCAO. d, Heat-map representation of the indicated genes. Values are displayed as z-scores of normalized counts (n=4 mice). e, Confocal images depicting triple immunofluorescence for Ki67, tdT and Iba1 in the PT-induced lesion of a Cxcr4CreER/wt; R26CAG-LSL-tdT mouse at day 3. Arrows point to Ki67+ tdT Iba1+ cells (microglia), arrow-head identifies a Ki67+ tdT+ Iba1+ monocyte. Graphs show the Ki67+ percentages for tdT Iba1+ cells (microglia) and for tdT+ Iba1+ cells (monocytes) present in the lesion at day 3 after PT and tMCAO. Circles and lines represent individual mice and mean values, respectively (n=6 (PT) or 8 (tMCAO) mice). Scale bars: 1000 μm (c) or 20 μm (e).
Figure 4.
Figure 4.
Monocytes do not persist in the peri-infarct area. a, Iba1 and GFAP immunofluorescence in the infarct boundary zone of Cxcr4CreER/wt; R26CAG-LSL-tdT mice at days 3 and 28 after PT. Iba1 and GFAP are depicted separately for the same section. The segmented line segregates the infarct from the boundary zone. Framed areas represent ROIs 1–3. Asterisks mark the infarct center. b, Confocal images demonstrate tdT+ Iba1+ monocytes and tdT Iba1+ microglia in ROIs 1–3 at post-operative days 3 and 28. Images in (a) and (b) are representative for n=6 mice for both days 3 and 28. c,d, Graphs depicting the density of tdT+ Iba1+ monocytes (c) and tdT Iba1+ microglia (d) in ROIs 1–3 at post-operative days 3, 8 and 28. Circles and lines represent individual mice and mean values, respectively. n=6 (day 3), 4 (day 8) or 6 (day 28) mice. Scale bars: 225 μm (a) or 25 μm (b).
Figure 5.
Figure 5.
Reduced monocyte infiltration and ectopic positioning of MDMs in Cxcr4 cKO mice undergoing PT. Data represent post-operative days 3 (a–d) and 8 (e–j). a, Counterstained Cxcr4-IRES-GFP in Cxcr4 control and Cxcr4-cKO mice. Segmented lines mark the infarct boundary. Insets represent the framed areas. Images are representative for n=6 mice each. b, Quantification of the number of GFP+ Iba1+ monocytes per area of infarct by confocal microscopy (for key see d). c, Flow cytometry analysis of the number of Ly6Chigh monocytes in the ipsilateral cortex (for key see d). d, tdT+ percentage of Iba1+ cells as determined by confocal microscopy in three ROIs; ROIs are illustrated in Fig. 4a. e, Cxcl12 and Cxcr4 transcripts as detected by ISH. Images are representative for n=2 mice each. f, Confocal images of Iba1 and tdT immunofluorescence demonstrate ectopic MDMs (arrowheads) in ROI 3 of cKO mice. DAPI appears white. Image is representative for n=6 mice. g,h, tdT+ percentage of Iba1+ cells as determined by confocal microscopy. Data in h represent control mice receiving intra-infarct injection of saline or Cxcr4 antagonist AMD3100 6 h before analysis. i,j, Confocal images of tdT, Iba1, and Cybb, tdT, Iba1 and P2ry12, and tdT, Iba1 and Tmem119 immunofluorescence in the structurally intact peri-infarct area of cKO mice. Arrows identify a Cybb+ (i), a P2ry12+ (j), and a Tmem119+ (j) in MDM. Images are representative for n=6 mice each. For graphs in c,d,g and h, data were normalized to control mean. The center line represent the median, the box limits the 25th to 75th percentiles, and the whiskers the minimum to maximum values. Statistics: b, **p=0.002 (n=6 mice each); c, *p=0.027 (n=8 (Ctrl) or 9 (cKO) mice); d, **p=0.007 (ROI 1), *p=0.041 (ROI 2) (n=6 mice each); g, **p=0.0095 (ROI 2), **p=0.0095 (ROI 3) (ctrl, n=4 (Ctrl) or 6 (cKO) mice); h, **p=0.002 (ROI 2), **p=0.002 (ROI 2) (n=6 mice each); Two-sided Mann-Whitney U test. Scale bars: 250 μm (a), 500 μm (e), 20 μm (f), or 25 μm (i,j).
Figure 6.
Figure 6.
Cxcr4-deficiency affects the microglia response after PT. tdT Iba1+ microglia were examined in the indicated ROI in Cxcr4 control and Cxcr4 cKO mice at days 3, 8 and 28 after PT using confocal microscopy. In (e), (f) and (i) day 0 represents the non-stroke condition. ROIs are illustrated in Fig. 4a. a–d, Microglia density and Ki67+ percentage of microglia in the infarct. e–h, Ramification index and number of branches of 3D-reconstructed microglia in the peri-infarct region (ROI 3). Data in g and h represent control mice receiving intra-infarct application of saline or Cxcr4 antagonist AMD3100 6 h before analysis. i, Images of 3D-reconstructed microglia at day 0 and in ROI 3 at day 8. For the graphs in a–d, data were normalized to control mean. For a–h, the center line represent the median; box limits the 25th to 75th percentiles, and whiskers the minimum to maximum values. Statistics for a–d, g and h: a, *p=0.033 (n=6 mice each); b, **p=0.004 (n=6 (Ctrl) or 5 (cKO) mice); c, **p=0.0095 (n=4 (Ctrl) or 6 (cKO) mice); d, p=0.63 (n=6 (Ctrl) or 4 (cKO) mice); g,h, ***p=0.0006 (g), p=0.95 (h) (n=32 (sham) or 26 (AMD3100) cells from 6 mice each). Two-sided Mann-Whitney U test. Statistics for e and f, p<0.0001 (e) and p=0.01 (f) for genotype-time interaction, two-way ANOVA (n=9 (day 0 Ctrl, day 3 cKO, day 8 Ctrl, day 28 Ctrl), 5 (day 0 cKO), 11 (day 3 Ctrl), 48 (day 8 cKO) or 6 (day 28 cKO) cells from n=4 mice each). ***p<0.001, **p=0.006 (e), **p=0.006 (f), Sidak’s post-test, p-values are also provided in the Nature Reporting Summary.
Figure 7.
Figure 7.
Functional changes of infiltrated monocytes due to Cxcr4-deficiency. a–e, RNA-seq analysis for tdT+ monocytes (CD11b+CD45highLy6Chigh) and tdT microglia (CD11b+ CD45low) sorted from brains of Cxcr4 cKO and Cxcr4 control mice at day 3 after PT (n=3 mice each) and tMCAO (n=5 (Ctrl) or 4 (cKO) mice). tdT MC were sorted and analyzed along with tdT+ monocyte and microglia for all tMCAO samples. a, PCA based on top 5000 most variable genes. b, Genes were clustered into expression modules based on their expression behavior in the experimental groups using CENA. Heatmaps display mean group-fold change (GFC) of gene expression. The number of assigned genes is shown in parenthesis. c, GO terms for Turquoise modules. d, Heatmap representation of selected genes present in both Turquoise modules shown for tMCAO. e, GO term enrichment analysis for DEGs (fold change 1.5; FDR p-value<0.05). Statistical test: GO terms in c, and e were selected from the top 10 after sorting by adjusted p-value (p-adjust<0.05, one-tail hypergeometric test with Benjamini-Hochberg correction).
Figure 8.
Figure 8.
Cxcr4-deficiency leads to deteriorated outcomes after tMCAO. tMCAO was induced in Cxcr4 control and Cxcr4 cKO mice. a, Neurological deficit in arbitrary units (AU). b, Infarct volume. c,d, Density of tdT+Iba1+ monocytes in the peri-infarct region in the olfactory tubercle at day 1 (c) and in the infarct at day 2 (d). e, Flow cytometry analysis of the number of Ly6Chigh monocytes in the forebrain at day 3 expressed as percent of control mean. f, NeuN, Iba1 and tdT immunofluorescence of control mice (Ctrl, upper two panels) and Cxcr4 cKO (cKO, lower two panels) demonstrate reduced infiltration of tdT+Iba1+ monocytes (arrowheads) in the NeuN infarct of Cxcr4 cKO mice at day 3. The upper rows demonstrate the infarct of Ctrl and cKO mice at low magnification, the lower rows are high magnification views. The segmented line delineates the boundary of the infarcted caudate putamen. Images are representative for n=11 mice (ctrl) or 10 (cKO) mice. Scale bars, 500 μm (upper rows) or 30 μm (lower rows). For graphs in a–e, squares and red lines represent individual mice and mean values, respectively. Statistics (two-sided Mann-Whitney U-test): a, day 2: *p=0.034 (n=13 mice each), day 3: *p=0.021 (n=20 (Ctrl) or 19 (cKO) mice); b, **p=0.009 (ctrl versus cKO), **p=0.001 (cKO day 2 versus cKO day 3); c, **p=0.004 (n=6 mice each); d, **p=0.005 (n=14 (Ctrl) or 13 (cKO) mice); e, **p=0.008 (n=5 mice each).

References

    1. Alliot F, Godin I & Pessac B Microglia derive from progenitors, originating from the yolk sac, and which proliferate in the brain. Brain Res Dev Brain Res 117, 145–152 (1999). - PubMed
    1. Ginhoux F, et al. Fate mapping analysis reveals that adult microglia derive from primitive macrophages. Science 330, 841–845 (2010). - PMC - PubMed
    1. Gomez Perdiguero E, et al. Tissue-resident macrophages originate from yolk-sac-derived erythro-myeloid progenitors. Nature 518, 547–551 (2015). - PMC - PubMed
    1. Schulz C, et al. A lineage of myeloid cells independent of Myb and hematopoietic stem cells. Science 336, 86–90 (2012). - PubMed
    1. Greter M, Lelios I & Croxford AL Microglia Versus Myeloid Cell Nomenclature during Brain Inflammation. Front Immunol 6, 249 (2015). - PMC - PubMed

Publication types

MeSH terms