. 2020 Mar;17(3):319-327.
doi: 10.1038/s41592-019-0730-2. Epub 2020 Feb 10.

Long-range single-molecule mapping of chromatin accessibility in eukaryotes

Affiliations

Long-range single-molecule mapping of chromatin accessibility in eukaryotes

Zohar Shipony et al. Nat Methods. 2020 Mar.

Abstract

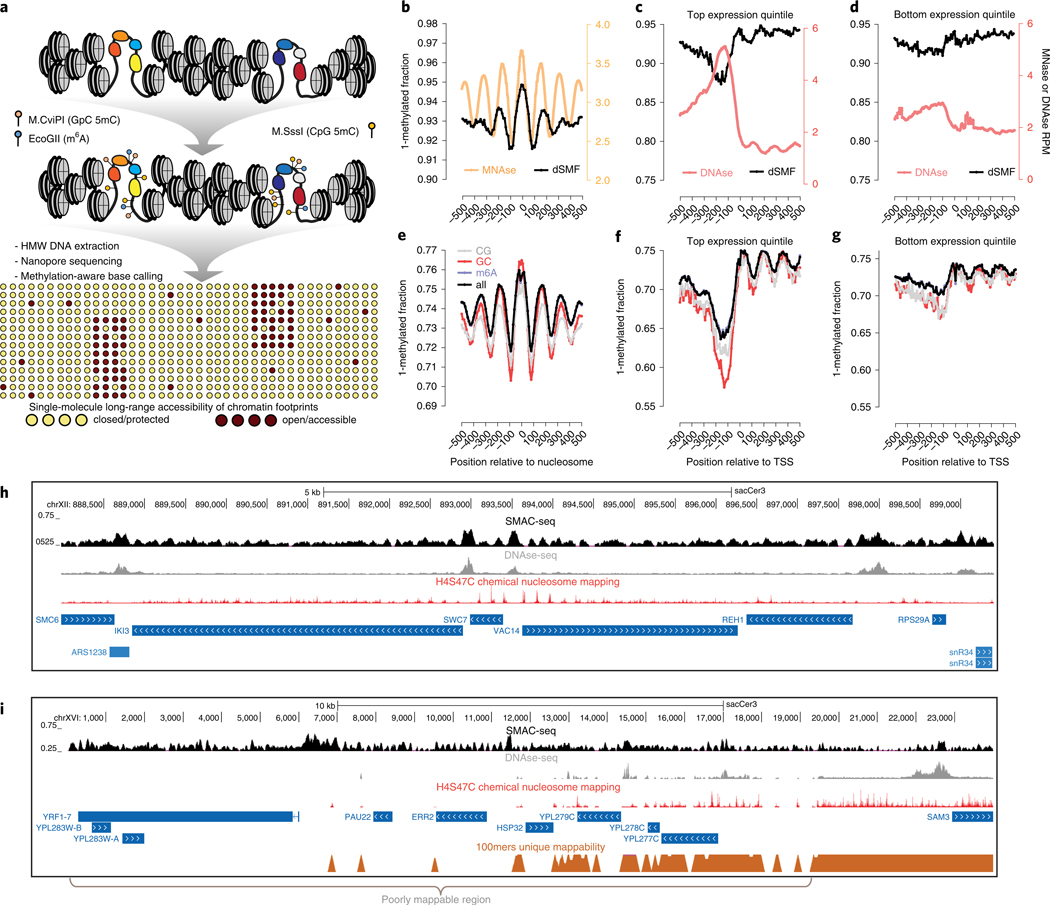
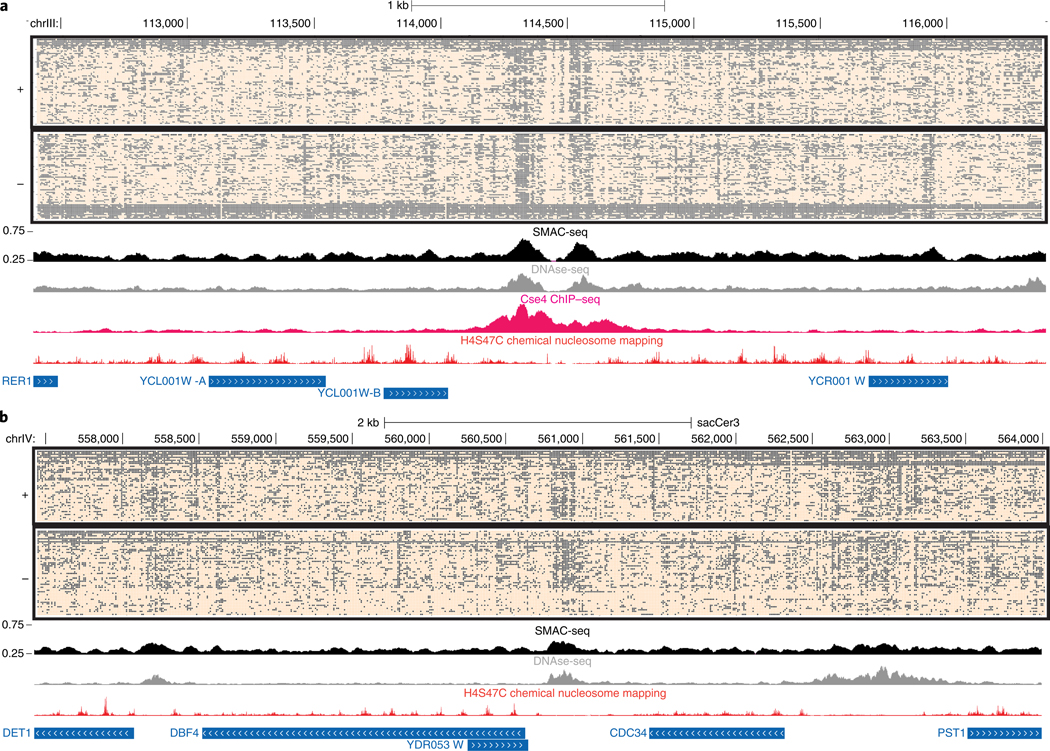
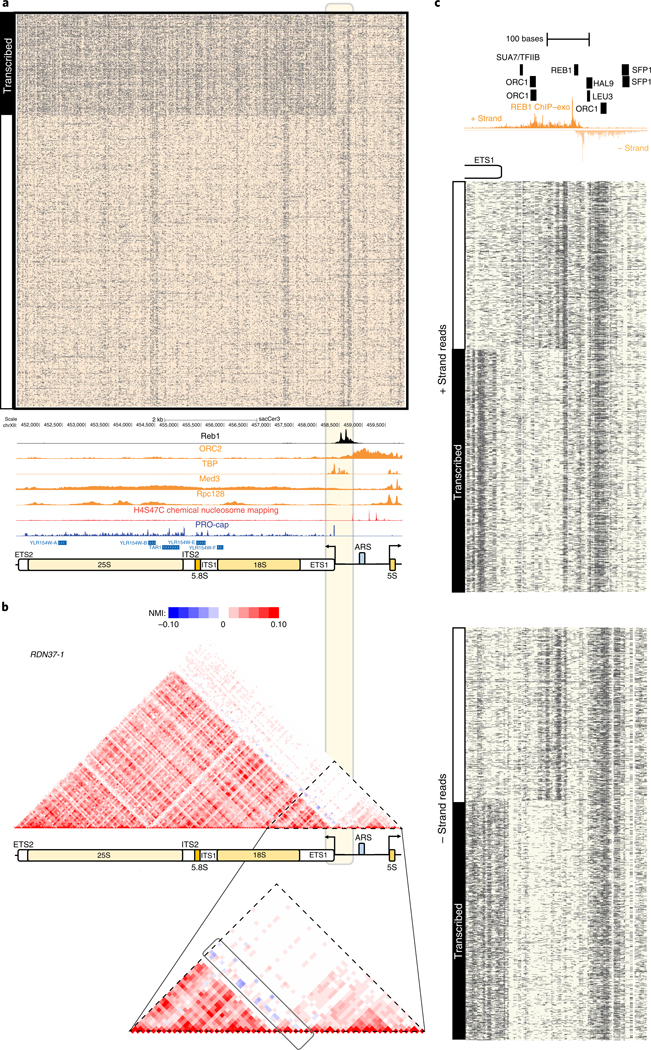
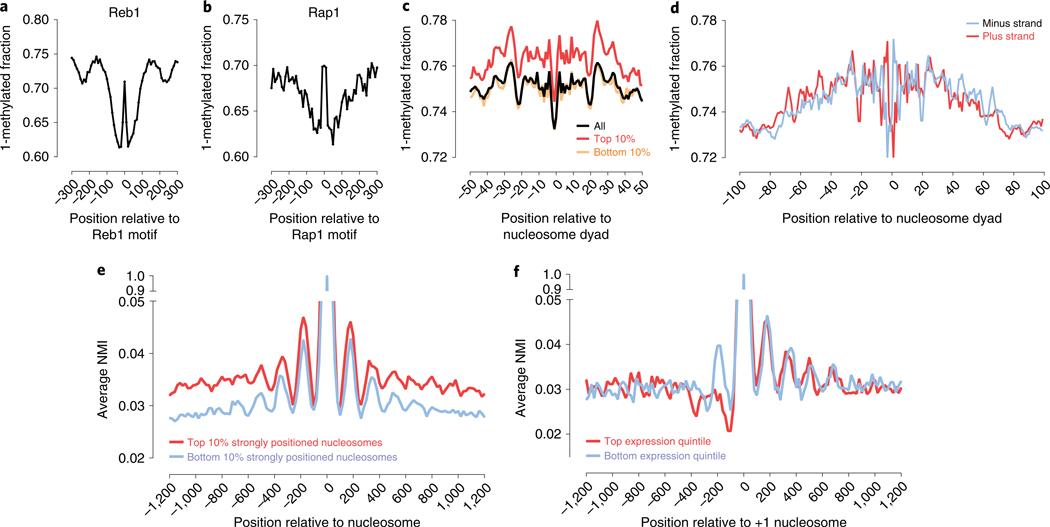
Mapping open chromatin regions has emerged as a widely used tool for identifying active regulatory elements in eukaryotes. However, existing approaches, limited by reliance on DNA fragmentation and short-read sequencing, cannot provide information about large-scale chromatin states or reveal coordination between the states of distal regulatory elements. We have developed a method for profiling the accessibility of individual chromatin fibers, a single-molecule long-read accessible chromatin mapping sequencing assay (SMAC-seq), enabling the simultaneous, high-resolution, single-molecule assessment of chromatin states at multikilobase length scales. Our strategy is based on combining the preferential methylation of open chromatin regions by DNA methyltransferases with low sequence specificity, in this case EcoGII, an N6-methyladenosine (m6A) methyltransferase, and the ability of nanopore sequencing to directly read DNA modifications. We demonstrate that aggregate SMAC-seq signals match bulk-level accessibility measurements, observe single-molecule nucleosome and transcription factor protection footprints, and quantify the correlation between chromatin states of distal genomic elements.


Figures

Fig. 1 |
Fig. 1 |. The SMAC-seq assay for profiling chromatin accessibility and nucleosome positioning at the multikilobase scale.
a, Outline of the SMAC-seq assay. Intact chromatin is treated with m6A and CpG and GpC 5mC methyltransferases, which preferentially methylate DNA bases in open chromatin regions. High molecular weight (HMW) DNA is then isolated and subjected to nanopore sequencing, and methylated bases are used to reconstruct the open chromatin state within individual molecules. b-h, SMAC-seq faithfully captures chromatin accessibility around promoters and positioned nucleosomes in S. cerevisiae. b, MNAse-seq and dSMF profiles around chemically mapped positioned nucleosome dyads. c, DNAse-seq and dSMF profiles around the top 20% highly expressed genes in S. cerevisiae. d, DNAse-seq and dSMF profiles around the bottom 20% expressed genes in S. cerevisiae. RPM, reads per million (c,d). e, Average SMAC-seq profile around chemically mapped positioned nucleosomes dyads (shown is the ‘diamide 0 min rep2’ sample). f, Average SMAC-seq profile around the top 20% highly expressed genes in S. cerevisiae. g, Average SMAC-seq profile around the bottom 20% expressed genes in S. cerevisiae. TSS, transcription start site (f,g). h, SMAC-seq correlates closely with both DNAse-seq and nucleosome occupancy profiling at the level of individual loci and provides a combined readout of accessibility and nucleosome positioning. Shown is the aggregate SMAC-seq signal along the genome (aggregated over 50-bp windows sliding every 5 bp; see Methods for details), together with DNAse-seq, nucleosome chemical mapping data and transcriptional activity (measured by PRO-seq and PRO-cap). Large aggregate SMAC-seq signal enrichments match closely with DNAse accessibility peaks, while smaller aggregate SMAC-seq peaks are inversely correlated with positioned nucleosomes. i, SMAC-seq profiles chromatin accessibility in repetitive regions of the genome that are ‘invisible’ to short reads. The telomeric region of chrXVI is shown.
Fig. 2 |
Fig. 2 |. SMAC-seq provides a single-molecule linked-read view of the chromatin landscape.
a, Unfiltered nanopore reads fully spanning the 4-kb neighborhood of the centromere of S. cerevisiae chrlll (aggregate signal from Sample 1). b, Unfiltered nanopore reads fully spanning a 6.6-kb neighborhood encompassing several genes on chrlV (aggregate signal from Sample 1). In both cases, accessibility is shown at 10-bp resolution (see Methods section for details) for the single-molecule display, and aggregated over sliding (every five bases) 50-bp windows for the average SMAC-seq track.
Fig. 3 |
Fig. 3 |. SMAC-seq’s single-molecule readout provides insights into the distribution and relationship between mutually exclusive chromatin yeast rDNA states.
a, SMAC-seq reveals the distribution of alternative chromatin states of rDNA arrays. Shown are all reads covering the RDN37–1 array in the RDN1 locus in the ‘diamide 30 min repV experiment (unfiltered reads, aggregate signal). See Supplementary Figs. 37–40 for additional details. ChlP-seq and ChIP-exo tracks were generated by including and normalizing all multimappers rather than the usual unique-only policy (see the Methods section for more details). The light-yellow box highlights the 35S TSS region, which contains the element anticorrelated with the transcribed state of the rDNA array. b, NMI profiles for the RDN37–1 array show anticorrelation between the accessibility peaks immediately upstream of the 35S TSS and the nucleosome-free state over the 35S transcriptional unit. Top panel shows the whole locus, bottom panel zooms in on the vicinity of the 35S TSS. c, High-resolution SMAC-seq profiles reveal regulatory protein footprints in the immediate vicinity of the 35S TSS and the Reb1 binding site in the rDNA NTS region (shown are 3,000 randomly sampled reads using 10-bp aggregate SMAC-seq signal at 1-bp resolution).
Fig. 4 |
Fig. 4 |. SMAC-seq provides a high-resolution strand-specific view of genomic occupancy by DNA-binding proteins and complexes.
a,b, SMAC-seq allows for footprinting of transcription factor binding events. Shown is aggregate genome-wide SMAC-seq signal around occupied (as measured by ChIP-exo) Reb1 (a), and Rap1 (b) sequence recognition motifs. c, SMAC-seq profiles around positioned nucleosome dyads reveal increased accessibility in the dyad and increased protection at the points of contact with the nucleosome (see Supplementary Fig. 23 for additional details). d, SMAC-seq provides a strand-specific view of nucleosome occupancy and reveals differential accessibility between the two DNA strands depending on their position on the nucleosomal particle. e,f, Coordination between the positions of individual nucleosomes at the level of single chromatin fibers. e, The average NMI between each strongly or poorly positioned nucleosome in the yeast genome and its immediate genomic neighborhood (measured for windows of 10 bp length tiling at every genomic position centered on the nucleosome dyad). f, The average NMI between each +1 nucleosome and its immediate genomic neighborhood in highly expressed and in mostly silent genes (measured for windows of 10-bp length tiling at every genomic position centered on the +1 nucleosome dyad).
Fig. 5 |
Fig. 5 |. Coordinated changes in chromatin accessibility and nucleosomal occupancy during the yeast stress response.
a, Experimental outline. Yeast cells were treated with diamide, then SMAC-seq and other functional genomic assays were carried out at 15- or 30-min intervals. b, Sites occupied by the HSF1 transcription factor upon its activation by the stress response pathway exhibit strong footprints in SMAC-seq data. c, Changes in the expression of the TMA10 gene on diamide treatment (FPKM, fragments per kilobase per million). d, Changes in RNA polymerase and HSF1 occupancy (measured by ChIP-seq), and of chromatin accessibility at the single-molecule level in the vicinity of the TMA10 gene during the diamide time course. e, Changes in RNA polymerase and HSF1 occupancy (measured by ChIP-seq), and of chromatin accessibility at the single-molecule level in the vicinity of the HSP26 gene during the diamide time course. f, Decrease in the fraction of transcribed rDNA arrays as a result of cellular response to diamide treatment. Shown is SMAC-seq signal around the 35S rDNA TSS region, as also shown in Fig. 3c.

References

    1. Wu C The 5′ ends of Drosophila heat shock genes in chromatin are hypersensitive to DNase I. Nature 286, 854–860 (1980). - PubMed
    1. Keene MA, Corces V, Lowenhaupt K & Elgin SC DNase I hypersensitive sites in Drosophila chromatin occur at the 5′ ends of regions of transcription. Proc. Natl Acad. Sci. USA 78, 143–146 (1981). - PMC - PubMed
    1. McGhee JD, Wood WI, Dolan M, Engel JD & Felsenfeld GA 200 base pair region at the 5′ end of the chicken adult β-globin gene is accessible to nuclease digestion. Cell 27, 45–55 (1981). - PubMed
    1. Dorschner MO et al. High-throughput localization of functional elements by quantitative chromatin profiling. Nat. Methods 1, 219–225 (2004). - PubMed
    1. Sabo PJ et al. Genome-scale mapping of DNase I sensitivity in vivo using tiling DNA microarrays. Nat. Methods 3, 511–518 (2006). - PubMed

Publication types