. 2020 Feb;26(2):259-269.
doi: 10.1038/s41591-019-0750-6. Epub 2020 Feb 10.

Regenerative lineages and immune-mediated pruning in lung cancer metastasis

Affiliations

Regenerative lineages and immune-mediated pruning in lung cancer metastasis

Ashley M Laughney et al. Nat Med. 2020 Feb.

Abstract

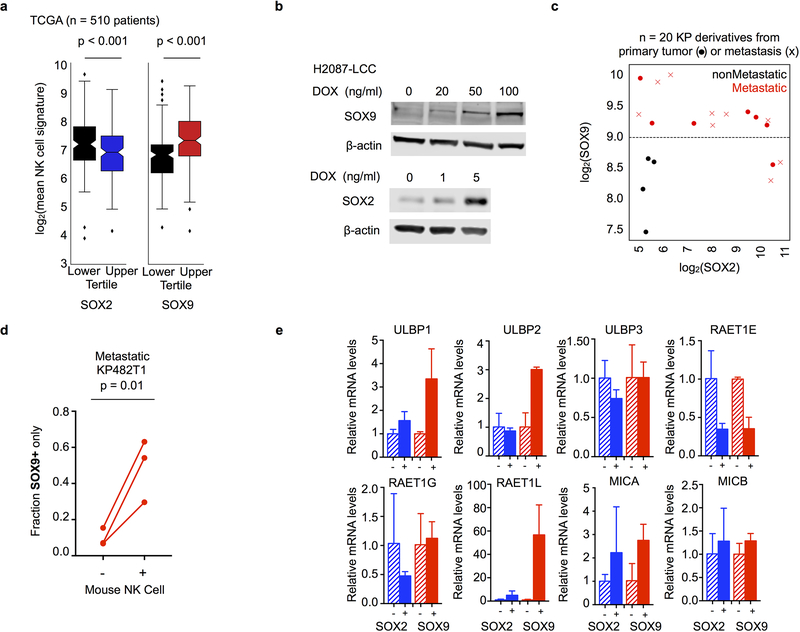
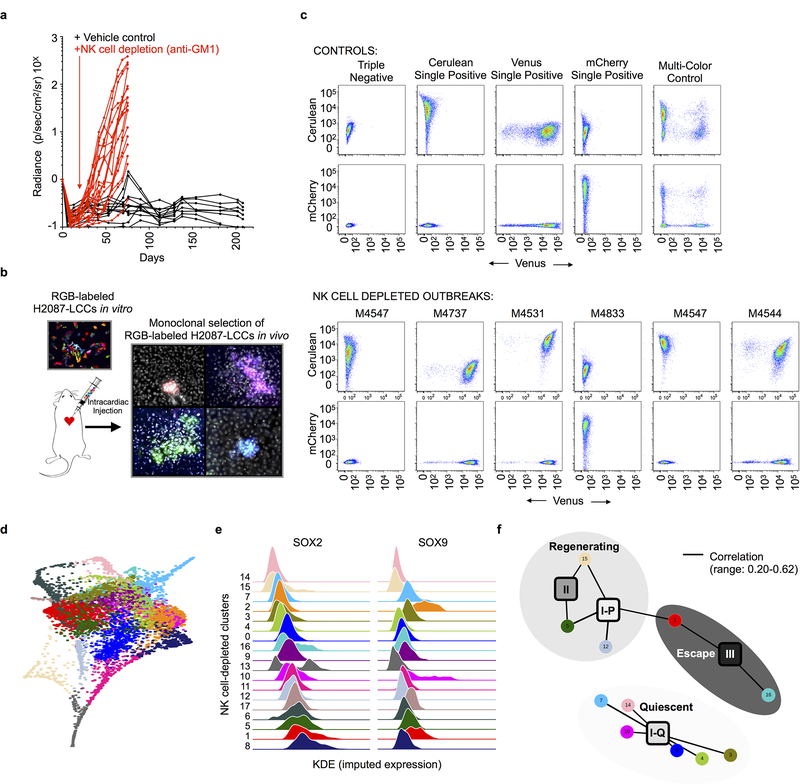
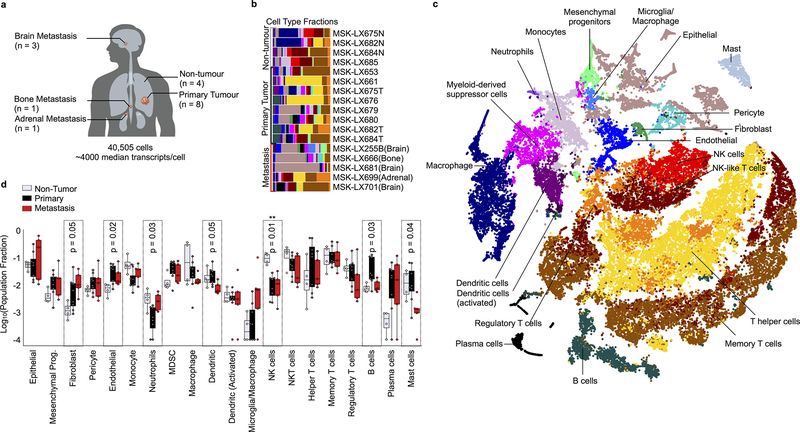
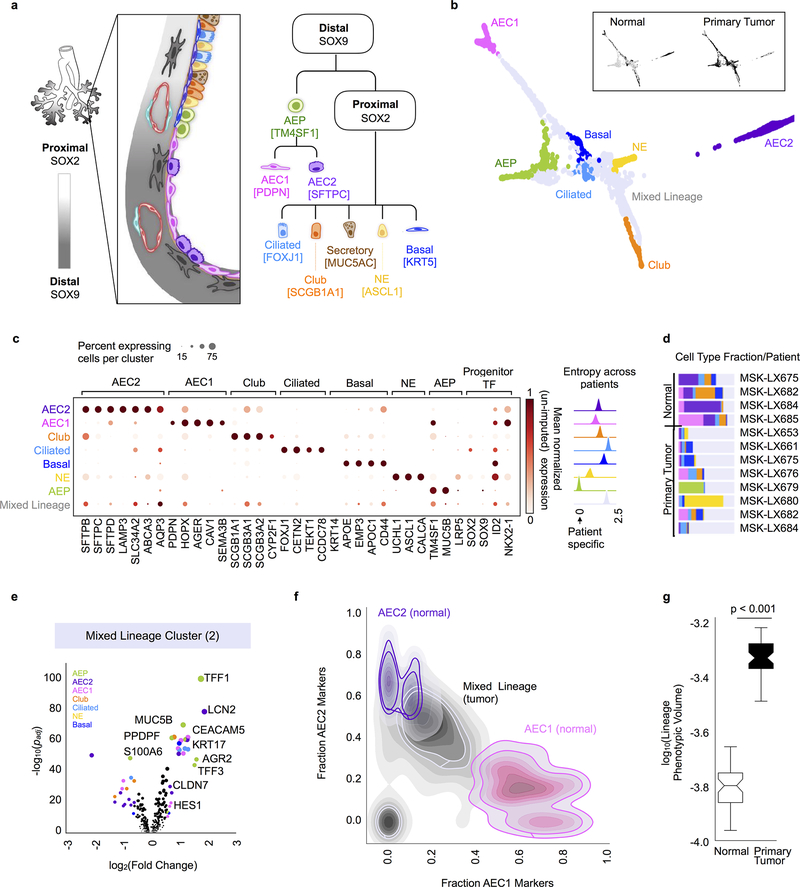
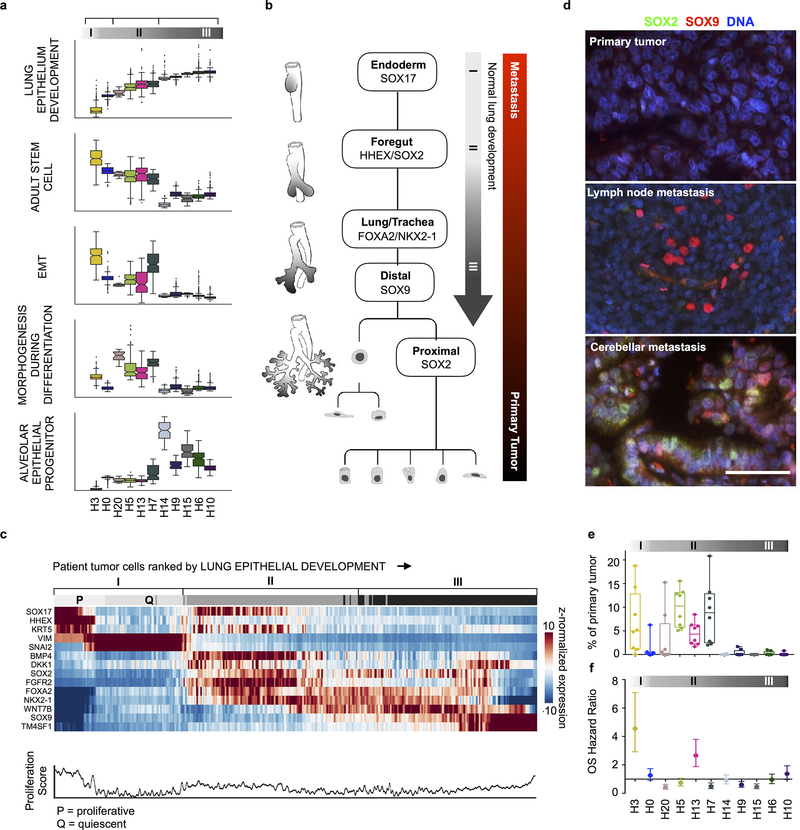
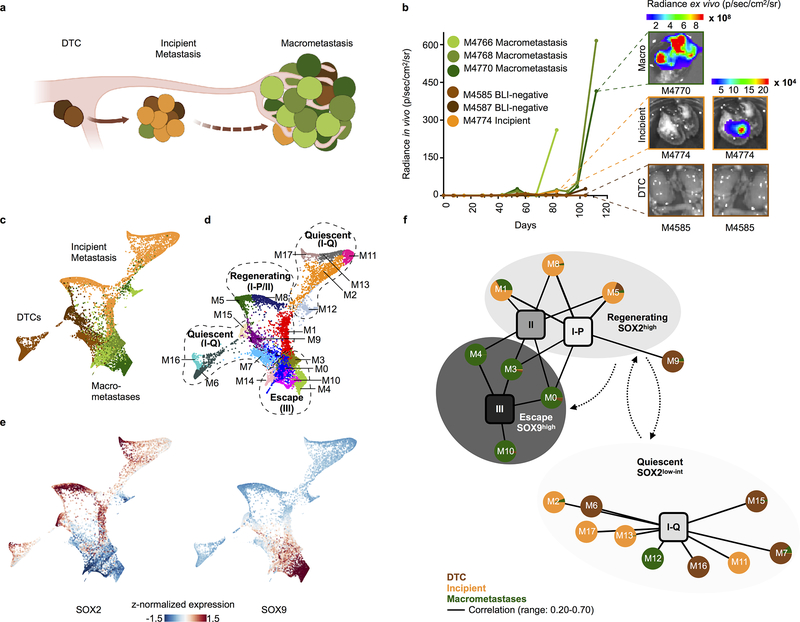
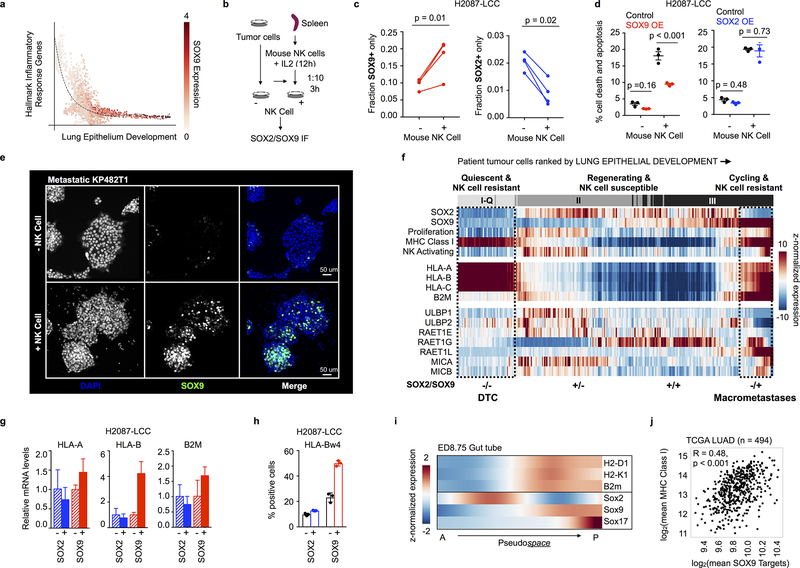
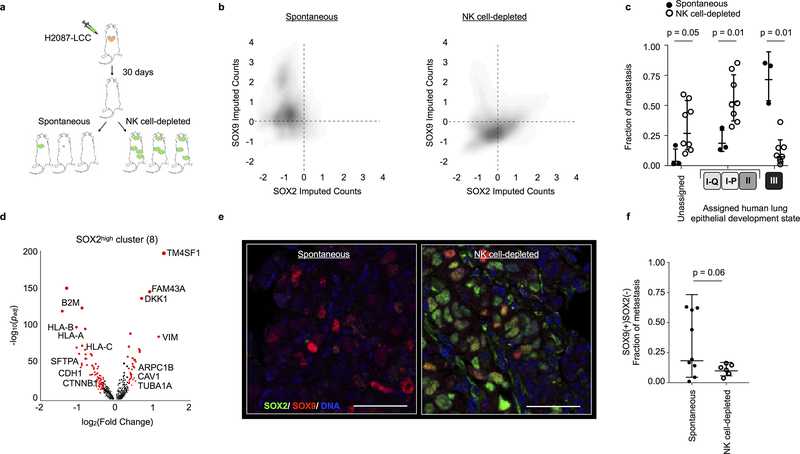
Developmental processes underlying normal tissue regeneration have been implicated in cancer, but the degree of their enactment during tumor progression and under the selective pressures of immune surveillance, remain unknown. Here we show that human primary lung adenocarcinomas are characterized by the emergence of regenerative cell types, typically seen in response to lung injury, and by striking infidelity among transcription factors specifying most alveolar and bronchial epithelial lineages. In contrast, metastases are enriched for key endoderm and lung-specifying transcription factors, SOX2 and SOX9, and recapitulate more primitive transcriptional programs spanning stem-like to regenerative pulmonary epithelial progenitor states. This developmental continuum mirrors the progressive stages of spontaneous outbreak from metastatic dormancy in a mouse model and exhibits SOX9-dependent resistance to natural killer cells. Loss of developmental stage-specific constraint in macrometastases triggered by natural killer cell depletion suggests a dynamic interplay between developmental plasticity and immune-mediated pruning during metastasis.


Conflict of interest statement

Competing Interests

J.M. is a scientific advisor and owns company stock in Scholar Rock. C.M.R. has consulted with AbbVie, Amgen, Ascentage, Astra Zeneca, BMS, Celgene, Daiichi Sankyo, Genentech/Roche, Ipsen, Loxo, and Pharmar, and is on the scientific advisory boards of Elucida and Harpoon. S.F.B. owns equity in, receives compensation from, and serves as a consultant, board member, and a scientific advisory board member for Volastra Therapeutics Inc. He also has consulted for Sanofi. All other authors declare no competing conflicts.

Figures

Extended Data Fig. 1:
Extended Data Fig. 1:. Patient attributes.
Patient resection site, smoking history, primary lesion size, disease stage, diagnostic pathology, oncogenic mutations and treatment history.
Extended Data Fig. 2:
Extended Data Fig. 2:. Single cell parameters and pre-processing.
Cells were filtered based on (a) cumulative number of transcript counts, (b) cell complexity and (c) fraction of mitochondrial mRNA content detected per cell as described in the Methods; shown here for one representative library. Excluded cells are labeled in red. Histograms showing the distribution of (d) total number of transcripts detected per cell and (e) number of unique genes detected per cell in retained cells colored by sample. f-h, t-SNE projection of the complete atlas of normal lung, primary tumor and metastatic LUAD (same projection as Figure 1c, n = 40,505 cells), cells colored by (f) sample and (g) meta-cell class as determined by (h) unsupervised clustering of canonical gene signatures within each meta-cell class across all cells. Clustering of canonical cell type expression signatures (annotated in Supplementary Table 2), z-score normalized per gene across cells. Assignment to meta-cell classes (detailed in Methods) are colored on the dendrogram.
Extended Data Fig. 3:
Extended Data Fig. 3:. Phenotyping myeloid, epithelial and stromal cell types.
a, t-SNE projection of myeloid, epithelial and stromal cells (purple and tan populations from Extended Data Fig. 2g, n = 9,195 cells) colored and labeled by their Phenograph cluster assignment (Phenograph run on subset as detailed in Methods). b, Heatmap of gene signatures differentially expressed by Phenograph clusters with abs(NES) > 2 and padj < 0.05, clustered (rows and columns) according to the cosine distance metric for visualization; hits not meeting these criteria are whited out. Numbered by Phenograph clusters (top) and colored by inferred cell type assignments (bottom, see Methods). NES, normalized enrichment score; padj, Bonferroni corrected, two-sided p-value. c, Pearson correlations between Phenograph cluster centroids and bulk mRNA profiles from purified immune subpopulations, (n = 5,987 genes, Methods). Correlation coefficients are whited out if p > 0.01 for the Pearson test for non-correlation. d, t-SNE projection of all myeloid/epithelial/stromal cells (same as a) colored and labeled by inferred cell types. Phenograph clusters were mapped to cell types using (b-c) and are directly mapped back to the complete patient dataset in (Fig. 1c) using the same color scheme. e, Clustered heatmap of the average imputed expression per cell type of distinguishing markers, standardized by z-score. Rows are colored by annotated cell type.
Extended Data Fig. 4:
Extended Data Fig. 4:. Phenotyping NK, T and B cells in the lymphoid compartment.
a, t-SNE projection of all lymphoid cells (blue cells from Extended Data Fig. 2g, n = 25,726 cells) colored by Phenograph cluster. b, Pearson correlations between Phenograph cluster expression centroids and bulk mRNA data published from purified immune subpopulations, computed based on intersecting, variably expressed genes (n = 5,613, Methods). Rows are colored and labeled by Phenograph clusters. Correlation coefficients are whited out if p > 0.01 for the Pearson test for non-correlation. c, Clustered heatmap of the average imputed expression per Phenograph cluster of canonical lymphoid markers, standardized by z-scores. Rows are colored by Phenograph clusters (left) and annotated cell types (right, see Methods). d, t-SNE projection of all lymphoid cells (same as a) colored and labeled by inferred cell types. Phenograph clusters were mapped to cell types using (b-c) and are directly mapped back to the complete patient dataset in (Fig. 1c) using the same color scheme. e, The cell distribution of NKG7 imputed expression, a canonical NK cell marker, across all annotated lymphoid cell types. f, Dot plots showing relative frequency of expressing cells and mean normalized expression (un-imputed data) of canonical markers per lymphoid cell type.
Extended Data Fig. 5:
Extended Data Fig. 5:. Reproducibility of cell types across patients.
a, Clustered heatmap of imputed average of key cell type markers, for all cell types annotated in the complete patient dataset (Fig. 1c) and standardized by z-scores. Rows are colored by cell type annotation, number of patients in which the cell type was detected, and the total number of cells assigned to this cell type (left to right on left side of clustered heatmap). b, Kernel density plot depicting entropy of the patient distribution as a measure of sample mixing across all patients within each cell type; computed with bootstrapping to correct for number of cells in each cluster (n = 100 random subsamples) as described in Methods. High entropy indicates most similar cells come from a well-mixed set of patient samples, whereas low entropy indicates most similar cells come from the same patient sample. Distributions are colored by annotated cell types. c, Estimates of tumor purity measured by scRNA-seq and targeted panel DNA sequencing of matched bulk tumor using FACETS, an allele-specific copy number analysis tool. We test effectiveness of pairing between tumor purity estimates by reporting the Pearson correlation coefficient for n = 7 samples for which matched scRNA-seq and bulk, targeted panel DNA sequencing was available with one-sided P value testing for non-correlation. d, t-SNE projection of individual patient tumors from n = 5 representative patient samples; annotated number of cells per patient. scRNA-seq data for each tumor was processed independently as described in the Methods; each dot represents a cell colored by Phenograph clusters, labeled by inferred cell types. e, Number of patients in which each cell type was detected for individual patient analyses. This is concordant with patient frequencies observed in the pooled analysis, summarized in a. Power to detect minority cell types like neutrophils and plasma cells is reduced when analyzing patient samples one-by-one.
Extended Data Fig. 6:
Extended Data Fig. 6:. Epithelial cell types detected in the normal, adult human lung.
a, Force-directed layout of epithelial cells detected in the normal lung colored by Phenograph cluster and labeled with annotated cell type (n = 658 cells; Methods and below). b, Bar graphs representing the fraction of each cell type detected per patient. c, Clustered heatmap of the top 60 DEGs per cell type; imputed values standardized by z-scores are shown for visualization. DEGs were identified in un-imputed data using MAST as described in the Methods. Rows are colored by Phenograph cluster and labeled by annotated cell type. d, A clustered heatmap of differentially expressed gene signatures within each cell type. NES is shown for pathways in which abs(NES) > 2.5 and padj < 0.05; signatures not meeting this criterium are whited out. Columns are colored by Phenograph cluster. NES, normalized enrichment score; padj, Bonferroni corrected, two-sided p-value. Complete GSEA results per Phenograph Cluster, including nominal p-values, are provided in Supplementary Table 5. e, Histograms showing the fraction of cells per Phenograph cluster (i.e. cell loadings) expressing at or above the 75th percentile a fraction of each cell-type specific gene signature (AEC1, AEC2, Club and Ciliated) computed on imputed data; each distribution represents cells from one Phenograph cluster. Colors associated with each annotated epithelial cell lineage are maintained as in Fig. 2.
Extended Data Fig. 7:
Extended Data Fig. 7:. The relationship between primary tumor and normal lung epithelial cell types.
a, Top DEGs per Phenograph Clusters annotated in Fig. 2b, compared to all other cells, computed using MAST. Each lineage-specific gene is colored by associated cell type, with diameter proportional to −log10(padj). See Supplementary Table 1 for lineage-specific genes. b, Clustered heatmap of gene signatures differentially enriched (abs(NES) > 2 and padj < 0.05) in one or more Phenograph Clusters. NES, Normalized Enrichment Score. Column colors (top) correspond to annotated epithelial lineages. Signatures not meeting these criteria are whited out. See Supplementary Table 8 for complete GSEA results per Phenograph Cluster. c, Violin plots showing imputed expression of canonical lineage-specific transcription factors (columns) for each annotated epithelial cell lineage (color), scaled such that each plot has the same width; lines distinguish data quartiles. d, Force-directed layout of all epithelia (n = 2,140 cells) colored by extrema of the three most informative diffusion components (DCs, above) and by DC2 (below); GSEA of cells ranked along DC2 are positively enriched for embryonic stem cell gene signatures and pathways associated with proximal cell types, and negatively associated distal cell types. Complete GSEA results are provided in Supplementary Table 8. e, Fraction of normal- and primary tumor- derived cells comprising the union of all three DC extrema (center values, mean; error bars, 95% confidence interval; points, fraction of cells measured at n = 3 diffusion extrema). f, Fraction of each annotated cell type detected per diffusion component extrema and in non-extrema. g, Cumulative imputed expression of a bulk-derived gene signature up-regulated in LUAD and not expressed in non-cancerous epithelium evaluated per cell in normal vs. tumor-derived epithelium (center line, median; box limits, upper and lower quartiles; whiskers, 1.5x interquartile range; points, n = 2,140 individual cells); two-sided p < 0.001, Mann Whitney U test.
Extended Data Fig. 8:
Extended Data Fig. 8:. Identification of transcriptionally distinct metastatic subpopulations.
All data in this figure relates to the combined normal, primary tumor and metastatic epithelium. a, Clustered heatmap showing gene signatures differentially expressed across Phenograph clusters. Normalized enrichment score (NES) is colored for gene signatures in which abs(NES) > 1.5 and two-sided padj < 0.05. padj, Bonferroni corrected, two-sided p-value. Rows correspond to gene signatures, column corresponds to Phenograph clusters. See Supplementary Table 10 for complete GSEA results per cluster. Fraction of each Phenograph cluster derived per tissue source is visualized above each column. White stars (bottom) denote patient metastatic clusters based on fraction of metastatic cells (>10%). (b) Tissue source, clusters (matching those depicted in a), and cell types (annotated as in Fig. 2), are visualized on a force directed layout (n = 3,786 cells). c, SOX2, SOX9 and DAPI immunofluorescence in three additional patient-matched primary tumor-metastasis pairs. Scale bars, 100 μm. d, Fraction of each Phenograph cluster detected per metastasis sample (center line, median; box limits, upper and lower quartiles; whiskers, 1.5x interquartile range; points, fraction detected per n = 5 metastatic samples). e, Entropy of patient distribution in each cluster, computed with bootstrapping to correct for number of cells per cluster (center line, median; box limits, upper and lower quartiles; whiskers, 1.5x interquartile range, n = 100 random subsamples of data). Metastatic clusters are shaded by Phenograph cluster ID and clusters are ordered by average entropy. Metastatic clusters associated with alveolar epithelial progenitor signature (type III), and two clusters comprised predominantly of primary tumor cells treated with neo-adjuvant therapy are patient-specific. f, Left, Patient metastatic clusters ranked according to average lung epithelial development GO signature expression (n = 34 genes) less one gene. Each row shows metastatic cluster ranking for each left-out gene. Right, kernel density plot of imputed and normalized expression of each left-out gene.
Extended Data Fig. 9:
Extended Data Fig. 9:. Developmental stage-specific differential immune sensitivity extended.
a, Boxplots showing the average expression of NK cell-specific genes in TCGA lung adenocarcinoma patients stratified by SOX2 or SOX9 expression. NK cells are more abundant in SOX9high tumors and conversely, less abundant in SOX2high tumors (two-sided p < 0.001 based on Mann Whitney U test). Center line represents median; box limits, upper and lower quartiles; whiskers, 1.5x interquartile range; points, outliers. b, Cropped Western blots showing SOX2 and SOX9 protein levels upon DOX induction in the H2087-LCC model; no independent repeats were performed. Un-cropped Western blots are provided in Source Data. c, mRNA expression of Sox2 and Sox9 in bulk KP mouse LUAD derivatives, from primary tumors (circles) or metastases (x); red indicates the derivative is metatstatic. d, Endogenous expression of nuclear SOX9 enumerated by quantitative immunofluorescence in KP482T1 metastatic cells before and after co-culture with IL2-activated mouse NK cells. Fraction of SOX9 positive cells before and after NK cell co-culture are reported. Average of n = 3 technical replicates for each of 3 biological replicates. Between 5 and 9 locations were imaged and quantified per biological and technical replicate; resulting in quantitation of 4,534 cells before NK cell co-culture and 2,556 individual cells after NK cell co-culture. P-values from paired two-tailed t-tests (n = 3 biological replicates, degrees of freedom = 2, t = 8.33, p = 0.01 for SOX9 single positive comparison). e, Relative mRNA expression of NK activating ligands in H2087-LCC cells with and without induction of SOX2 or SOX9 (n = 3 technical replicates; center values, mean; error bars, 95% confidence interval).
Extended Data Fig. 10:
Extended Data Fig. 10:. Clonality and phenotypic landscape of NK cell-depleted macrometastases.
a, Integrated radiance of H2087-LCC cells intracardially injected in mice, +/− anti-GM1 antibody treatment to deplete NK cells measured over time. b, Schematic illustrating trichromatic marking system implemented to assay the clonality of NK cell-depleted metastases. Fluorescence of trichromic reporter visualized in metastatic outbreaks generated in NSG mice lacking NK cells. c, FACS plots shows distribution of cells expressing Cerulean, Venus and mCherry per NK cell-depleted metastasis (lower) as compared to single and multi-color controls (upper); repeated independently for n = 6 NK cell-depleted macrometastases. d, Force-directed layout of all single cells (n = 6,073 cells) transcriptionally profiled from 8 NK cell-depleted macrometastases colored by Phenograph cluster. e, Kernel density plot of the imputed expression of SOX2 and SOX9 in each NK cell-depleted Phenograph cluster; clusters are ranked by median of the SOX2 distribution. f, A bipartite graph representing genome-wide correlations across all common, variably expressed genes (n = 2,895; Methods) between each NK cell-depleted Phenograph cluster (n = 18,circular nodes) and each developmental state observed in human tumors (n = 4, square nodes, annotated in Fig. 3c). The Pearson correlation is computed across all categorical assignments between the two independent sets and edges link NK cell-depleted Phenograph clusters to human developmental for Pearson R > 0.20 and two-sided p < 0.05; edge width is scaled by the magnitude of the correlation (observed range: 0.20–0.62). Pearson correlation coefficients are also reported in Supplementary Table 2. Shading is used to highlight nodes assigned the three metastatic states detailed in Fig. 4.
Figure 1.
Figure 1.. The single-cell transcriptional landscape of human lung adenocarcinoma.
a, Patient tissues profiled (metadata summarized in Extended Data Fig. 1). b, Cell type fractions detected per sample, color coded as in c. c, t-SNE projection of the complete atlas of normal lung, primary tumour and metastatic LUAD colored by cell type; includes carcinoma and non-tumour epithelium, as well as immune and other stromal cell types within the tumours (n = 40,505 cells). d, Cell-type abundances differ between normal, primary and metastatic sites (n = 17 patient samples; center line, median; box limits, upper and lower quartiles; whiskers, 1.5x interquartile range; points, outliers). Significant differences in cell type abundance are highlighted (Kruskal-Wallis rank test).
Figure 2.
Figure 2.. Regenerative and mixed lineages in primary tumours.
a, Key epithelial cell types and associated transcription factors (in brackets) implicated in lung development and regeneration. Specialized cell types of the SOX9-specified distal lung include type I alveolar epithelial cells (AEC1) that perform gas exchange, and type II alveolar epithelial cells (AEC2) that secrete surfactants. The SOX2-specified proximal upper airway includes secretory, neuroendocrine (NE) and ciliated cell types that predominantly serve barrier functions. Infiltrating stromal cell types that support lung epithelial development and are detected by scRNA-seq are also illustrated. b, Force-directed layout of normal and primary tumour epithelial cells colored by annotated lineage (n = 2,140 cells). Tumour cells that concomitantly express multiple cell type markers (mixed lineage) are in grey. Inset, same layout colored (in black) by source of epithelium. c, Left, Relative frequency of cells expressing each canonical lineage marker (any counts detected in un-imputed data) and the average un-imputed expression of each gene (z-normalized across epithelial cell types) for all expressing cells in a given cluster. Right, Kernel density plot depicting entropy of cell mixing across all patients for each cell type, computed with bootstrapping to correct for number of cells in each cluster (n = 100 random subsamples of data). High entropy indicates most similar cells come from a well-mixed set of patient samples; low entropy indicates most similar cells come from the same patient sample. d, Fraction of each cell type detected per patient sample (colors as in b). e, Top DEGs for a representative mixed lineage cluster (Cluster 2, n = 183 cells) compared to all other cells computed using MAST, indicating enrichment of AEC1, AEC2, club, ciliated, basal and AEP markers (volcano plots supporting other mixed-lineage clusters are in Extended Data Fig. 7a). Lineage-specific DEGs are colored by associated cell type (as in b), diameter proportional to −log10(padj) for genes with fold change > 1.5 and padj < 0.05 (see Supplementary Table 1 for lineage-specific genes). f, 2D cell density plot showing fraction of AEC1 and AEC2 lineage markers per cell in normal lung alveolar cells compared to tumour cells from Clusters 0 and 1. Only markers with normalized un-imputed expression in the top quartile (per gene, across all cells) are plotted. The overlapping distributions are shaded by cell type. g, Lineage phenotypic volume (Methods) of epithelium derived from primary tumours compared to normal lung, showing significant expansion of lineage gene-gene covariate structure in primary tumours (two-sided Mann-Whitney rank test, p < 0.001). n = 50 random subsamples of the data each (center line, median; box limits, upper and lower quartiles; whiskers, 1.5x interquartile range; points, outliers).
Figure 3.
Figure 3.. Metastases exhibit a continuum of stem to lung epithelial progenitor states.
a, For each patient metastatic cluster, boxplots indicate the cellular distribution of the average imputed and normalized expression of five key gene signatures associated with lung development (see Supplementary Table 2 for the signatures). Clusters are ranked by average expression of the lung epithelial signature; cluster color and labels are as in Extended Data Fig. 8a–b. Center line, median; box limits, upper and lower quartiles; whiskers, 1.5x interquartile range; points, outliers. Cells from type I clusters (n = 813) are associated with increased expression of an adult stem cell signature (two-sided Mann-Whitney U-test: U = 281595, p = 7e-81). Cells from type I and II clusters (n = 1,408) show increased expression of genes involved in epithelial-mesenchymal transition (EMT) (U = 215794, p = 1e-115). Cells from type II intermediate clusters (n = 595) were specifically enriched for regenerative pathways related to morphogenesis and specification of the respiratory endoderm (U = 332492, p =2e-25). Whereas cells from type III clusters (n = 756) exhibited the highest level of alveolar epithelial progenitor programs (U = 40174, p = 2e-276) and decreased expression of adult stem cell genes (U = 229739, p = 6e-106). b, Relationship between type I-III assignments and key transcription factors specifying stem and lung epithelial progenitors in the canonical model of lung morphogenesis. c, Imputed and normalized expression of key transcription factors specifying stem and lung epithelial progenitors (rows) for all individual tumour cells, ranked by average expression of the lung epithelial development GO signature (Supplementary Table 2) in ascending order from left to right. Expression of each transcription factor was z-normalized across all cells and smoothed using a 20-cell moving average widow. Clustering applied directly to this matrix (Methods) assigned each cell to a proliferating (P) or quiescent (Q) stem-like state (type I), regenerative state (type II), or a SOX9high alveolar epithelial progenitor state (type III) (top row). Bottom, average expression of three canonical proliferation markers across ranked tumour cells (Methods). d, SOX2 and SOX9 immunofluorescence and DAPI in matched primary tumour, lymph node and cerebellar metastases from representative patient (repeated in n = 4 independent matched patients with similar results). Scale bar, 50 μm. Additional patients in Extended Data Figure 8c. e, Percentage of each metastatic cluster detected per primary tumour. Center line, median; box limits, upper and lower quartiles; whiskers, 1.5x interquartile range; each point is a primary tumour (n = 8 independent patient samples). f, Hazard ratio (HR) with 95% confidence intervals for overall survival (OS), computed between lowest and highest quartiles for n = 673 LUAD patients (Methods). HR > 1 is poorly prognostic; HR < 1 indicates improved OS and any CI crossing the line at 1 is not significant.
Figure 4.
Figure 4.. Developmental continuum in a mouse model of metastatic escape.
a, Xenograft model of metastatic escape, illustrating the three stages from which single cells were sampled. b, BLI growth curves (measured ex vivo for up to 120 days) for all sampled xenograft metastases, including ex vivo BLI images acquired at tissue harvest. c-d, Force-directed layout of all metastatic tumour cells (n = 8,748 cells) isolated from 6 mice colored by (c) source and (d) Phenograph cluster. Clusters were grossly assigned to one of three metastatic states: Quiescent, correlated with a non-proliferating stem-like state (type I-Q); Regenerating, correlated with proliferating stem (type I-P) and the regenerative (type II) state; and Escape, which is highly concordant with SOX9high alveolar epithelial progenitors (type III) (see Methods). e, Force-directed layout (as in c,d) of all xenograft tumour cells colored by imputed, z-normalized SOX2 and SOX9 expression. f, Bipartite graph representing genome-wide correlations across all common, variably expressed genes (n = 2,096, Methods) between the 18 mouse clusters (circular nodes) and 4 developmental human tumour states (square nodes, annotated in Fig. 3c). Pie charts within circular nodes represent mouse cell sources. Edges link mouse clusters and human states with genome-wide Pearson R > 0.20 and two-sided p < 0.05; edge width is proportional to the correlation magnitude (see Supplementary Table 2 for exact values). Dotted arrows suggest temporal ordering between metastatic states, based on the three stages from which cells were isolated and profiled (according to BLI signature).
Figure 5.
Figure 5.. Developmental stage-specific differential immune sensitivity.
a, Average imputed and normalized Hallmark Inflammatory Response gene expression (Supplementary Table 2) across all patient-derived tumour cells, ranked by average lung epithelial development score. Each dot represents a cell colored by its imputed and normalized SOX9 transcript counts. b, NK cell co-culture assay. Tumour cells were cultured alone or with IL2-activated mouse NK cells at a 1:10 ratio for 3 h, and endogenous SOX2 and SOX9 were detected by immunofluorescence (IF). c, Fraction of H2087-LCC cells exclusively positive for either nuclear SOX9 or SOX2 before and after co-culture (average of 3 technical replicates for each of 4 independent experiments; paired two-sided t-tests, 3 degrees of freedom). A total of 134,946 cells before co-culture and 32,602 cells after co-culture were quantified. d, Percentage of cell death and apoptosis in H2087-LCC cells measured by flow cytometry before and after co-culture in the context of inducible SOX2 and SOX9 over-expression (center line, mean; whiskers, SEM; points, 3 independent experiments; unpaired two-sided t-test, 8 degrees of freedom). e, SOX9 IF in KP482T1 mouse metastatic tumour cells before and after 3-h co-culture of tumour and IL2-activated mouse NK cells at a ratio of 1:10 (repeated in 3 independent experiments with similar results). f, Expression of transcription factors specifying stem and lung epithelial progenitors, MHC Class I markers of self, and NK activating ligands across patient-derived tumour cells assigned to type I-Q, II or III developmental stages (top row, as in Fig. 3), in patient primary tumours and metastases. Proliferation refers to mean PCNA, MKI67 and MCM2 expression per cell. MHC Class I and NK activating show the average expression of their associated genes, visualized individually below. For each gene, imputed expression was z-normalized across all cells and smoothed using a 20-cell moving average widow. Dashed boxes indicate association with spontaneous micro- or macro-metastases observed in our xenograft model. Bottom, SOX2/SOX9 status. g, Relative expression of MHC Class I genes important for NK cell evasion in H2087-LCC cells with and without SOX2 or SOX9 induction, measured by RT-PCR (n = 3 technical replicates; center values, mean; error bars, 95% confidence interval). h, Cells positive for HLA Class I Bw4 surface protein, measured by flow cytometry (n = 3 independent experiments; center values, mean; error bars, 95% confidence interval; points, all measured data). i, Imputed expression of MHC Class I markers of self and Sox transcription factors specifying stem and lung epithelial progenitors in the D8.75 mouse gut tube, showing spatial segregation of Sox2 and Sox9 lineages in cells ranked by their pseudospace ordering. A, anterior; P, posterior. j, Correlation between average SOX9 target gene expression, predicted using motifs from the JASPAR Predicted Transcription Factor targets dataset (Supplementary Table 2), and the average expression of all MHC Class I genes across n = 510 TCGA LUAD patients (Pearson R = 0.48 and two-sided p < 0.001 to test for non-correlation). Outliers defined as 1.5X the interquartile range less than Q1 or greater than Q3 (n = 16) are removed from the scatter plot.
Figure 6.
Figure 6.. NK cell-dependent pruning limits the phenotypic expansion of metastasis-initiating cells.
a, in vivo NK cell perturbation assay in mice harboring latent metastasis-initiating cells. b, 2D cell density plot of z-normalized SOX2 and SOX9 imputed expression in H2087-LCC cells isolated from macrometastases +/− NK cell depletion, as determined by scRNA-seq. c, Fraction of type I/II and type III cells detected in spontaneous versus NK cell-depleted macrometastases (3 spontaneous macrometastases harvested from n = 3 independent mice and 8 NK cell-depleted macrometastases harvested from n = 5 independent mice; center line, geometric mean; whiskers, geometric s.d.; points, all measured data; two-sided Mann-Whitney rank test). Cell types are assigned by significant correlation with patient tumour states (Pearson R > 0.20 and two-sided p < 0.05 to test for non-correlation; as in Fig. 4f). d, Top DEG for NK cell-depleted cluster with highest SOX2 expression (Phenograph cluster 8, n = 322 cells, see Extended Data Fig. 10e) compared to all other cells, computed using MAST. DEGs are red, with diameter proportional to −log10(padj) for genes with fold change > 1.5 and padj < 0.05. e, SOX2 and SOX9 immunofluorescence in a representative spontaneous and NK cell-depleted macrometastasis (n = 15 macrometastases evaluated, nuclear SOX9 expression summarized in f). Scale bars, 50 μm. f, Nuclear SOX2 and SOX9 single-positive, double-positive, and negative cell fractions quantified per macrometastatic lesion (n = 11,376 single cells quantified, fraction of metastases reported across n=15 lesions including lung, bone, kidney, and soft connective tissues harvested from 7 mice). 5 representative 20X frames were evaluated per lesion. SOX9 single-positive cells were enriched in spontaneous as compared to NK-cell-depleted macrometastases (n = 15 independent macrometastases, p = 0.06, one-sided Mann-Whitney rank test); abundance of other cell types was not significantly altered (data not shown). Center line, geometric mean; whiskers, geometric s.d.; points, all measure data.

Comment in

References

    1. Beumer J & Clevers H Regulation and plasticity of intestinal stem cells during homeostasis and regeneration. Development 143, 3639–3649, doi:10.1242/dev.133132 (2016). - DOI - PubMed
    1. Kumar PA et al. Distal airway stem cells yield alveoli in vitro and during lung regeneration following H1N1 influenza infection. Cell 147, 525–538, doi:10.1016/j.cell.2011.10.001 (2011). - DOI - PMC - PubMed
    1. Vaughan AE et al. Lineage-negative progenitors mobilize to regenerate lung epithelium after major injury. Nature 517, 621–625, doi:10.1038/nature14112 (2015). - DOI - PMC - PubMed
    1. Zuo W et al. p63(+)Krt5(+) distal airway stem cells are essential for lung regeneration. Nature 517, 616–620, doi:10.1038/nature13903 (2015). - DOI - PMC - PubMed
    1. Zacharias WJ et al. Regeneration of the lung alveolus by an evolutionarily conserved epithelial progenitor. Nature 555, 251–255, doi:10.1038/nature25786 (2018). - DOI - PMC - PubMed

METHODS-ONLY REFERENCES

    1. Lee JH et al. Anatomically and Functionally Distinct Lung Mesenchymal Populations Marked by Lgr5 and Lgr6. Cell 170, 1149–1163, doi:10.1016/j.cell.2017.07.028 (2017). - DOI - PMC - PubMed
    1. Xia H et al. Calcium-binding protein S100A4 confers mesenchymal progenitor cell fibrogenicity in idiopathic pulmonary fibrosis. J Clin Invest 127, 2586–2597, doi:10.1172/JCI90832 (2017). - DOI - PMC - PubMed
    1. Degryse AL et al. Repetitive intratracheal bleomycin models several features of idiopathic pulmonary fibrosis. Am J Physiol Lung Cell Mol Physiol 299, L442–452, doi:10.1152/ajplung.00026.2010 (2010). - DOI - PMC - PubMed
    1. Tanjore H et al. Contribution of epithelial-derived fibroblasts to bleomycin-induced lung fibrosis. Am J Respir Crit Care Med 180, 657–665, doi:10.1164/rccm.200903-0322OC (2009). - DOI - PMC - PubMed
    1. Lawson WE et al. Characterization of fibroblast-specific protein 1 in pulmonary fibrosis. Am J Respir Crit Care Med 171, 899–907, doi:10.1164/rccm.200311-1535OC (2005). - DOI - PubMed

Publication types

MeSH terms