. 2020 Feb;26(2):252-258.
doi: 10.1038/s41591-020-0751-5. Epub 2020 Feb 10.

Using human genetics to understand the disease impacts of testosterone in men and women

Affiliations

Using human genetics to understand the disease impacts of testosterone in men and women

Katherine S Ruth et al. Nat Med. 2020 Feb.

Abstract

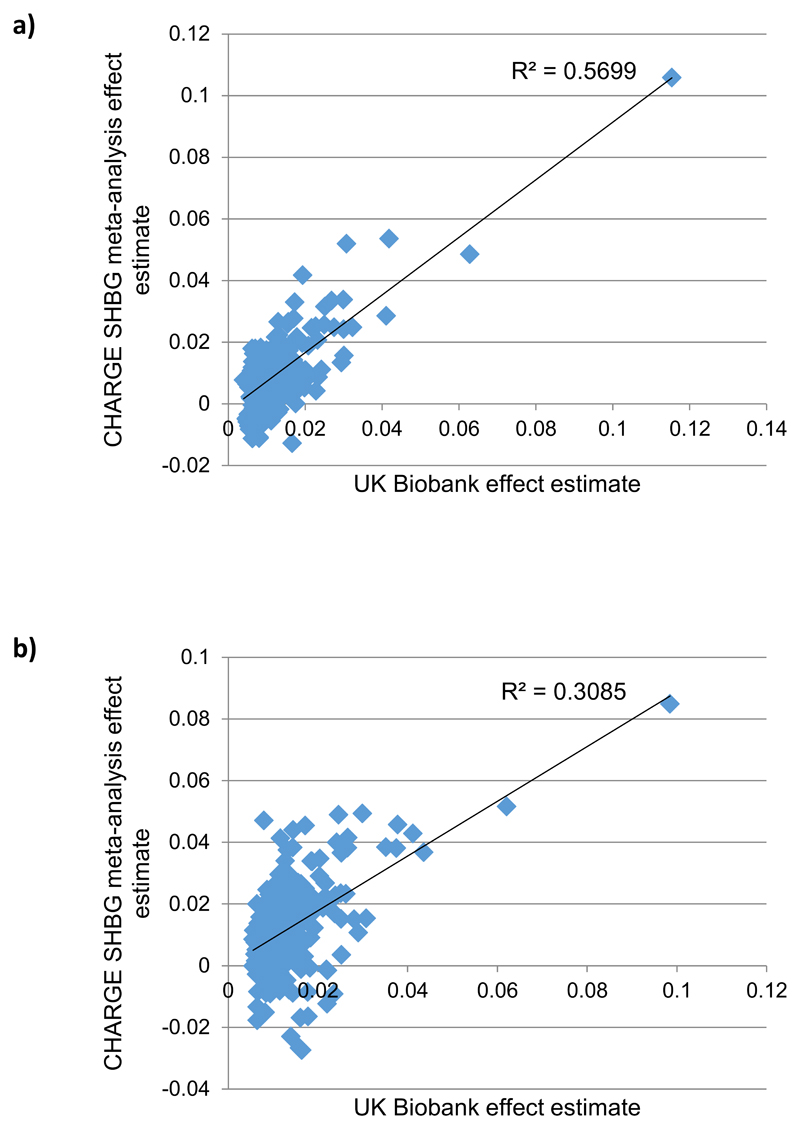
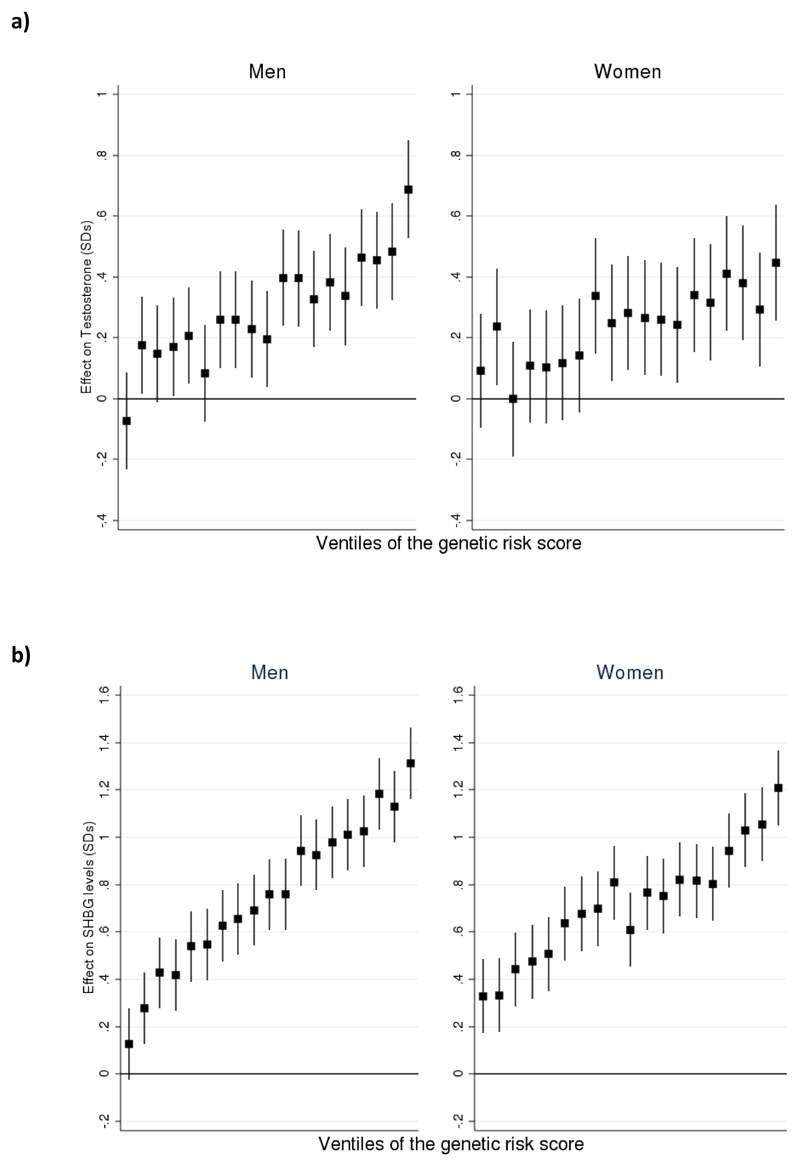
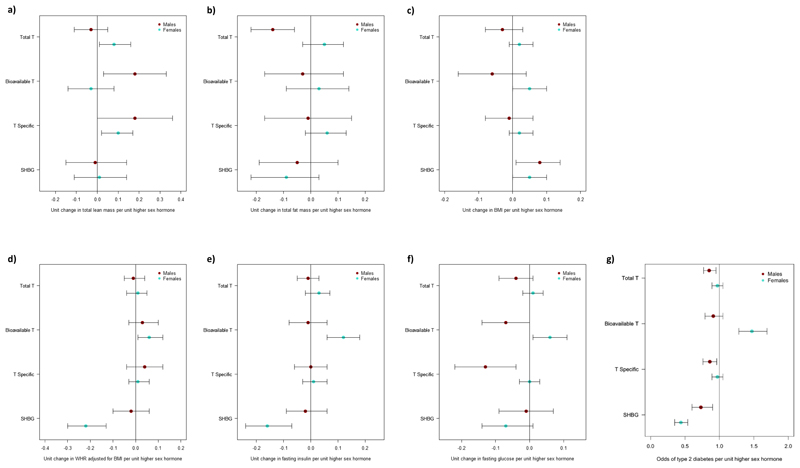
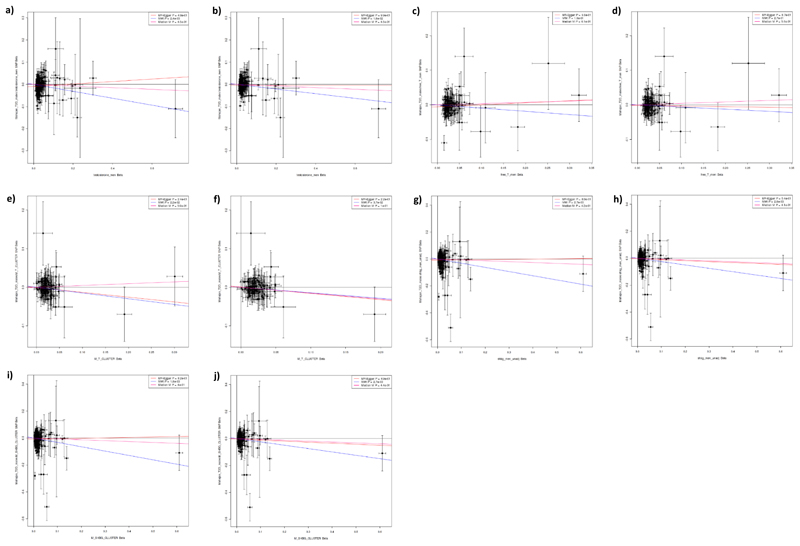
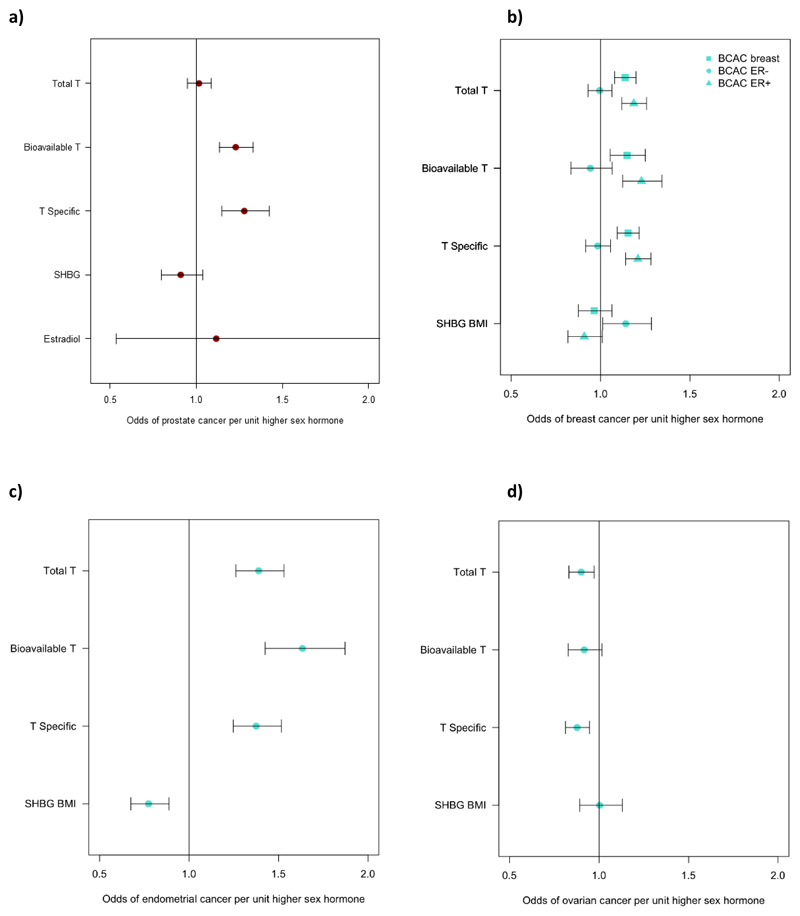
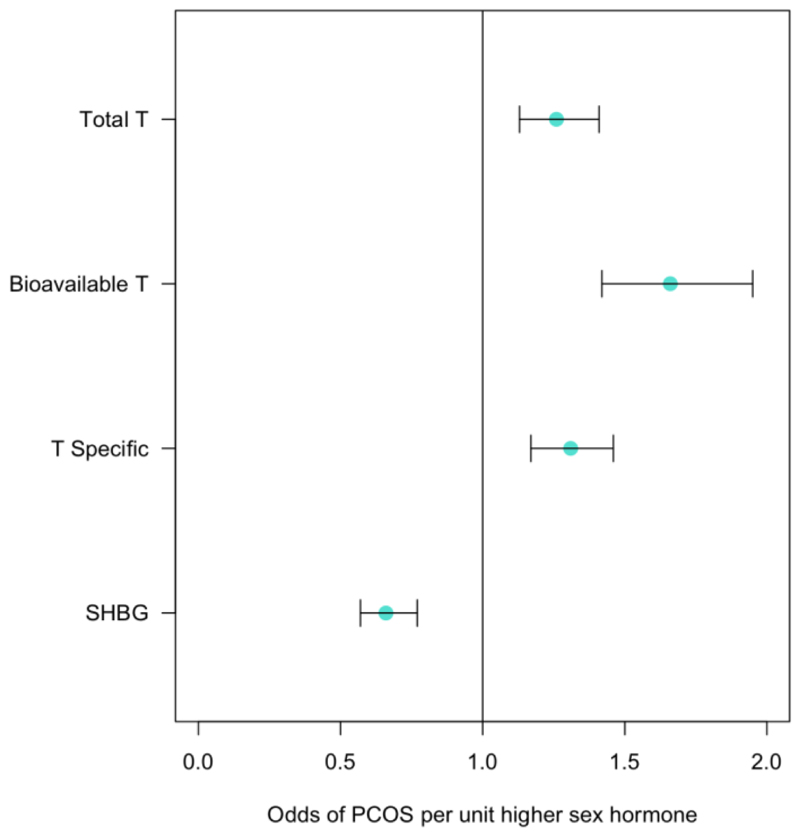
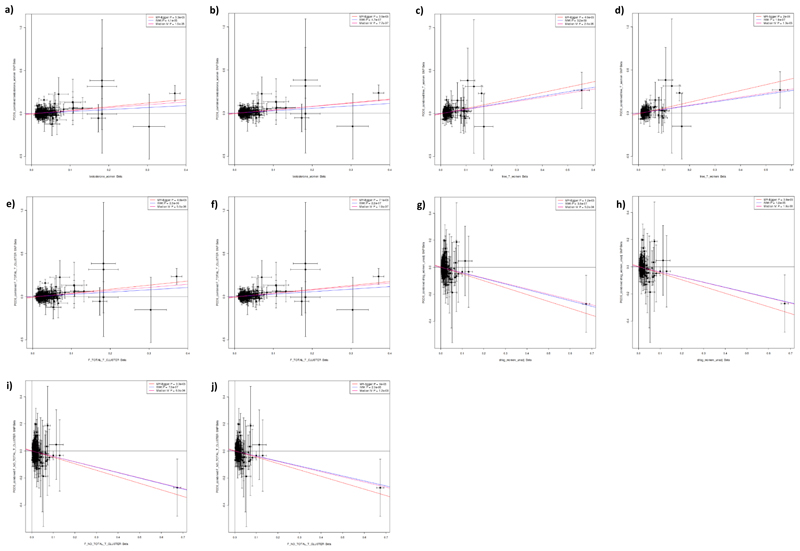
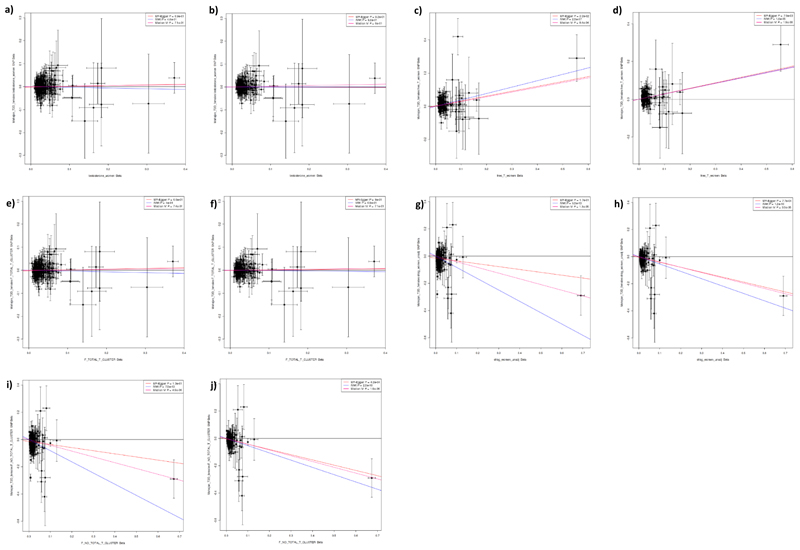
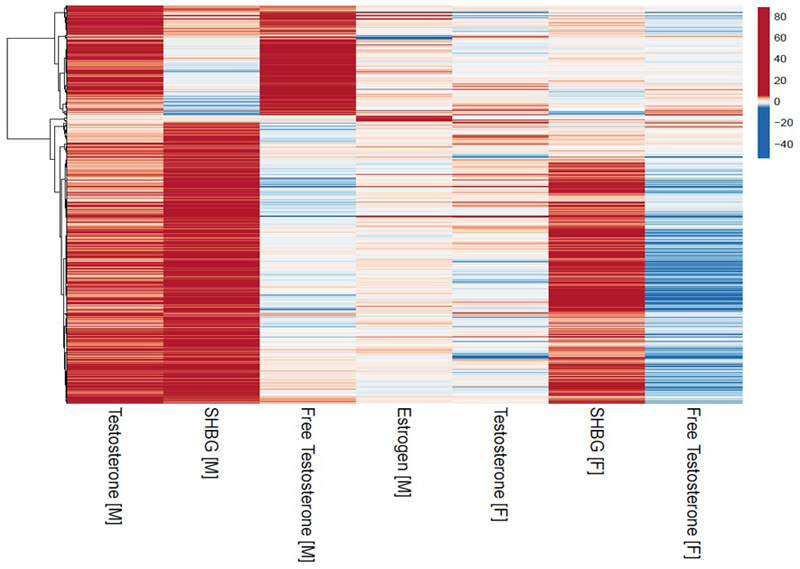
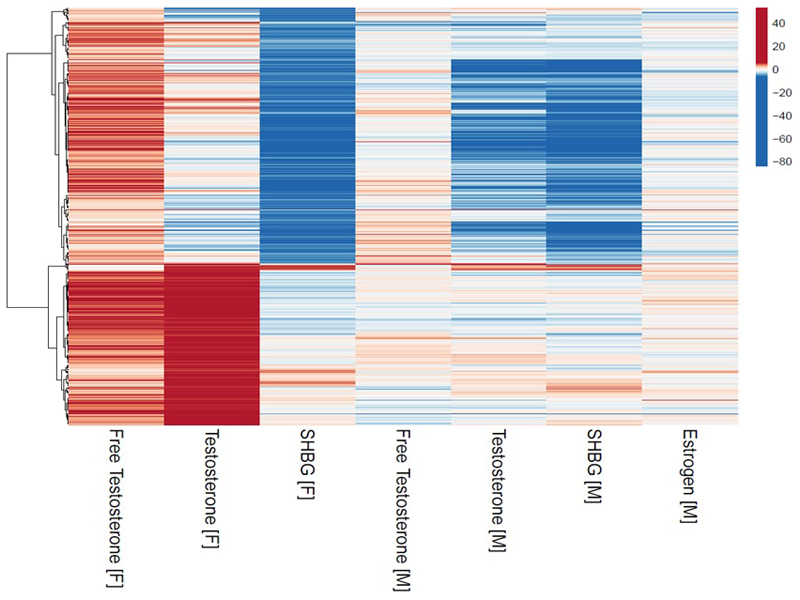
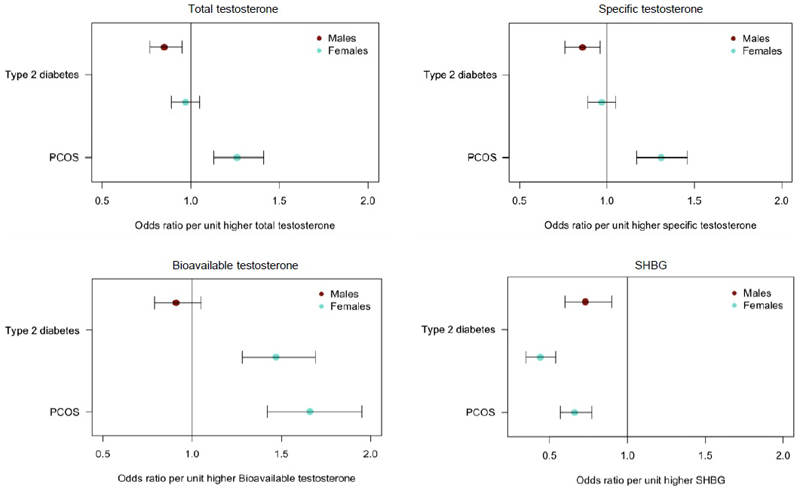
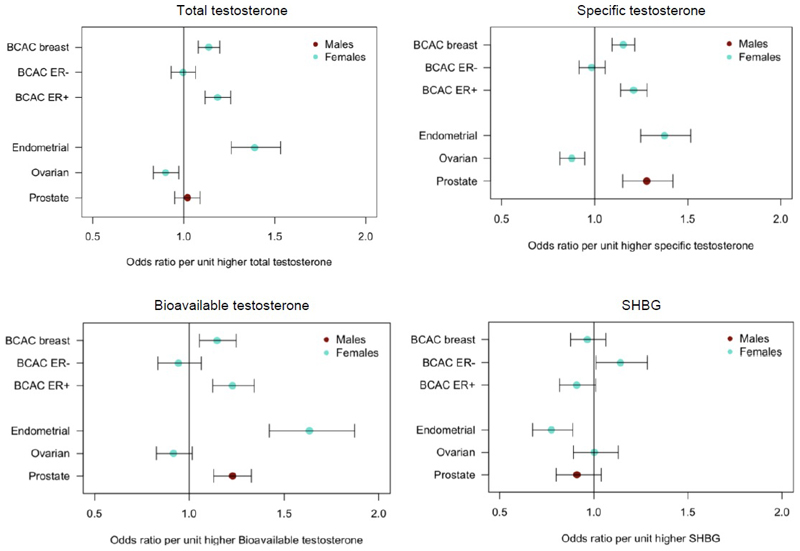
Testosterone supplementation is commonly used for its effects on sexual function, bone health and body composition, yet its effects on disease outcomes are unknown. To better understand this, we identified genetic determinants of testosterone levels and related sex hormone traits in 425,097 UK Biobank study participants. Using 2,571 genome-wide significant associations, we demonstrate that the genetic determinants of testosterone levels are substantially different between sexes and that genetically higher testosterone is harmful for metabolic diseases in women but beneficial in men. For example, a genetically determined 1 s.d. higher testosterone increases the risks of type 2 diabetes (odds ratio (OR) = 1.37 (95% confidence interval (95% CI): 1.22-1.53)) and polycystic ovary syndrome (OR = 1.51 (95% CI: 1.33-1.72)) in women, but reduces type 2 diabetes risk in men (OR = 0.86 (95% CI: 0.76-0.98)). We also show adverse effects of higher testosterone on breast and endometrial cancers in women and prostate cancer in men. Our findings provide insights into the disease impacts of testosterone and highlight the importance of sex-specific genetic analyses.


Conflict of interest statement

Competing Interests Statement

The views expressed in this article are those of the author(s) and not necessarily those of the NHS, the NIHR, or the Department of Health. M.I.M has served on advisory panels for Pfizer, NovoNordisk and Zoe Global, has received honoraria from Merck, Pfizer, Novo Nordisk and Eli Lilly, and research funding from Abbvie, Astra Zeneca, Boehringer Ingelheim, Eli Lilly, Janssen, Merck, NovoNordisk, Pfizer, Roche, Sanofi Aventis, Servier, and Takeda. As of June 2019, M.I.M is an employee of Genentech, and a holder of Roche stock. T.M.F. holds a MRC CASE studentship with GSK; has consulted for Sanofi, Servier and Boerhinger Ingelheim.

Figures

Extended Data Fig. 1
Extended Data Fig. 1. Replication of identified SHBG signals in CHARGE meta-analysis.
a) Effect size comparison performed against published estimates from the CHARGE male SHBG meta-analysis (N=12,401). b) Effect size comparison performed against published estimates from the CHARGE female SHBG meta-analysis (N=9,390). The SHBG cis locus (which had a concordant effect direction) has been excluded to maintain an appropriate scale.
Extended Data Fig. 2
Extended Data Fig. 2. Relationship between measured sex hormone levels in the EPIC-Norfolk study and polygenic score for increased sex hormone level.
a) Total testosterone levels in the EPIC-Norfolk study by polygenic score for increased total testosterone (n=5,334 men; n=3,804 women). b) SHBG levels in the EPIC-Norfolk study by polygenic score for increased SHBG (n=5,694 men; n=5,476 women). Bars denote the standard error around the point estimate of the mean. Effect on hormone is given in standard deviations (SDs). SHBG=sex hormone binding globulin.
Extended Data Fig. 3
Extended Data Fig. 3. LD score regression analysis of enrichment of sex hormone signals in 53 GTEx tissues and cell types.
a) Analysis in men. b) Analysis in women.
Extended Data Fig. 4
Extended Data Fig. 4. Results of inverse-variance weighted Mendelian randomization analysis of sex hormone genetic instruments on metabolic traits and body composition outcomes.
Dot plots representing the change in the following metabolic outcomes and body composition traits in males and females per unit higher sex hormone: a) Total lean mass. b) Total fat mass. c) BMI. d) Waist-hip ratio adjusted for BMI. e) Fasting insulin. f) Fasting glucose. g) Type 2 diabetes. Bars indicate 95% confidence interval around the point estimate from inverse-variance weighted analysis. Analyses are based on association statistics generated in a maximum of: total and specific testosterone, n=194,453 men and n=230,454 women; bioavailable testosterone, n=178,782 men and n=188,507 women; SHBG, n=180,726 men and n=189,473 women; total lean mass and total fat mass, n=9,102 men and n=10,406 women; BMI, n=152,893 men and n=171,977 women; WHR adjusted for BMI, n=93,480 men and n=116,742 women; fasting insulin, n=47,806 men and n=50,404 women; fasting glucose, n=67,506 men and n=73,089 women; T2D, n=34,990 cases and n=150,760 controls in men and n=17,790 cases and n=243,645 controls in women. Numbers of genetic variants included in the analyses are given in Tables S20, S21, S23 and S26. BMI=body mass index; SHBG=sex hormone binding globulin; T=testosterone; T Specific=testosterone cluster; WHR=waist-hip ratio.
Extended Data Fig. 5
Extended Data Fig. 5. Results of Mendelian randomization analysis in men of genetic instruments for testosterone and SHBG on the outcome of Type 2 diabetes.
Plots show effect on ln(odds) of Type 2 diabetes (y axes) in men of the following sex hormone genetic instruments (x axes; effect size in units). a) Total testosterone. b) Steiger filtered total testosterone. c) Bioavailable testosterone. d) Steiger filtered bioavailable testosterone. e) Testosterone specific cluster. f) Steiger filtered testosterone specific cluster. g) SHBG. h) Steiger filtered SHBG. i) SHBG specific cluster. j) Steiger filtered SHBG specific cluster. P-values and effect size estimates (indicated by lines) are from Egger (pink), IVW (blue), and median IV (red) Mendelian randomization analyses. Bars indicate 95% confidence interval around the point estimate for each genetic variant. Analyses are based on association statistics generated in a maximum of: total testosterone (including specific and Steiger filtered), n=194,453; bioavailable testosterone (including Steiger filtered), n=178,782; SHBG (including specific and Steiger filtered), n=180,726; T2D, n=34,990 cases and n=150,760 controls. Numbers of genetic variants included in the analyses are given in Table S20. SHBG=sex hormone binding globulin.
Extended Data Fig. 6
Extended Data Fig. 6. Results of inverse-variance weighted Mendelian randomization analysis of sex hormone genetic instruments on cancer outcomes.
Dot plots representing the change in the odds of the following cancers per unit higher sex hormone in males or females, as appropriate. a) Prostate cancer in males. b) Breast cancer (all types) and estrogen receptor positive (ER+) and negative (ER-) subtypes in females. c) Endometrial cancer in females. d) Ovarian cancer in females. Bars indicate 95% confidence interval around the point estimate from inverse-variance weighted analyses. Analyses are based on association statistics generated in a maximum of: total and specific testosterone, n=194,453 men and n=230,454 women; bioavailable testosterone, n=178,782 men and n=188,507 women; SHBG, n=180,726 men and n=189,473 women; estradiol, n=206,927 men; prostate cancer, 67,158 cases and 48,350 controls; breast cancer, n=105,974 cases and n=122,977 controls; ER negative subtype breast cancer, n=21,468 cases and n=100,594 controls; ER positive subtype breast cancer, n=69,501 cases and n=95,039 controls; endometrial cancer, n=12,270 cases and n=46,126 controls; ovarian cancer, n=25,509 cases and n=40,941 controls. Numbers of genetic variants included in the analyses are given in Tables S25 and S27. SHBG=sex hormone binding globulin; T=testosterone; T Specific=testosterone cluster.
Extended Data Fig. 7
Extended Data Fig. 7. Results of inverse-variance weighted Mendelian randomization analysis in females of sex hormone genetic instruments on PCOS.
Dot plot represents the odds of PCOS per unit higher sex hormone. Bars indicate 95% confidence interval around the point estimate from inverse-variance weighted analyses. Analyses are based on association statistics generated in a maximum of: total and specific testosterone, n=230,454; bioavailable testosterone, n=188,507; SHBG, n=189,473; PCOS, n=10,074 cases and n=103,164 controls. Numbers of genetic variants included in the analyses are given in Table S21. PCOS=polycystic ovary syndrome; SHBG=sex hormone binding globulin; T=testosterone; T Specific=testosterone cluster
Extended Data Fig. 8
Extended Data Fig. 8. Results of Mendelian randomization analysis in women of genetic instruments for testosterone and SHBG on the outcome of PCOS.
Plots show effect on ln(odds) of PCOS (y axes) of the following sex hormone genetic instruments in women (x axes; effect size in units). a) Total testosterone. b) Steiger filtered total testosterone. c) Bioavailable testosterone. d) Steiger filtered bioavailable testosterone. e) Testosterone specific cluster. f) Steiger filtered testosterone specific cluster. g) SHBG. h) Steiger filtered SHBG. i) SHBG specific cluster. j) Steiger filtered SHBG specific cluster. P-values and effect size estimates (indicated by lines) are from Egger (pink), IVW (blue), and median IV (red) Mendelian randomization analyses. Bars indicate 95% confidence interval around the point estimate for each genetic variant. Analyses are based on association statistics generated in a maximum of: total testosterone (including specific and Steiger filtered), n=230,454; bioavailable testosterone (including Steiger filtered), n=188,507; SHBG (including specific and Steiger filtered), n=189,473; PCOS, n=10,074 cases and n=103,164 controls. Numbers of genetic variants included in the analyses are given in Table S21. PCOS=polycystic ovary syndrome; SHBG=sex hormone binding globulin.
Extended Data Fig. 9
Extended Data Fig. 9. Results of Mendelian randomization analysis in women of genetic instruments for testosterone and SHBG on the outcome of Type 2 diabetes.
Plots show effect on ln(odds) of Type 2 diabetes in women (y axes) of the following sex hormone genetic instruments in women (x axes; effect size in units). a) Total testosterone. b) Steiger filtered total testosterone. c) Bioavailable testosterone. d) Steiger filtered bioavailable testosterone. e) Testosterone specific cluster. f) Steiger filtered testosterone specific cluster. g) SHBG. h) Steiger filtered SHBG. i) SHBG specific cluster. j) Steiger filtered SHBG specific cluster. P-values and effect size estimates (indicated by lines) are from Egger (pink), IVW (blue), and median IV (red) Mendelian randomization analyses. Bars indicate 95% confidence interval around the point estimate for each genetic variant. Analyses are based on association statistics generated in a maximum of: total testosterone (including specific and Steiger filtered), n=230,454; bioavailable testosterone (including Steiger filtered), n=188,507; SHBG (including specific and Steiger filtered), n=189,473; T2D, n=17,790 cases and n=243,645 controls. Numbers of genetic variants included in the analyses are given in Table S21. SHBG=sex hormone binding globulin.
Figure 1
Figure 1
Cluster analysis of male identified sex hormone signals. All Z-score effects are aligned to the male total testosterone increasing allele.
Figure 2
Figure 2
Cluster analysis of female identified sex hormone signals. All Z-score effects are aligned to the female bioavailable testosterone increasing allele.
Figure 3
Figure 3
Plots showing the odds of T2D and PCOS per unit higher testosterone and SHBG using genetic instruments in Mendelian Randomization analyses. Unit measurements for the individually transformed exposure traits can be found in Table S1. Specific testosterone refers to a total testosterone score which has no aggregate effect on SHBG. Bars indicate 95% confidence interval around the point estimates from inverse-variance weighted analyses. Analyses are based on association statistics generated in a maximum of: total and specific testosterone, n=194,453 men and n=230,454 women; bioavailable testosterone, n=178,782 men and n=188,507 women; SHBG, n=180,726 men and n=189,473 women; T2D, n=34,990 cases and n=150,760 controls in men and n=17,790 cases and n=243,645 controls in women; PCOS, n=10,074 cases and n=103,164 controls. Numbers of genetic variants included in the analyses are given in Tables S20 and S21.
Figure 4
Figure 4
Plot showing the odds of cancer per unit higher testosterone and SHBG using genetic instruments in Mendelian Randomization analyses. Unit measurements for the individually transformed exposure traits can be found in Table S1. Specific testosterone refers to a total testosterone score which has no aggregate effect on SHBG. Bars indicate 95% confidence interval around the point estimates from inverse-variance weighted analyses. Analyses are based on association statistics generated in a maximum of: total and specific testosterone, n=194,453 men and n=230,454 women; bioavailable testosterone, n=178,782 men and n=188,507 women; SHBG, n=180,726 men and n=189,473 women; breast cancer, n=105,974 cases and n=122,977 controls; ER negative subtype breast cancer, n=21,468 cases and n=100,594 controls; ER positive subtype breast cancer, n=69,501 cases and n=95,039 controls; endometrial cancer, n=12,270 cases and n=46,126 controls; ovarian cancer, n=25,509 cases and n=40,941 controls; prostate cancer, 67,158 cases and 48,350 controls. Numbers of genetic variants included in the analyses are given in Tables S25 and S27.

Comment in

References

    1. Ding EL, Song Y, Malik VS, Liu S. Sex differences of endogenous sex hormones and risk of type 2 diabetes: a systematic review and meta-analysis. JAMA. 2006;295:1288–99. - PubMed
    1. Yao Q-M, Wang B, An X-F, Zhang J-A, Ding L. Testosterone level and risk of type 2 diabetes in men: a systematic review and meta-analysis. Endocr Connect. 2018;7:220–231. - PMC - PubMed
    1. Bann D, et al. Changes in testosterone related to body composition in late midlife: Findings from the 1946 British birth cohort study. Obesity (Silver Spring) 2015;23:1486–92. - PMC - PubMed
    1. Baillargeon J, Kuo Y-F, Westra JR, Urban RJ, Goodwin JS. Testosterone Prescribing in the United States, 2002-2016. JAMA. 2018;320:200–202. - PMC - PubMed
    1. Handelsman DJ. Global trends in testosterone prescribing, 2000-2011: expanding the spectrum of prescription drug misuse. Med J Aust. 2013;199:548–51. - PubMed

Publication types

MeSH terms