. 2020 Jan 1;10(4):1555-1571.
doi: 10.7150/thno.37383. eCollection 2020.

Therapeutic targeting of YY1/MZF1 axis by MZF1-uPEP inhibits aerobic glycolysis and neuroblastoma progression

Affiliations

Therapeutic targeting of YY1/MZF1 axis by MZF1-uPEP inhibits aerobic glycolysis and neuroblastoma progression

Erhu Fang et al. Theranostics. .

Abstract

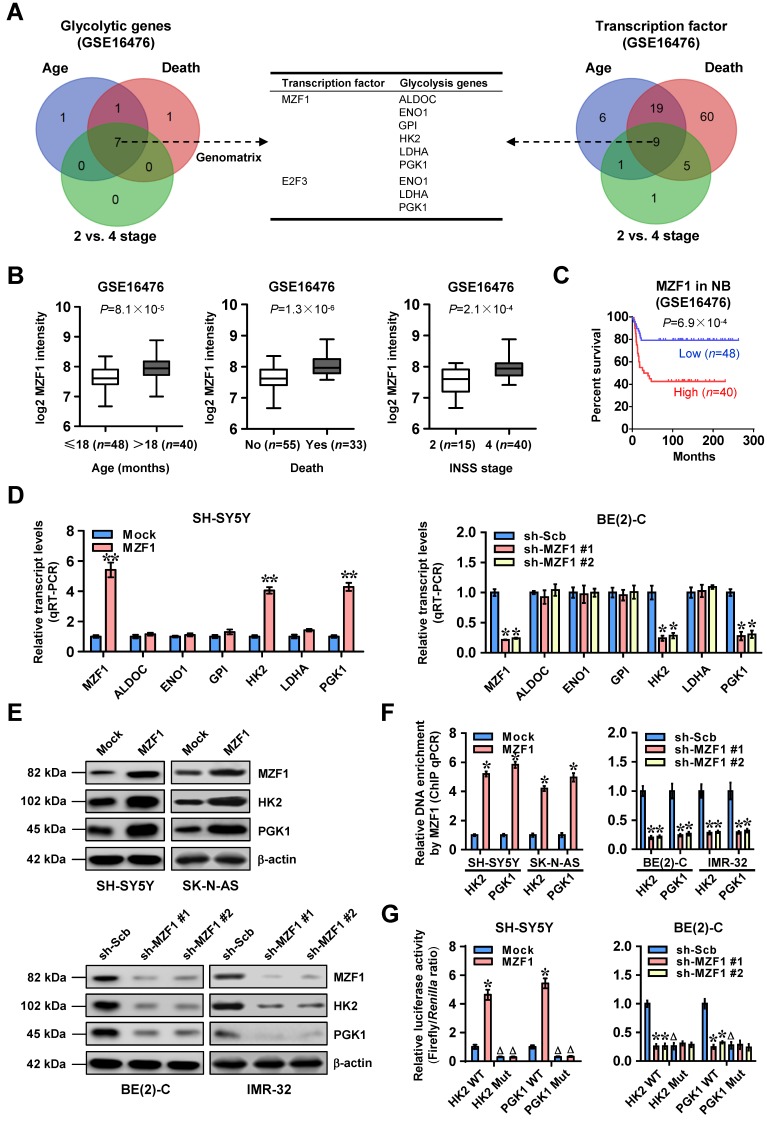
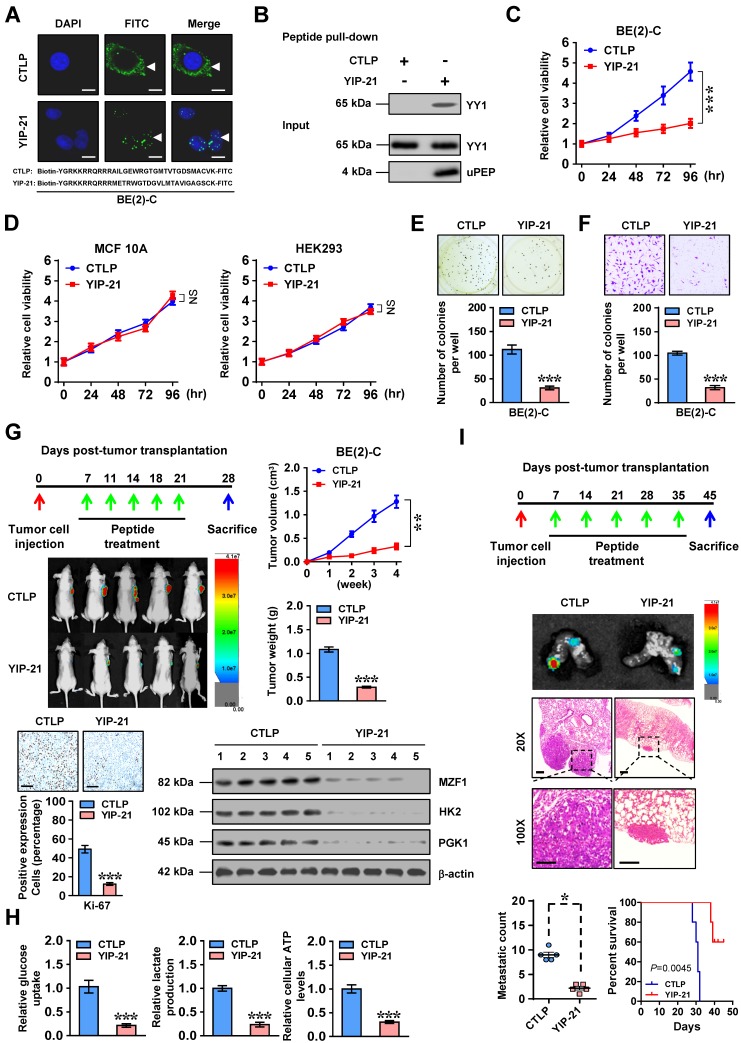
As a hallmark of metabolic reprogramming, aerobic glycolysis contributes to tumorigenesis and aggressiveness. However, the mechanisms and therapeutic strategies regulating aerobic glycolysis in neuroblastoma (NB), one of leading causes of cancer-related death in childhood, still remain elusive. Methods: Transcriptional regulators and their downstream glycolytic genes were identified by a comprehensive screening of publicly available datasets. Dual-luciferase, chromatin immunoprecipitation, real-time quantitative RT-PCR, western blot, gene over-expression or silencing, co-immunoprecipitation, mass spectrometry, peptide pull-down assay, sucrose gradient sedimentation, seahorse extracellular flux, MTT colorimetric, soft agar, matrigel invasion, and nude mice assays were undertaken to explore the biological effects and underlying mechanisms of transcriptional regulators in NB cells. Survival analysis was performed by using log-rank test and Cox regression assay. Results: Transcription factor myeloid zinc finger 1 (MZF1) was identified as an independent prognostic factor (hazard ratio=2.330, 95% confidence interval=1.021 to 3.317), and facilitated glycolysis process through increasing expression of hexokinase 2 (HK2) and phosphoglycerate kinase 1 (PGK1). Meanwhile, a 21-amino acid peptide encoded by upstream open reading frame of MZF1, termed as MZF1-uPEP, bound to zinc finger domain of Yin Yang 1 (YY1), resulting in repressed transactivation of YY1 and decreased transcription of MZF1 and downstream genes HK2 and PGK1. Administration of a cell-penetrating MZF1-uPEP or lentivirus over-expressing MZF1-uPEP inhibited the aerobic glycolysis, tumorigenesis and aggressiveness of NB cells. In clinical NB cases, low expression of MZF1-uPEP or high expression of MZF1, YY1, HK2, or PGK1 was associated with poor survival of patients. Conclusions: These results indicate that therapeutic targeting of YY1/MZF1 axis by MZF1-uPEP inhibits aerobic glycolysis and NB progression.

Keywords: Yin Yang 1.; aerobic glycolysis; myeloid zinc finger 1; tumor progression; upstream open reading frame.


Conflict of interest statement

Competing Interests: The authors have declared that no competing interest exists.

Figures

Figure 1
Figure 1
MZF1 facilitates the transcription of glycolytic genes in NB. (A) Venn diagram indicating the identification of glycolytic genes (left panel) and transcription factors (right panel) differentially expressed in 88 NB cases (GSE16476) with various status of age, death, and INSS stages, and the over-lapping analysis with potential transcription factors regulating glycolytic genes revealed by Genomatix program. The middle panel showing the potential transcription factors regulating expression of glycolytic genes. (B) Mining of a public microarray dataset (GSE16476) revealing the MZF1 levels in NB tissues with different status of age, death, or INSS stages. (C) Kaplan-Meier curve showing overall survival of 88 NB patients (GSE16476) with high or low MZF1 expression (cutoff value=226.6). (D and E) Real-time qRT-PCR (D, normalized to β-actin, n=4) and western blot (E) assays indicating the transcript and protein levels of MZF1, ALDOC, ENO1, GPI, HK2, LDHA, or PGK1 in SH-SY5Y and BE(2)-C cells stably transfected with empty vector (mock), MZF1, scramble shRNA (sh-Scb), or sh-MZF1. (F) ChIP and qPCR assays showing the binding of MZF1 to promoters of HK2 and PGK1 in SH-SY5Y, SK-N-AS, BE(2)-C, and IMR-32 cells stably transfected with mock, MZF1, sh-Scb, or sh-MZF1 (n=4). (G) Dual-luciferase assay indicating the promoter activity of HK2 and PGK1 with wild-type (WT) or mutant (Mut) MZF1 binding site in SH-SY5Y and BE(2)-C cells stably transfected with mock, MZF1, sh-Scb, or sh-MZF1 (n=6). Fisher's exact test for over-lapping analysis in A. Student's t test compared the difference in B. Log-rank test for survival comparison in C. Student's t test and ANOVA compared the difference in D, F and G. * P<0.05, ** P<0.01 vs. mock or sh-Scb. Δ P<0.05 vs. WT. Bars are means and whiskers (min to max) in B. Data are shown as mean ± s.e.m. (error bars) and representative of three independent experiments in D-G.
Figure 2
Figure 2
MZF1 promotes the aerobic glycolysis of NB cells. (A) Western blot assay indicating the expression of MZF1, HK2, and PGK1 in SH-SY5Y, SK-N-AS, BE(2)-C, and IMR-32 cells stably transfected with dCas9a control (dCas9a-CTL), dCas9a-MZF1, dCas9i control (dCas9i-CTL), or dCas9i-MZF1. (B) Seahorse tracing curves (left panel) and ECAR bars (right panel) of SH-SY5Y and BE(2)-C cells stably transfected with empty vector (mock), MZF1, scramble shRNA (sh-Scb), sh-MZF1, dCas9a-CTL, dCas9a-MZF1, dCas9i-CTL, or dCas9i-MZF1, and those treated with glucose (10 mmol·L-1), oligomycin (2 μmol·L-1), or 2-deoxyglucose (2-DG, 100 mmol·L-1) at indicated (4 replicates for each point). (C and D) Glucose uptake, lactate production, and ATP levels in SH-SY5Y (C) and BE(2)-C (D) cells stably transfected with mock, MZF1, sh-Scb, sh-MZF1, dCas9a-CTL, dCas9a-MZF1, dCas9i-CTL, or dCas9i-MZF1 (n=4). Student's t test and ANOVA compared the difference in B-D. ** P<0.01 vs. mock, sh-Scb, dCas9a-CTL, or dCas9i-CTL. Data are shown as mean ± s.e.m. (error bars) and representative of three independent experiments in A-D.
Figure 3
Figure 3
MZF1-uORF-encoded peptide inhibits MZF1 expression. (A) Dual-luciferase assay (right panel) indicating the activity of luciferase reporters containing wild-type, mutant, or deletion forms of uORF within 5'-UTR and promoter fragment of MZF1 (left panel) in SH-SY5Y and BE(2)-C cells (n=4). (B) Western blot assay showing the levels of MZF1 in SH-SY5Y cells transfected with empty vector (mock), MZF1 coding sequence (CDS), MZF1 containing wild-type, mutant, or deletion forms of 5'-UTR, scramble shRNA (sh-Scb), or sh-uORF. (C) Mining of GWIPS-viz database (left panel) revealing the ribosome profiling at uORF region of MZF1 (outlined), with homology of MZF1-uORF-encoded amino acid sequence as indicated (right panel). (D) Western blot assay using antibody specific for GFP (upper panel) indicating the expression of GFP and MZF1-uPEP-GFP fusion protein in HEK293 cells transfected with GFP or wild-type, mutation, or deletion forms of MZF1-uORF-GFP as indicated (lower panel). (E) Western blot assay using MZF1-uPEP specific antibody showing the expression of MZF1-uPEP and MZF1-uPEP-GFP fusion protein in BE(2)-C cells transfected with GFP or MZF1-uORF-GFP, with synthesized scramble (Scb) peptide or uPEP as controls. (F) Western blot assay (lower panel) indicating the expression of GFP, MZF1-uPEP, or MZF1 in BE(2)-C cells transfected with wild-type or mutant GFP, MZF1-uORF-GFP constructs, or Flag-tagged MZF1-uORF constructs as indicated (upper panel). ANOVA compared the difference in A. * P<0.05 vs. mock. Data are shown as mean ± s.e.m. (error bars) and representative of three independent experiments in A, B, and D-F.
Figure 4
Figure 4
MZF1-uPEP interacts with YY1 to suppress its transactivation. (A and B) Confocal images showing the localization of MZF1-uPEP-GFP fusion protein or Flag-tagged MZF1-uPEP in HeLa and BE(2)-C cells transfected with wild-type (WT) or mutant (Mut) GFP, MZF1-uORF-GFP constructs, or Flag-tagged MZF1-uORF. (C) Immunofluorescence assay using MZF1-uPEP specific antibody indicating the localization of MZF1-uPEP in BE(2)-C cells transfected with N-terminal Flag vector or Flag-tagged MZF1-uORF, and that of SH-SY5Y cells treated with DMSO or LMB (20 nmol/L) for 48 hrs. (D) Coomassie blue staining (left panel) and Venn diagram (right panel) showing mass spectrometry (MS)-identified differential proteins pulled down by Flag antibody from BE(2)-C cells transfected with N-terminal Flag or Flag-tagged MZF1-uORF, and the over-lapping analysis with potential transcription factors of MZF1 revealed by UCSC Genome Browser. (E) Co-IP and western blot assays revealing the interaction of MZF1-uPEP with YY1 or USF2 in BE(2)-C cells. (F) Immunofluorescence staining assay showing the co-localization of MZF1-uPEP (green) and YY1 (red) in SH-SY5Y cells, with nuclei stained by DAPI (blue). Scale bar: 10 μm. (G) Co-IP and western blot assays (upper panel) revealing the interaction between MZF1-uPEP and YY1 in BE(2)-C cells transfected with Flag-tagged MZF1-uORF and full-length or truncations of Myc-tagged YY1 as indicated (lower panel). (H and I) Dual-luciferase (H) and ChIP qPCR (I) assays showing the activity of reporter containing four canonical YY1 binding sites and binding of YY1 to MZF1 promoter in NB cells stably transfected with mock, MZF1-uORF, sh-Scb, or sh-uORF, and those co-transfected with YY1 or sh-YY1 (n=4). ANOVA compared the difference in H and I. * P<0.05 vs. mock or sh-Scb. Data are shown as mean ± s.e.m. (error bars) and representative of three independent experiments in A-C and E-I.
Figure 5
Figure 5
Therapeutic efficiency of cell-penetrating MZF1-uPEP. (A) Representative confocal images indicating the distribution of FITC-labeled control (CTLP) or YY1 inhibitory peptide (YIP-21, 20 μmol/L) in BE(2)-C cells, with nuclei stained by DAPI (blue). Scale bar: 10 μm. (B) Peptide pull-down assay showing the levels of YY1 pulled down by biotin-labeled CTLP or YIP-21 (20 μmol/L) from SH-SY5Y cells. (C and D) MTT colorimetric assay indicating the viability of BE(2)-C, MCF 10A, or HEK293 cells treated with CTLP or YIP-21 (20 μmol/L, n=6). (E and F) Representative images (upper panel) and quantification (lower panel) of soft agar (E) and matrigel invasion (F) assays showing the growth and invasion of BE(2)-C cells treated with CTLP or YIP-21 (20 μmol/L, n=4) for 48 hrs. (G) Representative images, in vivo growth curve, tumor weight, Ki-67 immunostaining, and expression of MZF1 and downstream glycolytic genes within BE(2)-C-formed subcutaneous xenograft tumors (n=5 per group) in nude mice that treated with tail vein injection of CTLP or YIP-21 (3 mg·kg-1) as indicated. (H) Glucose uptake, lactate production, and ATP levels of BE(2)-C-formed subcutaneous xenograft tumors in nude mice (n=5 per group) that treated with tail vein injection of CTLP or YIP-21 (3 mg·kg-1). (I) Representative images (middle panels) and metastatic counts of lungs (lower left panel) and Kaplan-Meier curves (lower right panel) of nude mice (n=5 per group) treated with tail vein injection of BE(2)-C cells and CTLP or YIP-21 (3 mg·kg-1) as indicated (upper panel). Student's t test and ANOVA compared the difference in C-I. Log-rank test for survival comparison in I. * P<0.05, ** P<0.01, *** P<0.001 vs. CTLP. NS, non-significant. Data are shown as mean ± s.e.m. (error bars) and representative of three independent experiments in A-F.
Figure 6
Figure 6
MZF1-uPEP/YY1/MZF1 expression is associated with NB outcome. (A) Representative images of immunohistochemical staining showing the expression patterns of MZF1-uPEP, YY1, and MZF1 in tumor cells of NB specimens (arrowheads, brown). Scale bars: 50 μm. (B) Kaplan-Meier curves indicating overall survival of 42 NB patients with high or low MZF1-uPEP immunostaining in 88 (GSE16476) NB cases with low or high expression levels of YY1 (cutoff value=1003.1). (C and D) Western blot (C) and real-time qRT-PCR (D, normalized to β-actin) assays showing the expression of YY1, MZF1, and target genes in normal dorsal root ganglia (DG), NB tissues (n=42), and NB cell lines. (E) Mining of a public microarray dataset (GSE16476) revealing the levels of YY1 in NB tissues with different status of age, death, or INSS stages. (F) The positive expression correlation of YY1 with MZF1, HK2, or PGK1 in 88 NB cases (GSE16476). (G) The mechanisms underlying MZF1-uPEP-suppressed tumor progression: as an uORF-encoded small peptide, MZF1-uPEP directly binds to YY1 to repress its transactivation, resulting in decreased transcription of MZF1 and downstream target glycolytic genes, and reduced aerobic glycolysis and tumor progression. Log-rank test for survival comparison in B. Student's t test compared the difference in D and E. Pearson's correlation coefficient analysis for gene expression in F. * P<0.05 vs. DG. Data are shown as mean ± s.e.m. (error bars) and representative of three independent experiments in C and D. Bars are means and whiskers (min to max) in E.

Similar articles

Cited by

References

    1. Maris J. Recent advances in neuroblastoma. N Engl J Med. 2010;362:2202–11. - PMC - PubMed
    1. Zhang Q, Zhang Q, Jiang X, Ye Y, Liao H, Zhu F. et al. Collaborative ISL1/GATA3 interaction in controlling neuroblastoma oncogenic pathways overlapping with but distinct from MYCN. Theranostics. 2019;9:986–1000. - PMC - PubMed
    1. Villasante A, Sakaguchi K, Kim J, Cheung NK, Nakayama M, Parsa H. et al. Vascularized tissue-engineered model for studying drug resistance in neuroblastoma. Theranostics. 2017;7:4099–117. - PMC - PubMed
    1. Warburg O. On the origin of cancer cells. Science. 1956;123:309–14. - PubMed
    1. Hanahan D, Weinberg RA. Hallmarks of cancer: the next generation. Cell. 2011;144:646–74. - PubMed

Publication types

MeSH terms