

Gold nanoclusters elicit homeostatic perturbations in glioblastoma cells and adaptive changes of lysosomes
- PMID: 32042327
- PMCID: PMC6993243
- DOI: 10.7150/thno.37674
Gold nanoclusters elicit homeostatic perturbations in glioblastoma cells and adaptive changes of lysosomes
Abstract
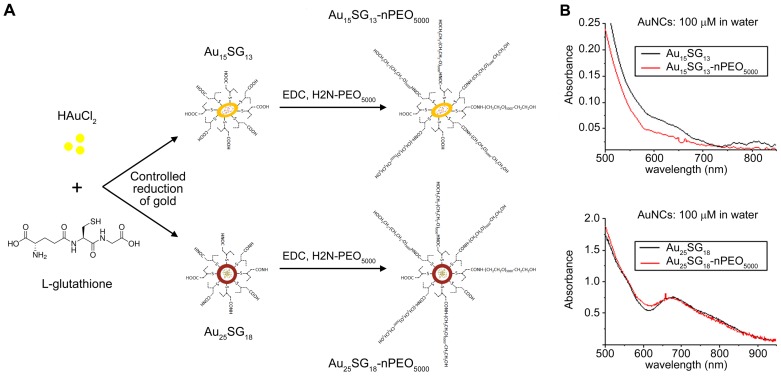
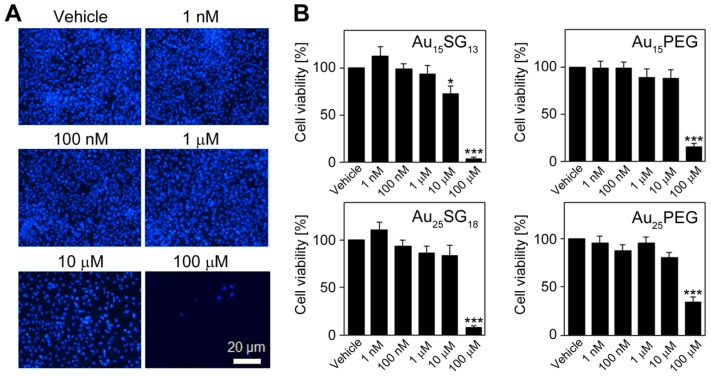
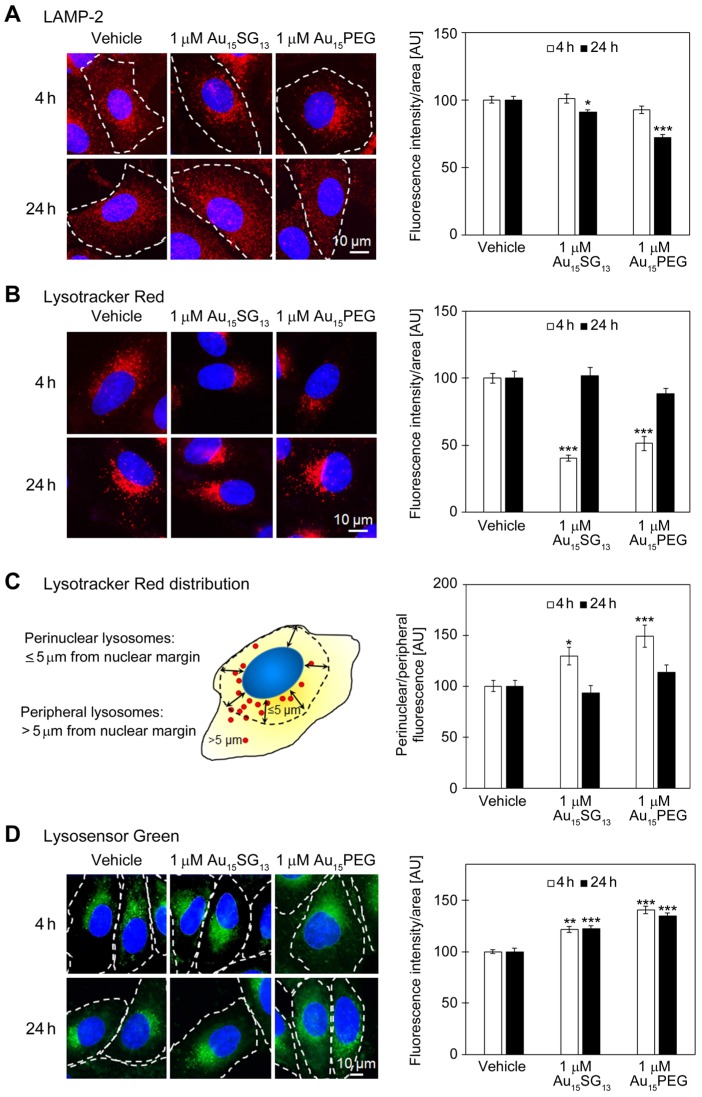
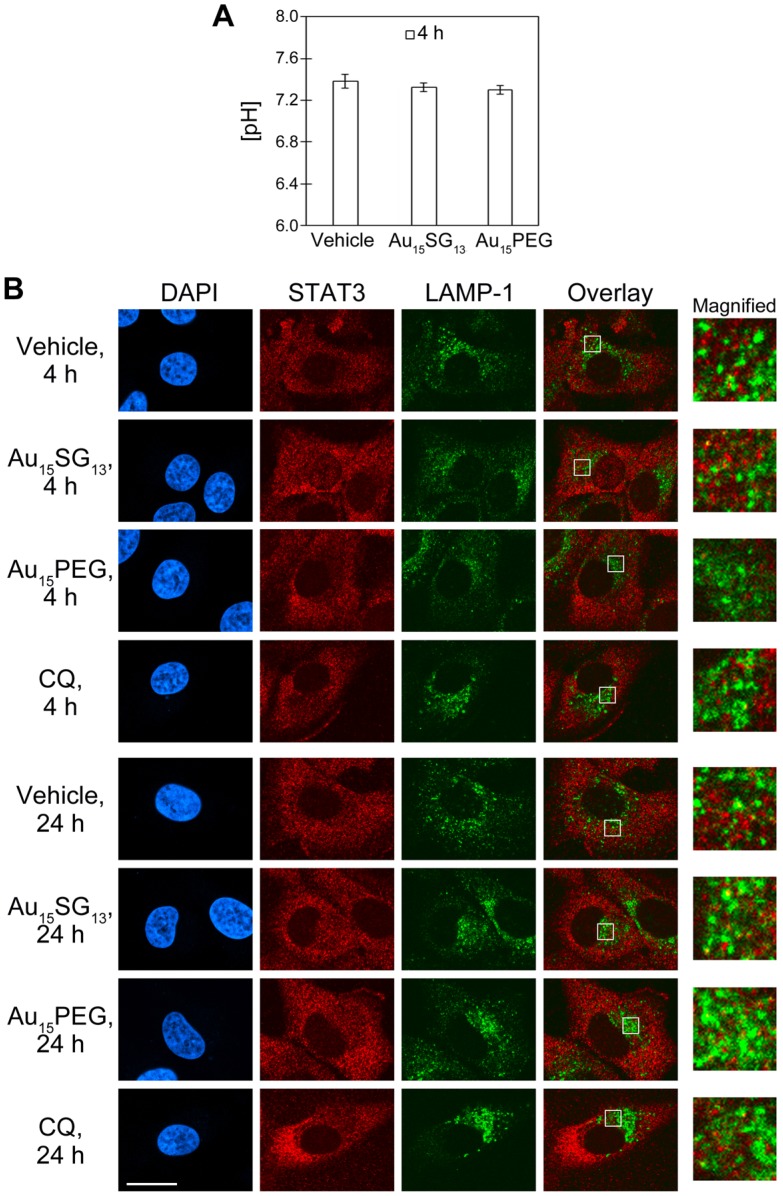
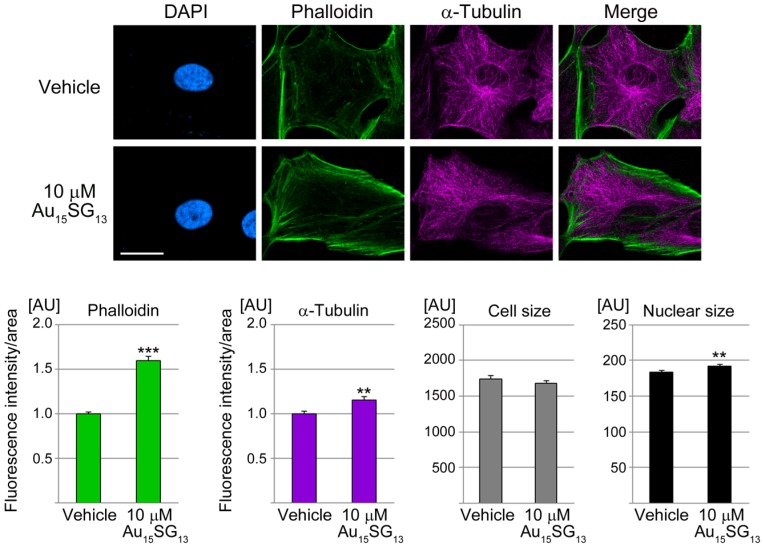
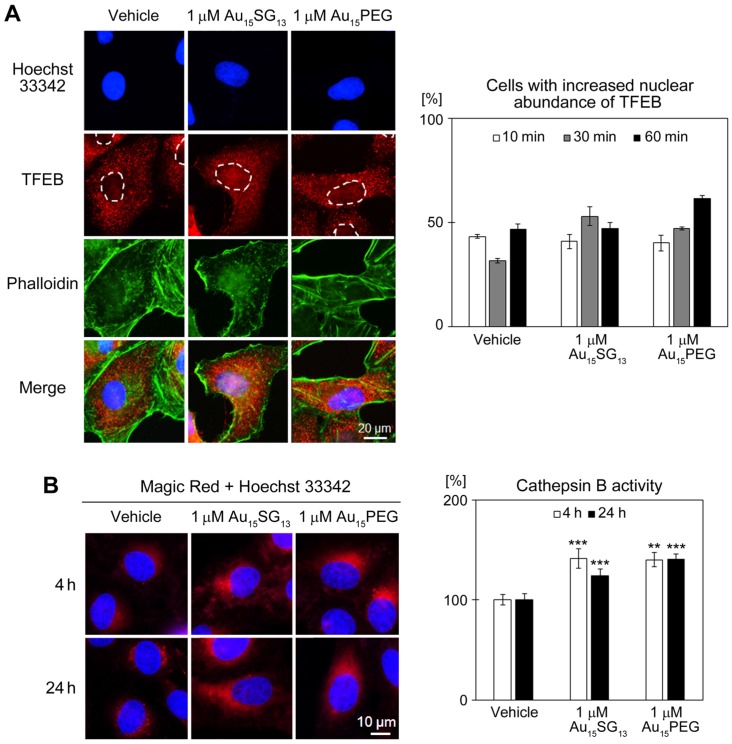
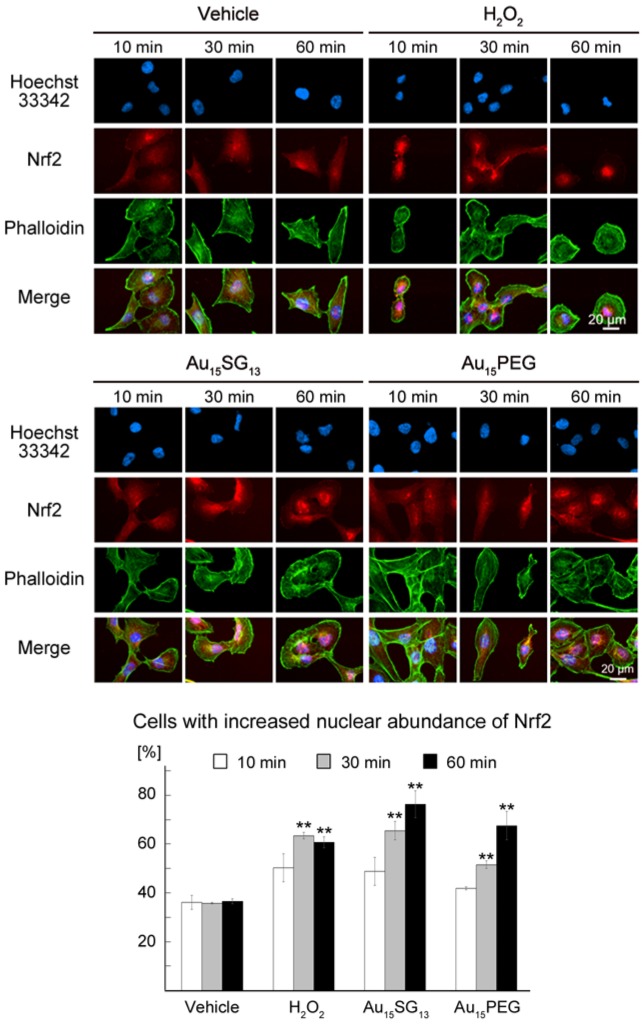
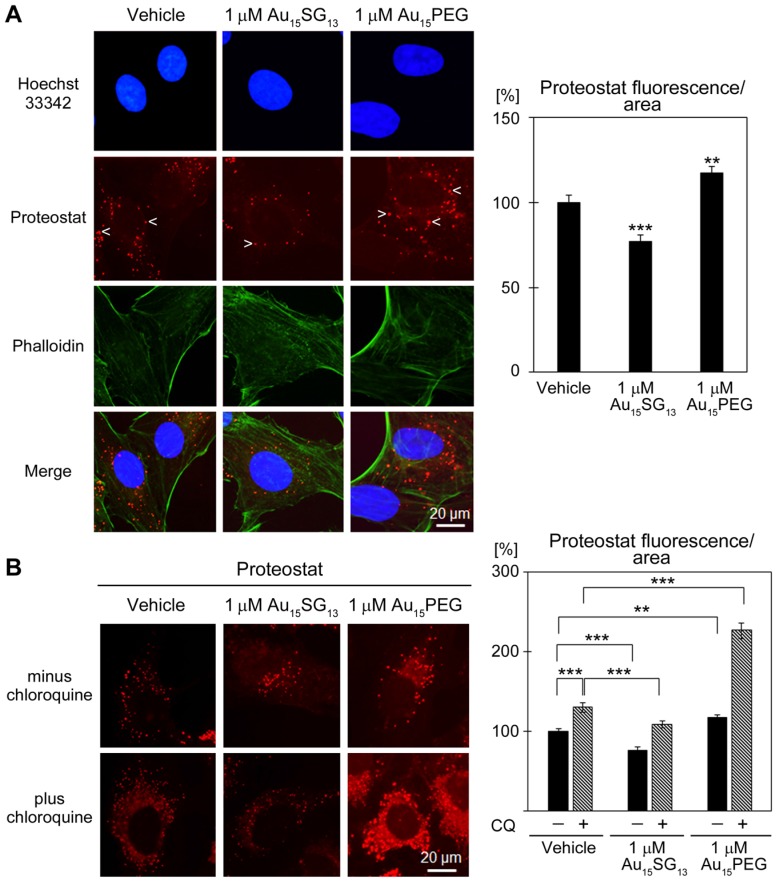
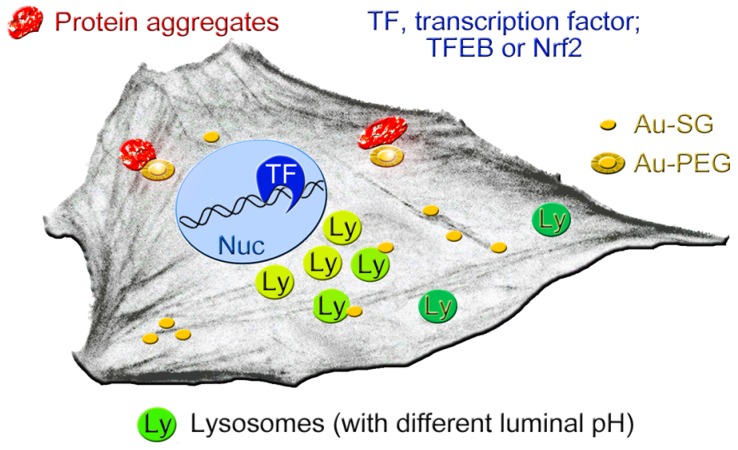
Unique physicochemical features place gold nanoclusters at the forefront of nanotechnology for biological and biomedical applications. To date, information on the interactions of gold nanoclusters with biological macromolecules is limited and restricts their use in living cells. Methods: Our multidisciplinary study begins to fill the current knowledge gap by focusing on lysosomes and associated biological pathways in U251N human glioblastoma cells. We concentrated on lysosomes, because they are the intracellular destination for many nanoparticles, regulate cellular homeostasis and control cell survival. Results: Quantitative data presented here show that gold nanoclusters (with 15 and 25 gold atoms), surface-modified with glutathione or PEG, did not diminish cell viability at concentrations ≤1 µM. However, even at sublethal concentrations, gold nanoclusters modulated the abundance, positioning, pH and enzymatic activities of lysosomes. Gold nanoclusters also affected other aspects of cellular homeostasis. Specifically, they stimulated the transient nuclear accumulation of TFEB and Nrf2, transcription factors that promote lysosome biogenesis and stress responses. Moreover, gold nanoclusters also altered the formation of protein aggregates in the cytoplasm. The cellular responses elicited by gold nanoclusters were largely reversible within a 24-hour period. Conclusions: Taken together, this study explores the subcellular and molecular effects induced by gold nanoclusters and shows their effectiveness to regulate lysosome biology. Our results indicate that gold nanoclusters cause homeostatic perturbations without marked cell loss. Notably, cells adapt to the challenge inflicted by gold nanoclusters. These new insights provide a framework for the further development of gold nanocluster-based applications in biological sciences.
Keywords: cell organelle; cellular stress response; lysosome positioning; nanomaterials; organellar pH; proteostasis.
© The author(s).
Conflict of interest statement
Competing Interests: The authors have declared that no competing interest exists.
Figures
Similar articles
-
Gold nanourchins induce cellular stress, impair proteostasis and damage RNA.Nanomedicine. 2019 Nov;22:102083. doi: 10.1016/j.nano.2019.102083. Epub 2019 Aug 9. Nanomedicine. 2019. PMID: 31404650
-
Giant Cellular Vacuoles Induced by Rare Earth Oxide Nanoparticles are Abnormally Enlarged Endo/Lysosomes and Promote mTOR-Dependent TFEB Nucleus Translocation.Small. 2016 Nov;12(41):5759-5768. doi: 10.1002/smll.201601903. Epub 2016 Sep 4. Small. 2016. PMID: 27593892
-
Organotypic and primary neural cultures as models to assess effects of different gold nanostructures on glia and neurons.Nanotoxicology. 2019 Apr;13(3):285-304. doi: 10.1080/17435390.2018.1543468. Epub 2019 Jan 29. Nanotoxicology. 2019. PMID: 30691378
-
Ultrasmall Au nanoclusters for biomedical and biosensing applications: A mini-review.Talanta. 2019 Aug 1;200:432-442. doi: 10.1016/j.talanta.2019.03.068. Epub 2019 Mar 16. Talanta. 2019. PMID: 31036206 Review.
-
Long-term effects of nanoparticles on nutrition and metabolism.Small. 2014 Sep 24;10(18):3603-11. doi: 10.1002/smll.201303635. Epub 2014 May 15. Small. 2014. PMID: 24832525 Review.
Cited by
-
The Applications of Gold Nanoparticles in the Diagnosis and Treatment of Gastrointestinal Cancer.Front Oncol. 2022 Jan 19;11:819329. doi: 10.3389/fonc.2021.819329. eCollection 2021. Front Oncol. 2022. PMID: 35127533 Free PMC article. Review.
-
Nanotherapeutic Modulation of Human Neural Cells and Glioblastoma in Organoids and Monocultures.Cells. 2020 Nov 7;9(11):2434. doi: 10.3390/cells9112434. Cells. 2020. PMID: 33171886 Free PMC article.
-
Metal Oxide Nanoparticles in Food Packaging and Their Influence on Human Health.Foods. 2023 May 3;12(9):1882. doi: 10.3390/foods12091882. Foods. 2023. PMID: 37174420 Free PMC article. Review.
-
BioGoldNCDB: A Database of Gold Nanoclusters and Related Nanoparticles with Biomedical Activity.Molecules. 2025 Aug 7;30(15):3310. doi: 10.3390/molecules30153310. Molecules. 2025. PMID: 40807485 Free PMC article. Review.
-
Adaptive changes induced by noble-metal nanostructures in vitro and in vivo.Theranostics. 2020 Apr 27;10(13):5649-5670. doi: 10.7150/thno.42569. eCollection 2020. Theranostics. 2020. PMID: 32483410 Free PMC article. Review.
References
-
- Nandi S, Ghosh S, Bhattacharyya K. Live Cell Microscopy: A Physical Chemistry Approach. J Phys Chem B. 2018;122:3023–36. - PubMed
-
- Vankayala R, Kuo C-L, Nuthalapati K, Chiang C-S, Hwang KC. Nucleus-Targeting Gold Nanoclusters for Simultaneous In Vivo Fluorescence Imaging, Gene Delivery, and NIR-Light Activated Photodynamic Therapy. Adv Funct Mater. 2015;25:5934–45.
-
- Jin R, Zeng C, Zhou M, Chen Y. Atomically Precise Colloidal Metal Nanoclusters and Nanoparticles: Fundamentals and Opportunities. Chem Rev. 2016;116:10346–413. - PubMed
-
- Su Y, Xue T, Liu Y, Qi J, Jin R, Lin Z. Luminescent metal nanoclusters for biomedical applications. Nano Research. 2019;12:1251–65.
-
- Zheng Y, Lai L, Liu W, Jiang H, Wang X. Recent advances in biomedical applications of fluorescent gold nanoclusters. Adv Colloid Interface Sci. 2017;242:1–16. - PubMed
Publication types
MeSH terms
Substances
LinkOut - more resources
Full Text Sources
Miscellaneous
