. 2020 Jan 1;10(4):1649-1677.
doi: 10.7150/thno.40919. eCollection 2020.

Nerve growth factor activates autophagy in Schwann cells to enhance myelin debris clearance and to expedite nerve regeneration

Affiliations

Nerve growth factor activates autophagy in Schwann cells to enhance myelin debris clearance and to expedite nerve regeneration

Rui Li et al. Theranostics. .

Abstract

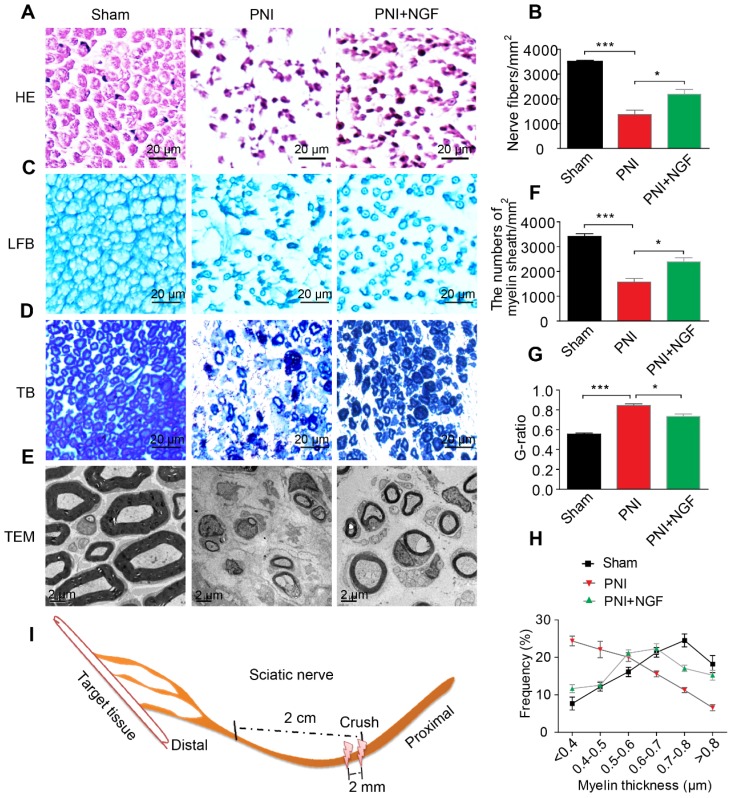
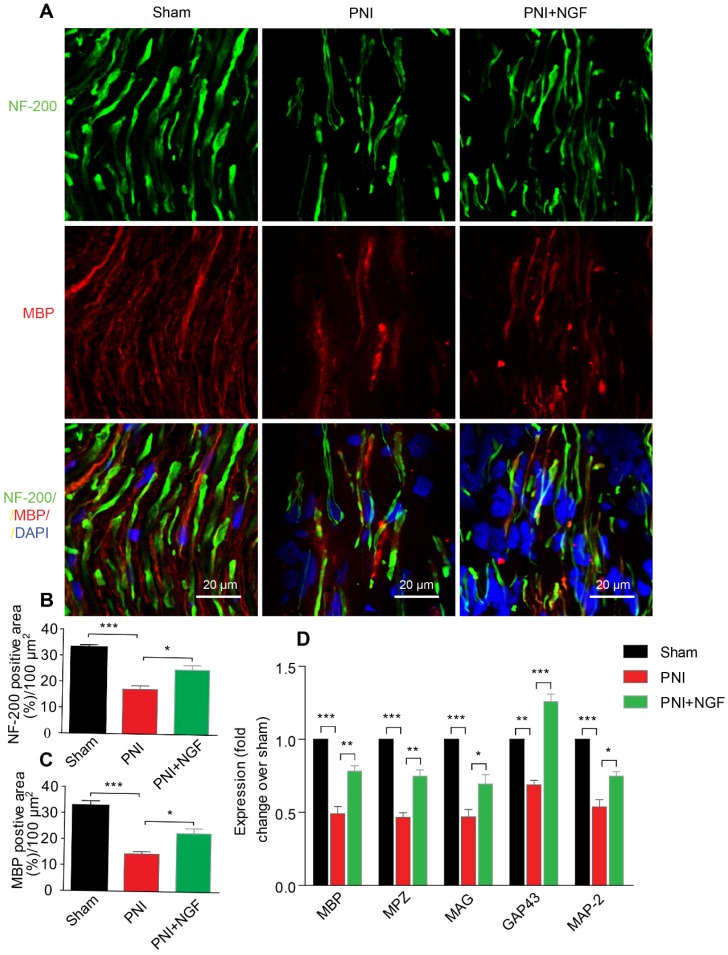
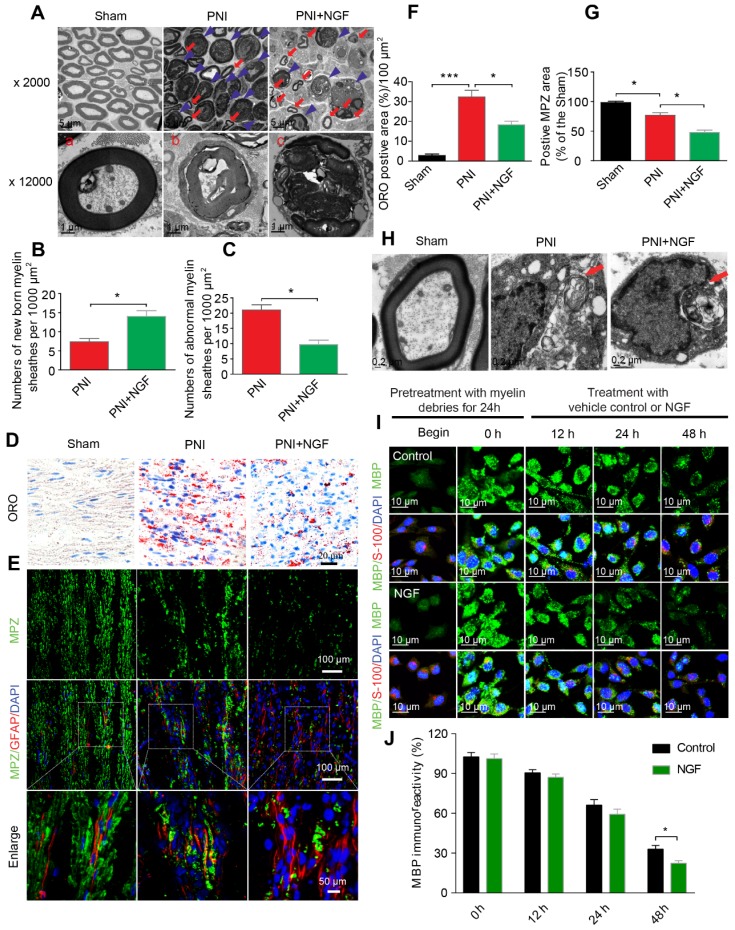
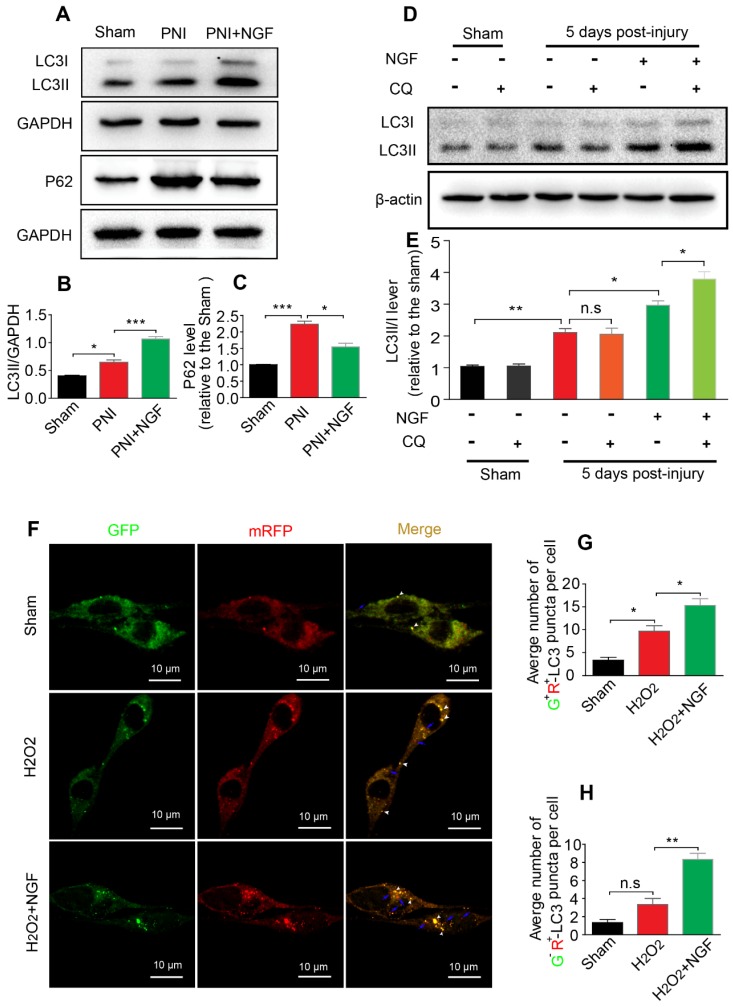
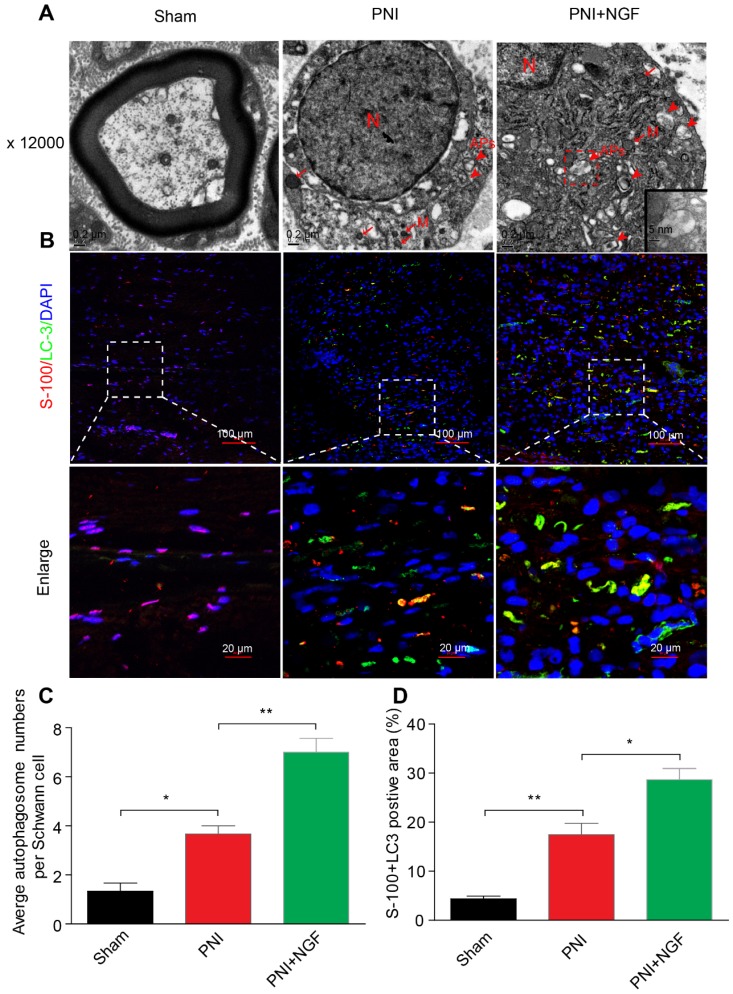
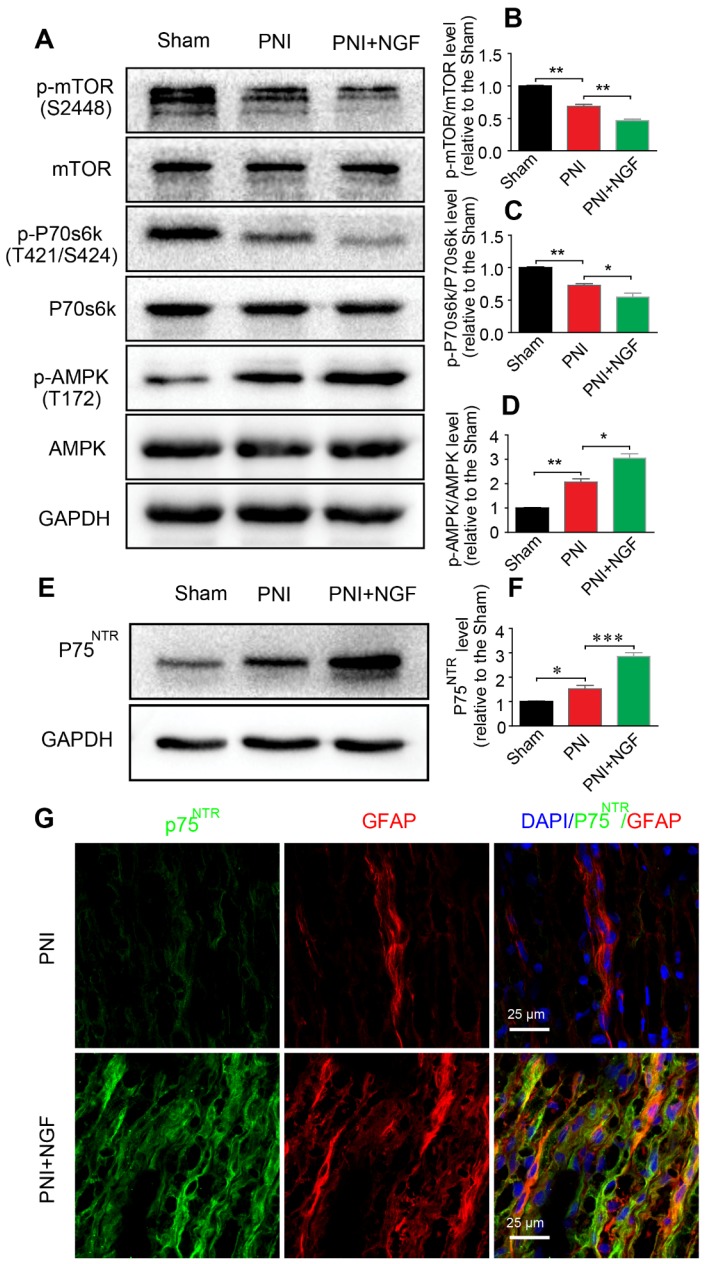
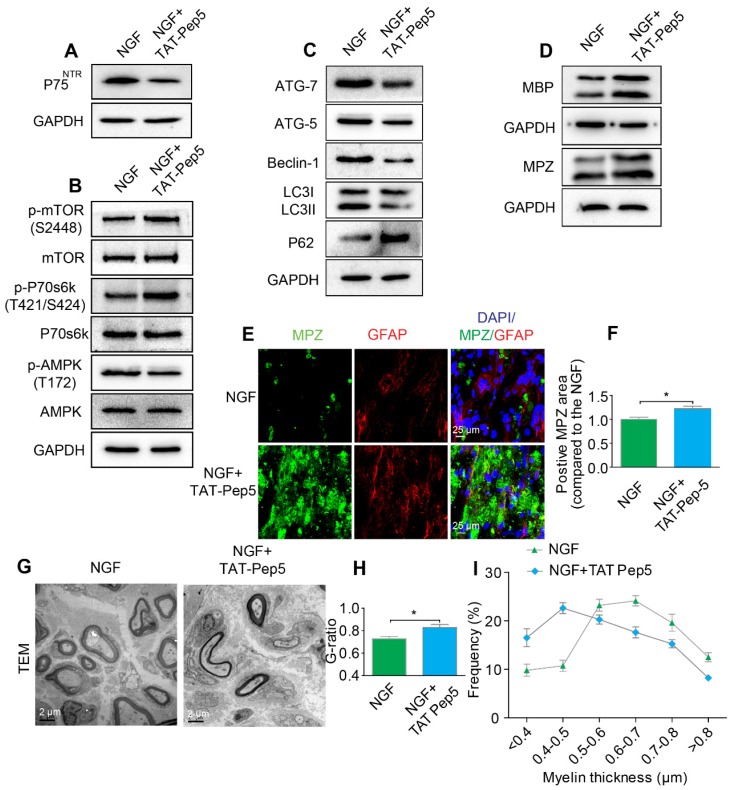
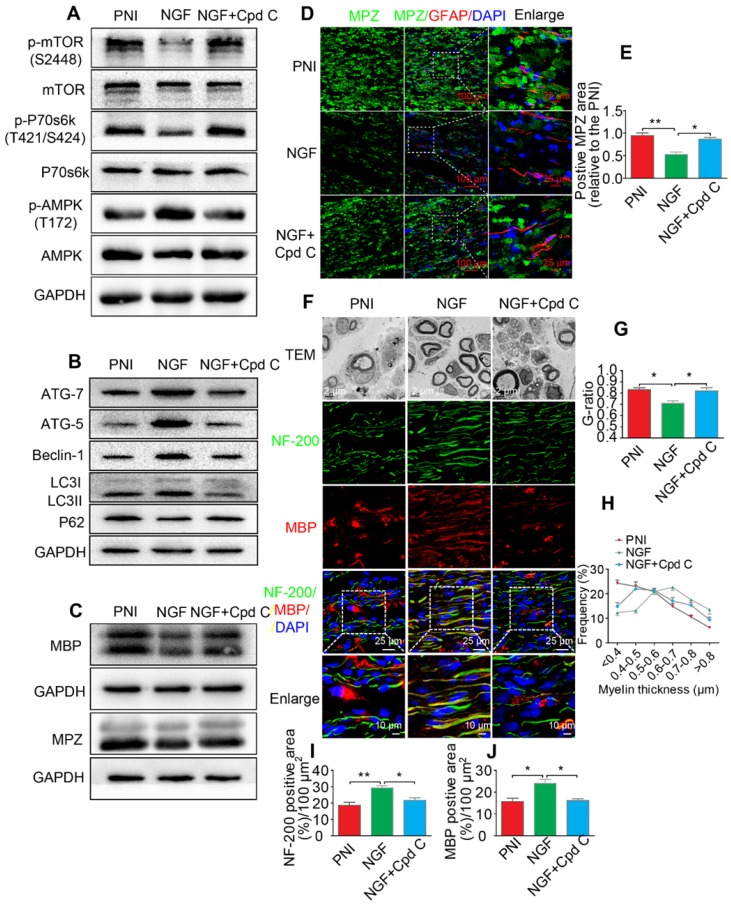
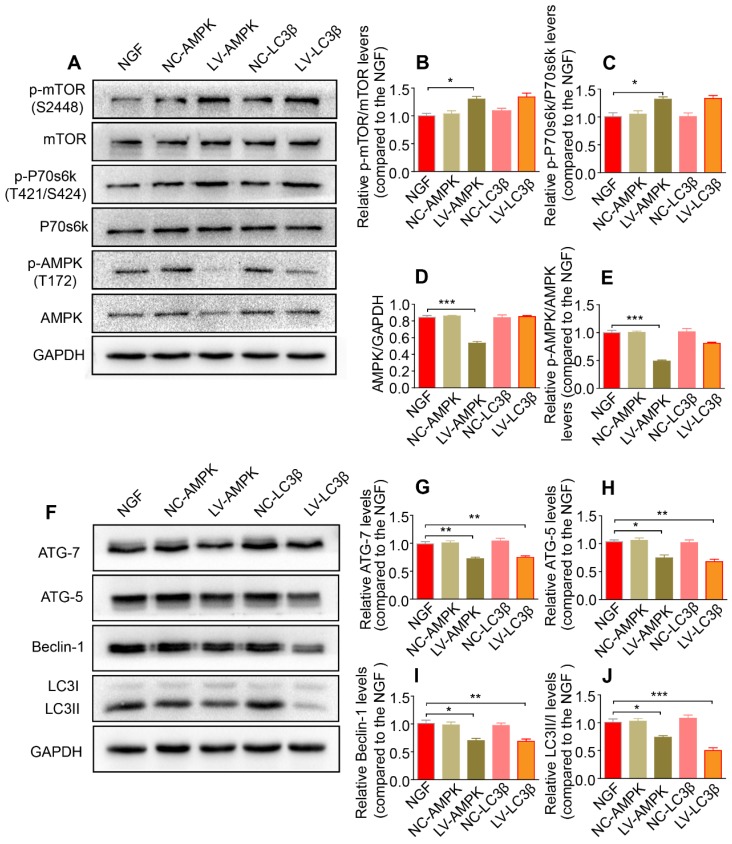
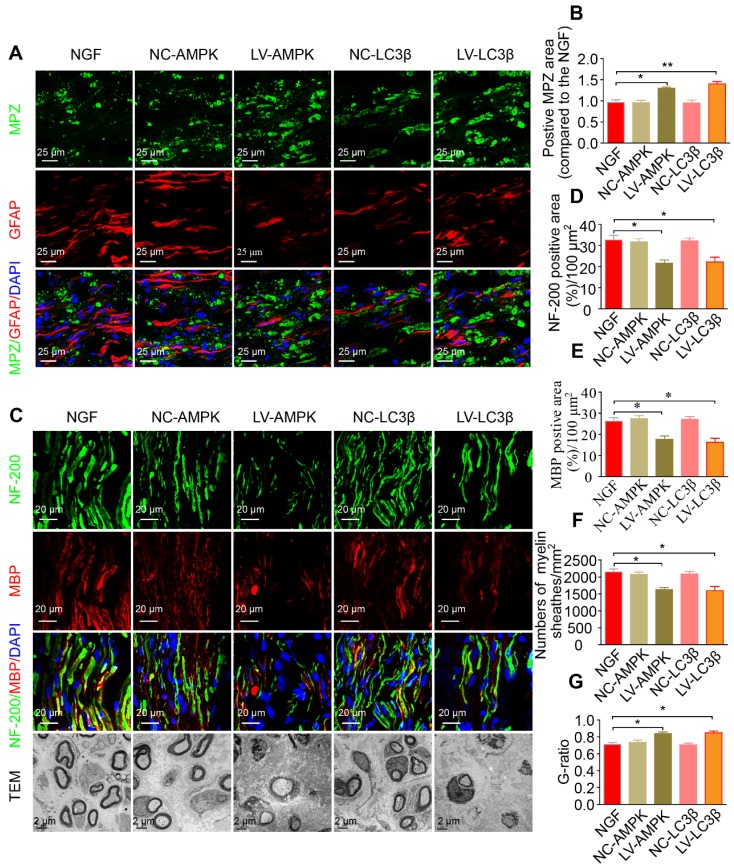
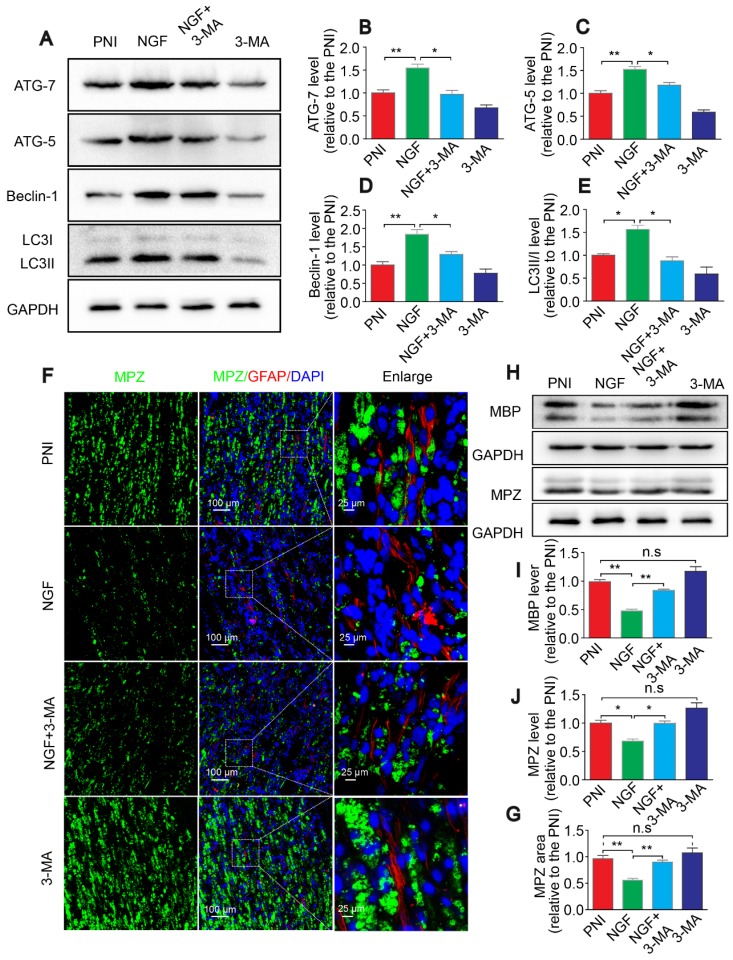
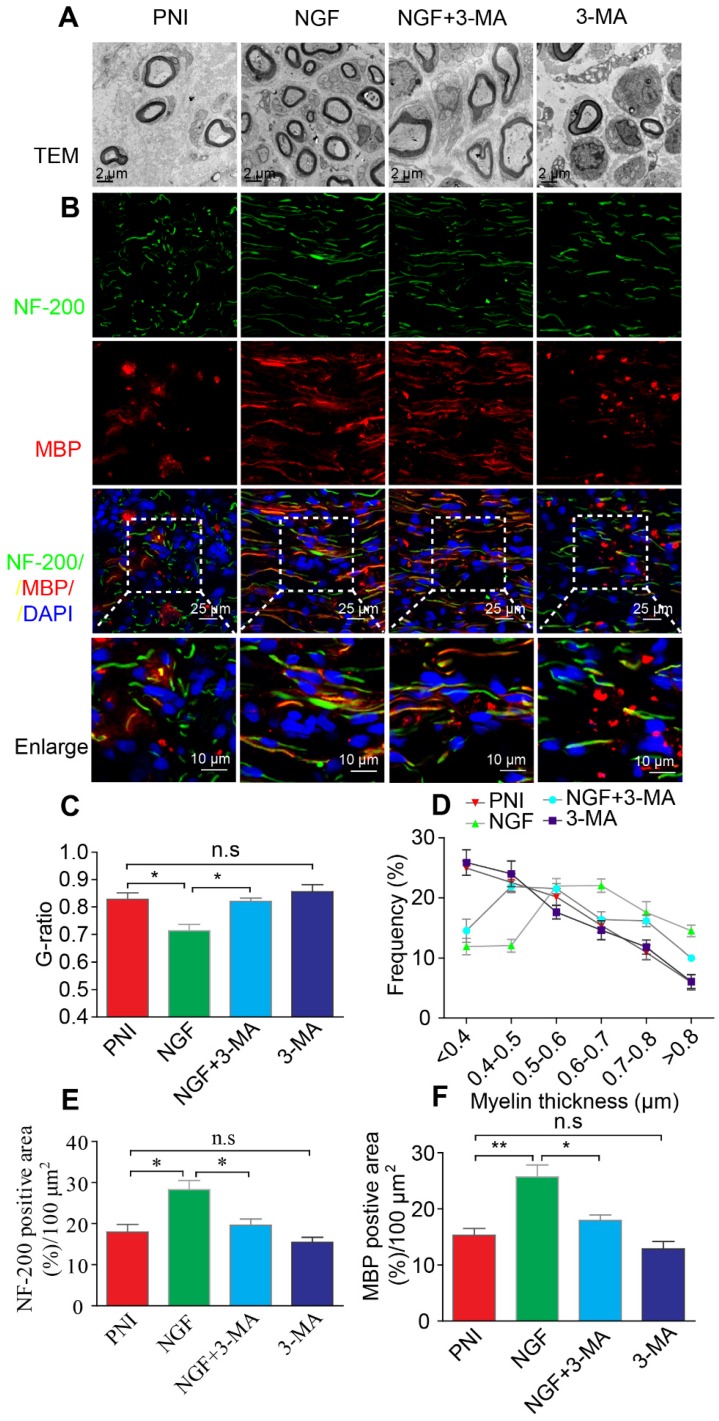
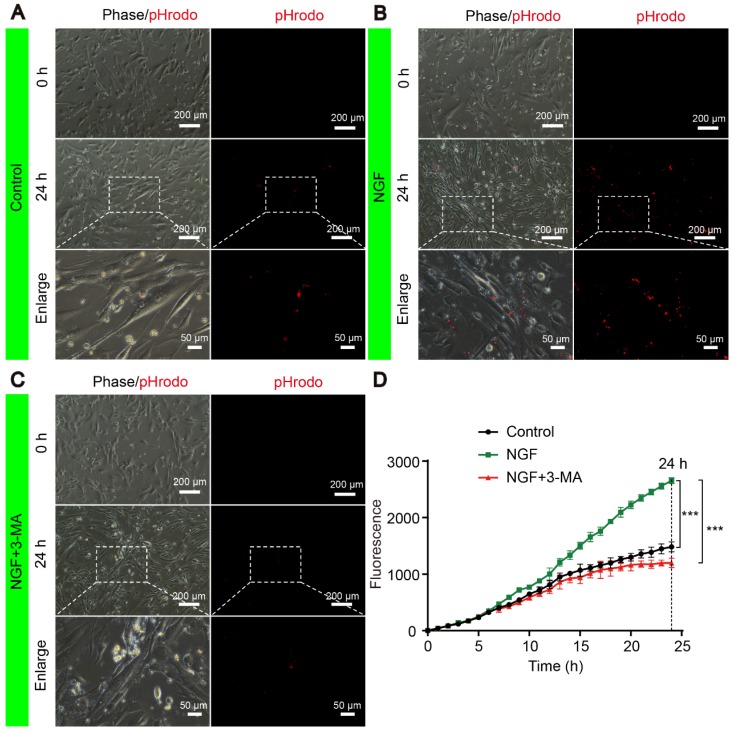
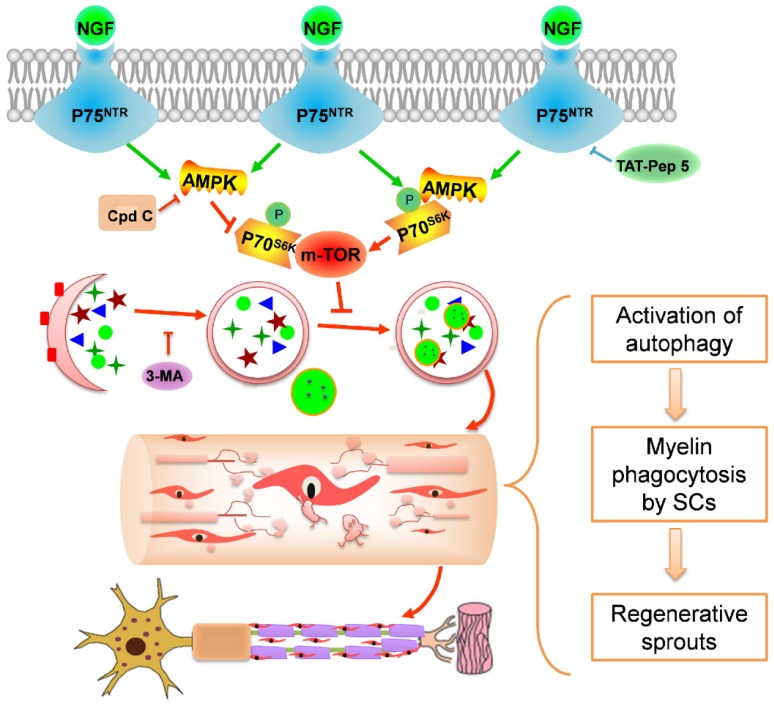
Rationale: Autophagy in Schwann cells (SCs) is crucial for myelin debris degradation and clearance following peripheral nerve injury (PNI). Nerve growth factor (NGF) plays an important role in reconstructing peripheral nerve fibers and promoting axonal regeneration. However, it remains unclear if NGF effect in enhancing nerve regeneration is mediated through autophagic clearance of myelin debris in SCs. Methods: In vivo, free NGF solution plus with/without pharmacological inhibitors were administered to a rat sciatic nerve crush injury model. In vitro, the primary Schwann cells (SCs) and its cell line were cultured in normal medium containing NGF, their capable of swallowing or clearing degenerated myelin was evaluated through supplement of homogenized myelin fractions. Results: Administration of exogenous NGF could activate autophagy in dedifferentiated SCs, accelerate myelin debris clearance and phagocytosis, as well as promote axon and myelin regeneration at early stage of PNI. These NGF effects were effectively blocked by autophagy inhibitors. In addition, inhibition of the p75 kD neurotrophin receptor (p75NTR) signal or inactivation of the AMP-activated protein kinase (AMPK) also inhibited the NGF effect as well. Conclusions: NGF effect on promoting early nerve regeneration is closely associated with its accelerating autophagic clearance of myelin debris in SCs, which probably regulated by the p75NTR/AMPK/mTOR axis. Our studies thus provide strong support that NGF may serve as a powerful pharmacological therapy for peripheral nerve injuries.

Keywords: Autophagic flux; Myelin debris clearance; Nerve growth factor (NGF); Nerve regeneration; Schwann cells.


Conflict of interest statement

Competing Interests: The authors have declared that no competing interest exists.

Figures

Figure 1
Figure 1
NGF expedites axon regeneration and remyelination after PNI. (A) Representative HE staining images of sciatic nerve lesion cross-sections from the sham, PNI model, and PNI+NGF groups at 14 days following injury. (B) Statistical analysis of the number of nerve fibers in each group. Data are presented as the mean ± SEM; n = 3 rats per group. Nerve fibers: F(2, 6) = 44.74, ***Psham vs PNI < 0.001, *PPNI vs PNI+NGF = 0.042. (C-E) Transverse higher-magnification images of sciatic nerves in the three groups. FBL, TB and electron micrographs were also used to evaluate myelin regeneration at 14 days after surgery. Scale bars represent 20 µm (FBL and TB) and 2 µm (TEM). (F) The number of myelin sheaths per 1 mm2 in the three groups. Data are presented as the mean ± SEM; n = 3 rats per group. F(2, 6) = 41.80, ***Psham vs PNI < 0.001, *PPNI vs PNI+NGF = 0.035. (G) Quantification of the G-ratio in the three groups. Data are presented as the mean ± SEM; n = 3 rats per group. F(2, 6) = 59.26, ***Psham vs PNI < 0.001, *PPNI vs PNI+NGF = 0.037. (H) Quantification of the frequency distribution profile of the thickness of myelin sheaths. (I) A schematic showing the nerve segments collected in each group.
Figure 2
Figure 2
NGF enhances neuronal regrowth following PNI. (A) A representative micrograph of NF-200 (green) and MBP (red) immunofluorescence in each group. DAPI: nuclear staining (blue). (B, C) Quantification of NF-200 and MBP-positive areas per 100 µm2 in each group. Data are presented as the mean ± SEM; n = 4 rats per group. MBP: F(2, 9) = 29.77, ***Psham vs PNI < 0.001, *PPNI vs PNI+NGF = 0.019; NF-200: F(2, 9) = 31.01, ***Psham vs PNI < 0.001, *PPNI vs PNI+NGF = 0.018. (D) RT-PCR analysis of the expression of myelinated and functional response genes in the lesion nerve treated with/without NGF at 14 days post-injury. Data are presented as the mean ± SEM. n = 3 independent experiments. MBP F(2, 6) = 49.51, ***Psham vs PNI < 0.001, **PPNI vs PNI+NGF = 0.0091; MPZ F(2, 6) = 76.08, ***Psham vs PNI < 0.001, **PPNI vs PNI+NGF = 0.0062; MAG F(2, 6) = 33.03, ***Psham vs PNI < 0.001, *PPNI vs PNI+NGF = 0.048; GAP43 F(2, 6) = 69.15, **Psham vs PNI = 0.0043, ***PPNI vs PNI+NGF < 0.001; MAP-2: F(2, 6) = 46.07, ***Psham vs PNI < 0.001, *PPNI vs PNI+NGF = 0.024.
Figure 3
Figure 3
NGF accelerates SC-dependent myelin degradation. (A) Electron micrographs of sciatic nerve cross sections at day 5 post-injury in the sham, PNI and PNI+NGF groups. The images represent morphological profiles of myelin in each group. The magnified images below show single typical normal myelin (a), demyelinated or degenerative myelin (b), and disintegrating myelin (c). The abnormal myelin includes b and c. (B, C) Quantification of the numbers of newborn and abnormal myelin sheaths per 1000 μm2 in the PNI and PNI+NGF groups. Data are presented as the mean ± SEM; n = 5 rats per group. Newborn myelin: *PPNI vs PNI+NGF = 0.019, t = 3.780, d.f. = 8; Abnormal myelin: *PPNI vs PNI+NGF = 0.015, t = 5.013, d.f. = 8. (D) Staining of myelin debris with ORO was performed on sciatic nerve longitudinal sections from the three groups at 5 days post-injury. (E) Immunofluorescence images showing MPZ (green) and GFAP (red) in sciatic nerve sections taken from each group at 5 days post-injury. Nuclei were labeled with DAPI (blue). (F) Quantitative results showing the ORO-positive area per 100 μm2 from (D). Data are the mean values ± SEM; n = 3 rats per group. F(2, 6) = 50.66, ***Psham vs PNI < 0.001, *PPNI vs PNI+NGF = 0.021. (G) Quantification of MPZ-positive area (%) in each sciatic nerve tissue sample. Data are the mean values ± SEM; n = 3 rats per group. F(2, 6) = 48.35, *Psham versus PNI = 0.020, *PPNI vs PNI+NGF = 0.015. (H) Electron micrograph showing the presence of a fragmented myelin (red arrows)-containing Schwann cell cytoplasmic pocket in the PNI and PNI+NGF groups and a normal myelin in the sham group. (I) Double-immunostaining showing MPZ+ myelin inclusions and S-100 markers for SCs in normal cultured RSC96 cells (begin). 24 h after incubation with myelin debris, 50 ng/mL NGF was added to the culture medium (0 h) and incubated for 12 h, 24 h and 48 h, respectively. (J) Quantitation of MBP immunoreactivity (relative to 0 h) at different time points in group control and NGF. Data are the mean values ± SEM; n = 3 independent experiments with a minimum of 6 picture frames analyzed per time point/group/experiment. T = 48 h *PNGF versus control = 0.036, t = 3.113, d.f. = 4.
Figure 4
Figure 4
NGF increases the level of autophagy in nerve lesions at day 5 after injury. (A) Western blotting analysis of ATG-7, ATG-5, Beclin-1 and LC3 in sham, PNI and PNI+NGF groups at 5 days post crush. (B-E) Quantification of autophagy-related proteins expressed in (A). GAPDH was set as a loading control. Data are presented as the mean ± SEM; n = 3 or 4 independent experiments. ATG-7 F(2, 6) = 32.47, **Psham vs PNI = 0.006, *PPNI vs PNI+NGF = 0.036; ATG-5 F(2, 6) = 20.90, *Psham vs PNI = 0.032, *PPNI vs PNI+NGF = 0.041; Beclin-1 F(2, 6) = 29.82, *Psham vs PNI = 0.027, *PPNI vs PNI+NGF = 0.039; LC3II/I F(2, 9) =55.81, **Psham vs PNI = 0.0084, *P = 0.031. (F, G) Representative images of LC3 (green) immunostaining and quantitative analysis of the average LC3 positive area in each group. n = 3 rats per group, and the results are shown as the mean ± SEM. F(2, 6) = 61.36, **Psham vs PNI = 0.0072, *PPNI vs PNI+NGF = 0.041.
Figure 5
Figure 5
NGF drives autophagic flux following injury in vivo and in vitro. (A-C) Representative Western blotting and densitometric analysis of LC3II and P-62/SQSTM1 in the sham, PNI and PNI+NGF groups at 5 days post injury. Data are presented as the mean ± SEM; n = 3 independent experiments. LC3II F(2, 6) = 81.92, *Psham vs PNI = 0.036, ***PPNI vs PNI+NGF < 0.001; P62 F(2, 6) = 53.43, ***Psham vs PNI < 0.001, *PPNI vs PNI+NGF = 0.018. (D, E) LC3 expression and optical density analysis in normal or injured nerves treated with NGF or CQ. β-actin was used as the loading control and for normalization. Data are the mean values ± SEM, n= 3 independent experiments. F(5, 12) = 75.19, *P PNI+NGF vs PNI+NGF+CQ = 0.036, PPNI vs PNI+CQ = 0.96 (n.s), **Psham vs PNI = 0.0051, *PPNI vs PNI+NGF = 0.042. (F) After stably transfected with tandem-labeled mRFP-GFP-LC3 for 24 h, RSC 96 cell lines were incubated with H2O2 (100 μM) with or without NGF for another 4 h. Representative images of mRFP-GFP-LC3 vector were shown by fluorescent detection. (G, H) Quantitative analysis of the number of yellow (G+R+) autophagosomes and red (G-R+) autolysosomes. Data are the mean values ± SEM; Autophagosme F(2, 6) = 27.03, *Psham versus PNI = 0.014, *PPNI versus PNI+NGF = 0.020; Autophagolysome F(2, 6) = 39.00, Psham versus PNI = 0.085 (n. s), **PPNI versus PNI+NGF = 0.0023.
Figure 6
Figure 6
NGF mediates the enhancement of autophagy in SCs. (A) Transmission electronic microscopy images show numerous autophagosomes in the sham, PNI and PNI+NGF groups on postoperative day 5. APs: autophagosome (arrowheads); M: mitochondria (arrow); N: nucleus. The autophagosome is shown at high magnification in the inset. (B) Double immunofluorescence staining of LC3 protein (green) with S-100 positive dots (red) was detected in all groups at P5. Nuclei are counterstained with DAPI (blue). (C) Qualitative analysis of the average number of autophagosomes per Schwann cell from (A). Data are presented as the mean ± SEM; n = 5 rats per group. F(2, 12) = 43.80, *Psham vs PNI = 0.015, **PPNI vs PNI+NGF = 0.0082. (D) Quantification of the percent of S-100 colocalization with LC3 in the lesion area of sciatic nerves from (B). Data are presented as the mean ± SEM; n = 3 rats per group. F(2, 6) = 40.08, **Psham vs PNI = 0.0074, *PPNI vs PNI+NGF = 0.038.
Figure 7
Figure 7
NGF activates autophagy in SCs via the p75NTR/AMPK/mTOR pathway. (A) Protein expression of p-AMPK (T172), AMPK, p-mTOR (S2448), mTOR, p-p70s6k (T421/S424), p70s6k in the sham, PNI model and PNI+NGF groups at 5 days post-injury; (B-D) Quantitative analysis of the p-AMPK/AMPK, p-p70s6k/p70s6k and p-mTOR/mTOR protein in each group. Data are presented as the mean ± SEM; n = 3 independent experiments. p-mTOR/mTOR F(2, 6) = 134.50, **Psham vs PNI = 0.0051, **PPNI vs PNI+NGF = 0.0079; p-p70s6k/p70s6k F(2, 6) = 34.06, **Psham vs PNI = 0.0054, *PPNI vs PNI+NGF = 0.042; p-AMPK/AMPK F(2, 6) = 57.27, **Psham vs PNI = 0.0073, *PPNI vs PNI+NGF = 0.025. (E, F) Immunoblots and quantification of p75NTR. Data are presented as the mean ± SEM; n = 5 independent experiments. P75NTR F(2, 12) = 62.17, *Psham vs PNI = 0.035, ***PPNI vs PNI+NGF < 0.001. (G) Immunostaining of frozen sciatic nerve sections of the PNI and PNI+NGF groups with anti-GFAP (red) and anti-p75NTR (green) antibodies. Nuclei were counter-stained with DAPI (blue).
Figure 8
Figure 8
Inhibition of p75NTR reduces NGF-medicated autophagy and delays myelin clearance and axonal remyelination after sciatic nerve crush injury. (A) Western blots of p75NGF in the NGF and NGF+TAT-Pep 5 groups 5 days after injury. (B) Changes in the p-AMPK/AMPK, p-p70s6k/p70s6k and p-mTOR/mTOR ratios in each injured nerve. (C) Immunoblotting and quantitative analysis of ATG-7, ATG-5, Beclin-1 P62 and LC3 in the two groups. (D) The protein expression of MBP and MPZ in each group at 5 days post-injury. Quantitative analysis and statistical difference of western blotting results in these two groups were listed in table 2. Data are the mean values ± SEM; n = 3 or 4 independent experiments. (E, F) Immunofluorescence images and quantification of MPZ and GFAP signals in ipsilateral nerves 5 days after injury in NGF or NGF+TAT-Pep treatment rats. Data are the mean values ± SEM; n = 3 rats per group. MPZ *PNGF vs NGF+TAT-Pep5 = 0.043, t = 3.205, d.f. = 4. (G) Representative TEM images of 14 day sections in each experimental group. Scale bar: 20 μm (HE), 2 μm (TEM) and 25 μm (Immunofluorescence). (H-I) Quantification of the distribution of myelin thickness, G-ratio. Data are represented as the means ± SEM; n = 3 rats per group. G-ratio *PNGF vs NGF+TAT-Pep5 = 0.043, t = 2.938, d.f. = 4.
Figure 9
Figure 9
Inhibition of AMPK significantly attenuates NGF-induced autophagic activities, myelin clearance and neural regeneration. (A) The ratios of p-AMPK/AMPK, p-p70s6k/p70s6k and p-mTOR/mTOR were evaluated by western blotting in PNI, NGF and NGF+Cpd C rat sciatic nerve tissue lysates at 5 days post-injury. (B) Autophagy related proteins expression (including ATG-7, ATG-5, Beclin-1 P62 and LC3) were detected through western blotting. (C) Representative immunoblots for MBP and MPZ in each group of rats. Quantitative data and statistical analysis of western blotting results in these three groups were showed in table 3. Data are presented as the mean ± SEM; n = 3 or 4 independent experiments. (D, E) Co-immunofluorescence images and quantification showing MPZ (green) and GFAP (red) in injured sciatic nerve at day 5. Nuclei are blue (DAPI). Original scale bar = 100 µm and close-up scale bar = 25 µm. Data are presented as the mean ± SEM; n = 3 rats per group. MPZ F(2, 6) = 18.89, **PPNI vs NGF = 0.0053, *PNGF vs NGF+Cpd C = 0.015. (F) TEM images and double staining for MBP (red)/NF-200 (green) of sections from the injured sciatic nerve in each rat group at 14 days post-injury. Nuclei are blue (DAPI). (G-J) Analysis of G-ratio, myelin thickness distribution, and NF-200- and MBP- positive staining in each group. Data are presented as the mean ± SEM; n = 3 rats per group. G-ratio F(2, 6) = 8.64, *PPNI vs NGF = 0.043, *PNGF vs NGF+Cpd C = 0.045; NF-200 F(2, 6) = 11.89, **PPNI vs NGF = 0.0078, *PNGF vs NGF+Cpd C = 0.034; MBP F(2, 6) = 10.08, *PPNI vs NGF = 0.041, *PNGF vs NGF+Cpd C = 0.043.
Figure 10
Figure 10
Reducing AMPK or LC3 expression significantly inhibits the autophagy and its upstream signaling activation. (A-E) Representative immunoblots of p-AMPK, AMPK, p-p70s6k, p70s6k, p-mTOR and mTOR in NGF therapeutic rats infected with/without LV-AMPK-RNAi/LV-NCAMPK-RNAi or LV-LC3β-RNAi/LV-NCLC3β-RNAi and quantification of these data. Data are the mean values ± SEM; n = 3 independent experiments. p-mTOR/mTOR F(4, 10) = 7.99, *PNGF vs LV-AMPK = 0.011; p-p70s6k/p70s6k F(4, 10) = 8.30, *PNGF vs LV-AMPK = 0.019; AMPK/GAPDH F(4, 10) = 44.48, ***PNGF vs LV-AMPK < 0.001; p-AMPK/AMPK F(4, 10) = 41.67, ***PNGF vs LV-AMPK < 0.001. (F-J) Autophagy related proteins (including ATG-7, ATG-5, Beclin-1 and LC3) were detected by western blotting and quantified their expression in those five groups. Data are presented as mean ± SEM; n = 3 independent experiments. ATG-7 F(4, 10) = 17.48, **PNGF vs LV-AMPK = 0.0054, **PNGF vs LV-LC3β = 0.0070; ATG-5 F(4, 10) = 16.48, *PNGF vs LV-AMPK = 0.017, **PNGF vs LV-LC3β = 0.0028; Beclin-1 F(4, 10) = 11.56, *PNGF vs LV-AMPK = 0.011, **PNGF vs LV-LC3β = 0.0092; LC3II/I F(4, 10) = 24.59, *PNGF vs LV-AMPK = 0.016, ***PNGF vs LV-LC3β < 0.0001.
Figure 11
Figure 11
RNAi-mediated knocking-down of AMPK impairs myelin degradation, axonal regeneration and remyelination. (A) Co-immunostaining with anti-MPZ (green) and anti-GFAP (red) antibodies in injured sciatic nerve at day 5. Nuclei were blue (DAPI). (B) The positive MPZ areas in each group were calculated. Data are presented as mean ± SEM; n = 3 rats per group. MPZ F(4, 10) = 12.23, *PNGF vs LV-AMPK = 0.020, **PNGF vs LV-LC3β = 0.0087. (C) Double-immunostaining for MBP (red)/NF-200 (green) and TEM images of sections from the injured sciatic nerve in each group rats at 14 days. Nuclei were blue (DAPI). (D-G) Analysis of NF-200 and MBP positive staining, numbers of myelin sheaths and G-ratio in each group. Data are presented as mean ± SEM; n = 3 rats per group. NF-200 F(4, 10) = 9.77, *PNGF vs LV-AMPK = 0.015, *PNGF vs LV-LC3β = 0.030; MBP F(4, 10) = 12.23, *PNGF vs LV-AMPK = 0.020, *PNGF vs LV-LC3β = 0.017; myelin numbers F(4, 10) = 9.48, *PNGF vs LV-AMPK = 0.014, *PNGF vs LV-LC3β = 0.022; G-ratio F(4, 10) = 10.45, *PNGF vs LV-AMPK = 0.013, *PNGF vs LV-LC3β = 0.017. Significance was determined with the unpaired t-test with Welch's correction.
Figure 12
Figure 12
Autophagy inhibition delays myelin degradation. (A-E) Representative immunoblots and quantification of ATG-7, ATG-5, Beclin-1 and LC3 from sciatic nerves of the PNI, NGF, NGF+3-MA and 3-MA groups at 5 days post crush. Data are presented as the mean ± SEM; n = 3 independent experiments. ATG-7 F(3, 8) = 22.16, **PPNI vs NGF = 0.0076, *PNGF vs NGF+3-MA = 0.019; ATG-5 F(3, 8) = 46.66, **PPNI vs NGF = 0.0036, *PNGF vs NGF+3-MA = 0.027; Beclin-1 F(3, 8) = 18.80, **PPNI vs NGF = 0.0075, *PNGF vs NGF+3-MA = 0.038; LC3II/I F(3, 8) = 16.85, *PPNI vs NGF = 0.039, *PNGF vs NGF+3-MA = 0.012. (F, G) Representative micrographs showing double immunofluorescence with MPZ (green) and GFAP (red). Nuclei are stained with DAPI (blue) in each group. Quantitation of the MPZ positive area is also shown. Data are presented as the mean ± SEM; n = 3 rats per group. F(3, 8) = 13.37, **PPNI vs NGF = 0.0057, **PNGF vs NGF+3-MA = 0.0054, PPNI vs 3-MA = 0.39 (n.s). (H-J) MBP and MPZ protein levels and quantitative analysis. Data are presented as the mean ± SEM; n = 3 independent experiments. MBP F(3, 8) = 44.72, **PPNI vs NGF = 0.0074, **PNGF vs NGF+3-MA = 0.0056, PPNI vs 3-MA = 0.11 (n.s); MPZ F(3, 8) = 31.98, *PPNI vs NGF = 0.036, *PNGF vs NGF+3-MA = 0.012, PPNI vs 3-MA = 0.090 (n.s).
Figure 13
Figure 13
Autophagy inhibition suppresses nerve regeneration. (A, B) Electron micrographs and co-immunofluorescence of NF-200 (green) and MBP (red) analysis were performed in the four groups at 14 days after PNI. Nuclei are stained with DAPI (blue). (C-F) Statistical analysis of the G-ratio, distribution of myelin thickness, and NF-200 and MBP positive staining areas on the proximal nerve lesions in each group. Data are presented as the mean ± SEM; n = 3 rats per group. G-ratio F(3, 8) = 8.23, *PPNI vs NGF = 0.039, *PNGF vs NGF+3-MA = 0.040, PPNI vs 3-MA = 0.49 (n.s); NF-200 F(3, 8) = 10.17, *PPNI vs NGF = 0.042, *PNGF vs NGF+3-MA = 0.048, PPNI vs 3-MA = 0.35 (n.s); MBP F(3, 8) = 13.91, **PPNI vs NGF = 0.005, *PNGF vs NGF+3-MA = 0.039, PPNI vs 3-MA = 0.058 (n.s).
Figure 14
Figure 14
NGF enhances myelin phagocytosis in primary Schwann cells. (A-C) Cells were purchased and cultured as described in Materials and Methods. Cells were treated with either vehicle control (A), or 50 ng mL-1 NGF (B) or 50 ng mL-1 NGF for 6 hrs followed by the addition of 3-MA (C). Representative phase and fluorescent images of primary SCs at 0 h and 24 h for each condition are shown. An magnified inset for each treatment group is also presented to show the pHrodo-labeled myelin debris were inside of primary SCs. (D) The signals of integrated fluorescence intensity of internalized pHrodo-labeled myelin debris were measured and shown. n = 5 picture frames for each group per time point. Data are presented as mean ± SEM. T = 24 h F(2, 12) = 118.84, ***Pcontrol vs NGF < 0.001, ***PNGF vs NGF+3-MA < 0.001.
Schematic 1
Schematic 1
Potential molecular mechanism by which NGF regulates myelin clearance and axon regeneration following PNI. Exogenous NGF binds to the p75NTR in SC to activate the AMPK/mTOR signing pathway to enhance autophagy and drive autophagic flux. This dynamic regulation process in SCs promotes engulfing and degradation of myelin fragments, thus shortening the time of myelin remodeling and axon growth for injured peripheral nerve.

Similar articles

Cited by

References

    1. Griffin JW, Hogan MV, Chhabra AB, Deal DN. Peripheral nerve repair and reconstruction. J Bone Joint Surg Am. 2013;95:2144–51. - PubMed
    1. Forbes SJ, Rosenthal N. Preparing the ground for tissue regeneration: from mechanism to therapy. Nat Med. 2014;20:857–69. - PubMed
    1. Zhao Y, Wang Y, Gong J, Yang L, Niu C, Ni X. et al. Chitosan degradation products facilitate peripheral nerve regeneration by improving macrophage-constructed microenvironments. Biomaterials. 2017;134:64–77. - PubMed
    1. Simons M, Misgeld T, Kerschensteiner M. A unified cell biological perspective on axon-myelin injury. J Cell Biol. 2014;206:335–45. - PMC - PubMed
    1. Beirowski B, Adalbert R, Wagner D, Grumme DS, Addicks K, Ribchester RR. et al. The progressive nature of Wallerian degeneration in wild-type and slow Wallerian degeneration (WldS) nerves. BMC Neurosci. 2005;6:1–27. - PMC - PubMed

Publication types

MeSH terms