. 2020 Jan 1;10(4):1833-1848.
doi: 10.7150/thno.39814. eCollection 2020.

UCH-L1-mediated Down-regulation of Estrogen Receptor α Contributes to Insensitivity to Endocrine Therapy for Breast Cancer

Affiliations

UCH-L1-mediated Down-regulation of Estrogen Receptor α Contributes to Insensitivity to Endocrine Therapy for Breast Cancer

Xi-Sha Chen et al. Theranostics. .

Abstract

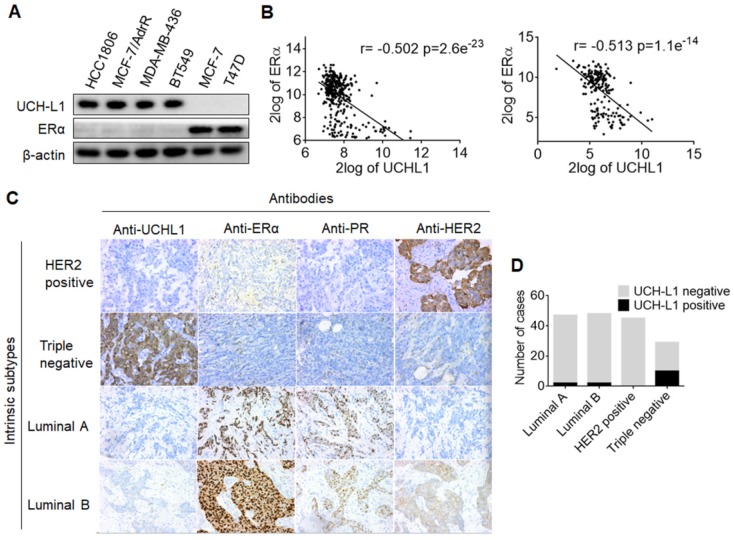
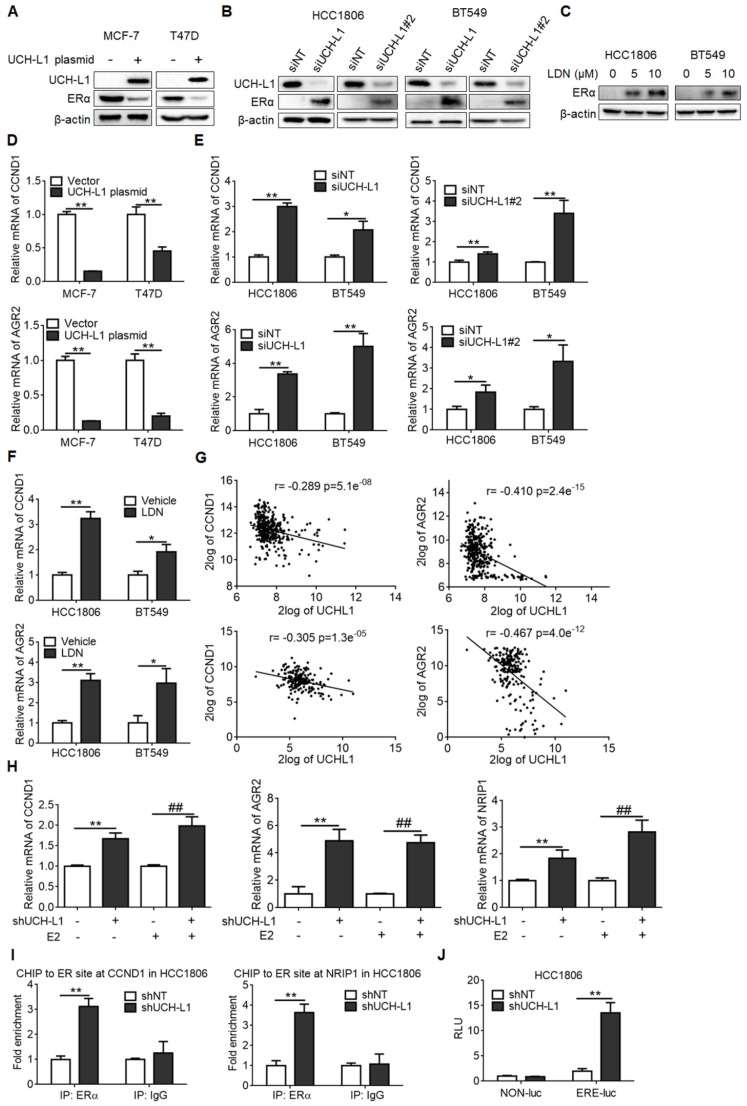
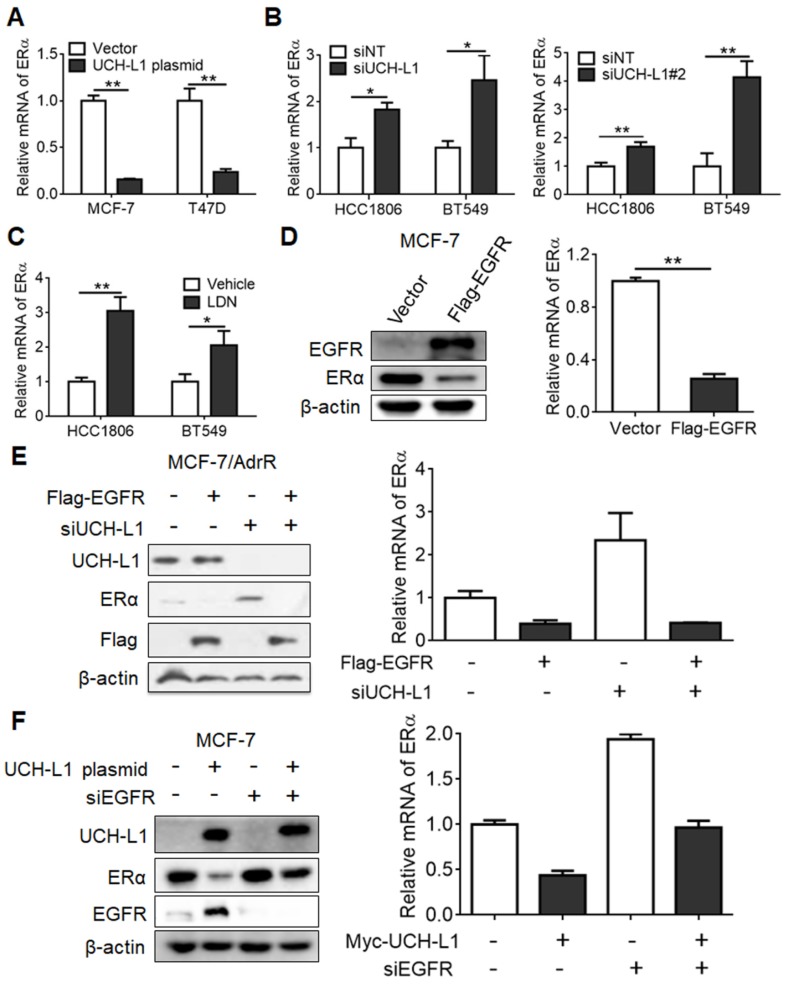
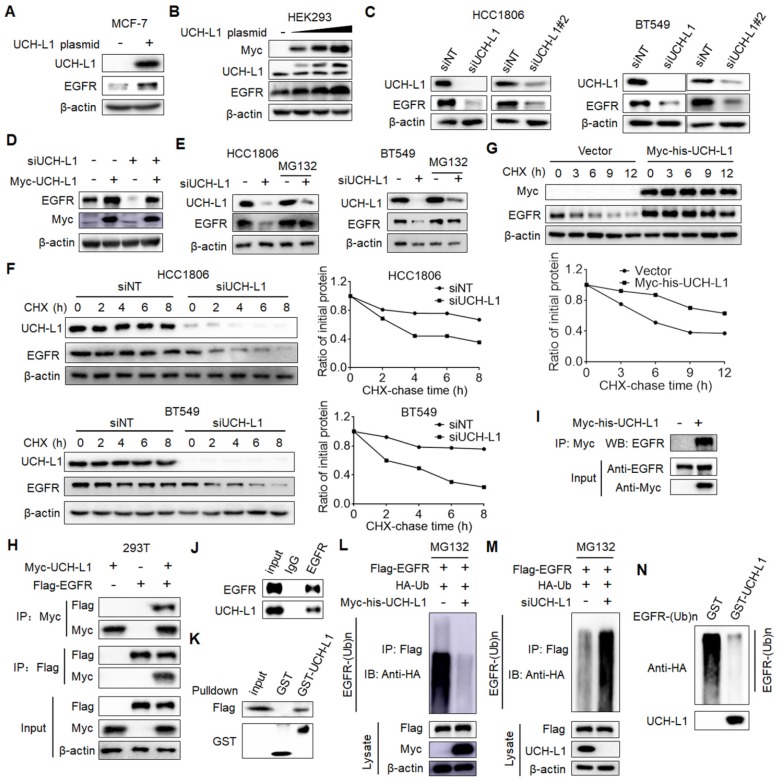
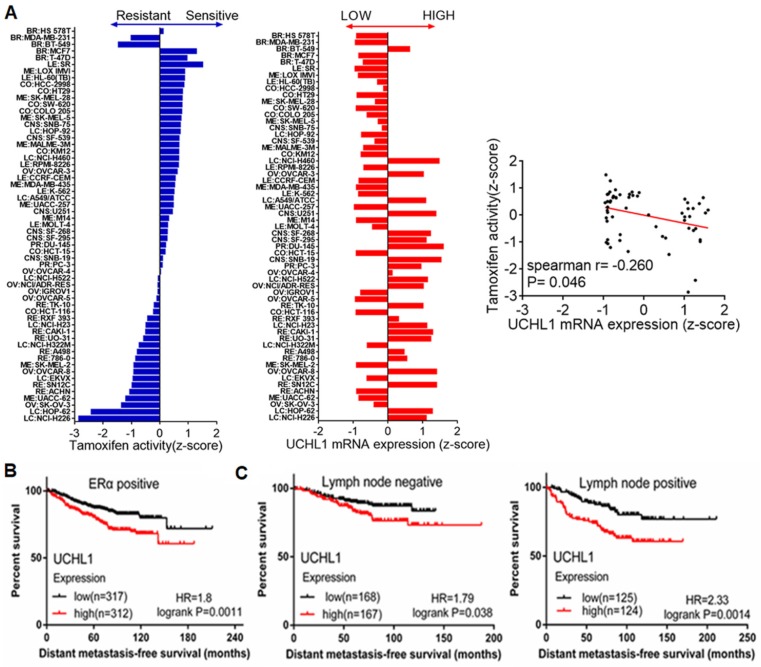
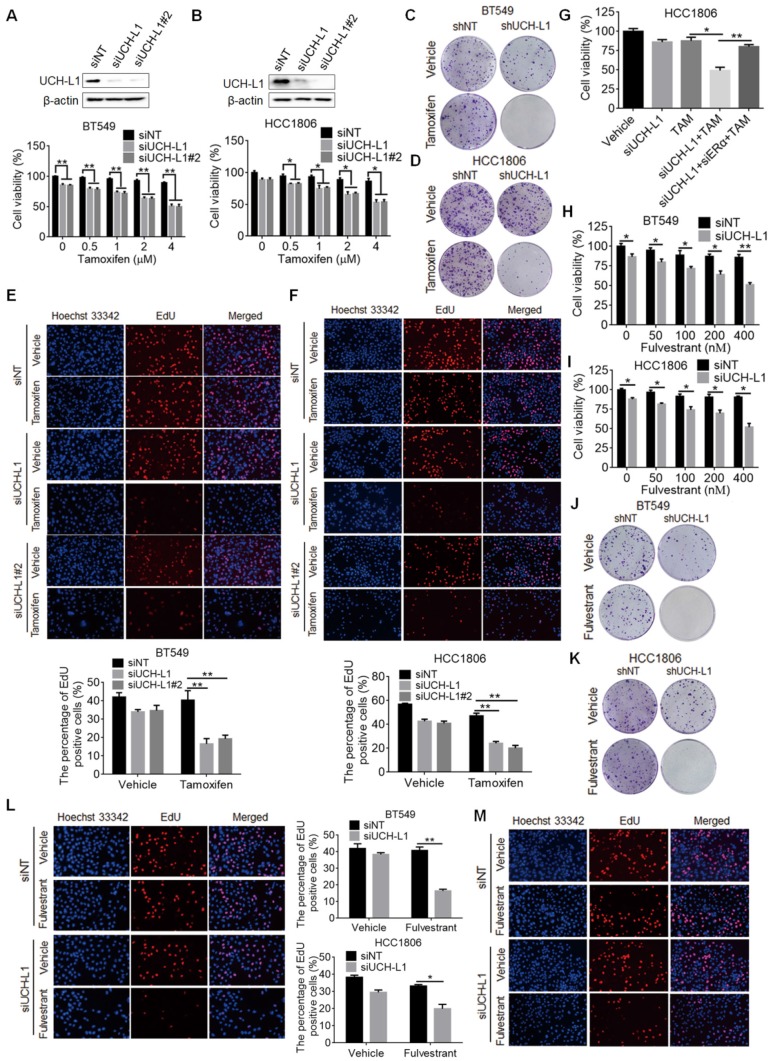
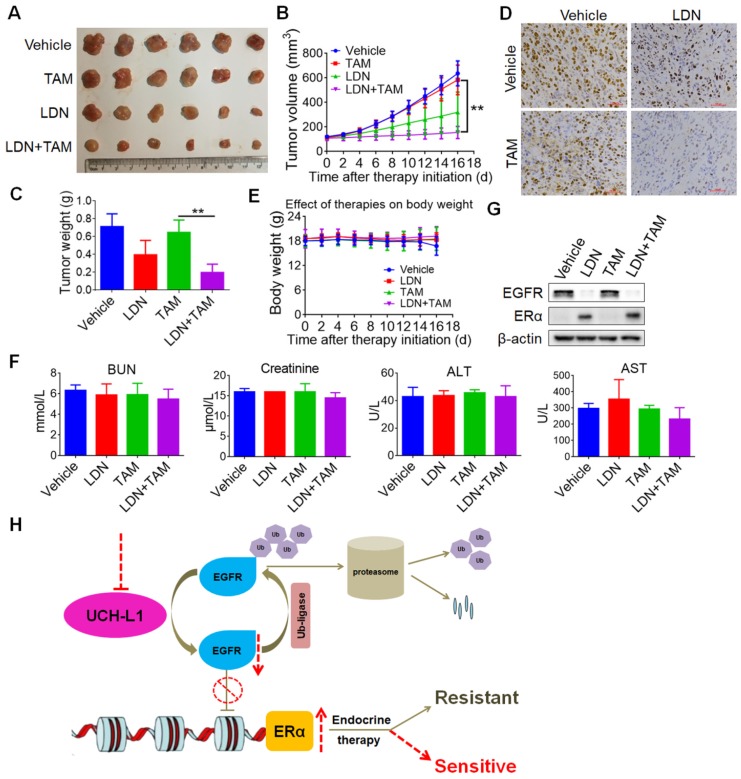
Purpose: To determine the role of UCH-L1 in regulating ERα expression, and to evaluate whether therapeutic targeting of UCH-L1 can enhance the efficacy of anti-estrogen therapy against breast cancer with loss or reduction of ERα. Methods: Expressions of UCH-L1 and ERα were examined in breast cancer cells and patient specimens. The associations between UCH-L1 and ERα, therapeutic response and prognosis in breast cancer patients were analyzed using multiple databases. The molecular pathways by which UCH-L1 regulates ERα were analyzed using immunoblotting, qRT-PCR, immunoprecipitation, ubiquitination, luciferase and ChIP assays. The effects of UCH-L1 inhibition on the efficacy of tamoxifen in ERα (-) breast cancer cells were tested both in vivo and in vitro. Results: UCH-L1 expression was conversely correlated with ERα status in breast cancer, and the negative regulatory effect of UCH-L1 on ERα was mediated by the deubiquitinase-mediated stability of EGFR, which suppresses ERα transcription. High expression of UCH-L1 was associated with poor therapeutic response and prognosis in patients with breast cancer. Up-regulation of ERα caused by UCH-L1 inhibition could significantly enhance the efficacy of tamoxifen and fulvestrant in ERα (-) breast cancer both in vivo and in vitro. Conclusions: Our results reveal an important role of UCH-L1 in modulating ERα status and demonstrate the involvement of UCH-L1-EGFR signaling pathway, suggesting that UCH-L1 may serve as a novel adjuvant target for treatment of hormone therapy-insensitive breast cancers. Targeting UCH-L1 to sensitize ER negative breast cancer to anti-estrogen therapy might represent a new therapeutic strategy that warrants further exploration.

Keywords: EGFR; ER-negative breast cancer; Endocrine therapy; Estrogen receptor α; Ubiquitin carboxyl terminal hydrolase-L1.


Conflict of interest statement

Competing Interests: The authors have declared that no competing interest exists.

Figures

Figure 1
Figure 1
The converse correlation between UCH-L1 and ERα. (A) The expressions of UCH-L1 and ERα in ERα (-) and ERα (+) breast cancer cells were measured by western blot. β-actin was used as a loading control. (B) Correlation between UCHL1 and ERα mRNA levels in GSE30682 (left) and GSE7390 (right) breast cancer samples. (C) A total of 169 clinical human breast carcinoma cases were subjected to immunohistochemical analyses with UCH-L1 antibody. The UCH-L1 expressions in representative tumor tissues including luminal A, luminal B, triple negative, and HER2 overexpression. (D) Immunohistochemical analyses of UCH-L1 expression in patients specimens.
Figure 2
Figure 2
UCH-L1 negatively regulates ERα in breast cancer cells. (A) MCF-7 or T47D cells were transfected with a control plasmid or a myc-his-UCH-L1 plasmid for 48h. (B and C) HCC1806 or BT549 cells were transfected with a non-targeting siRNA or UCH-L1 siRNAs for 72h (B), or were treated with UCH-L1 inhibitor LDN with the indicated concentrations for 24h (C). The expressions of UCH-L1 and ERα were measured by western blot. β-actin was used as a loading control. (D) MCF-7 or T47D cells were transfected with a control plasmid or a myc-his-UCH-L1 plasmid for 48h. (E and F) HCC1806 or BT549 cells were transfected with a non-targeting siRNA or UCH-L1 siRNAs for 72h (E), or were treated with 10 μM LDN for 24h (F). The mRNA levels of CCND1 and AGR2 were analyzed by real-time PCR (Mean ± s.d., n=3 biologically independent experiments. ∗, p <0.05; ∗∗, p <0.01). (G) Correlation between UCHL1 and AGR2, CCND1 mRNA levels in GSE30682 (upper) and GSE7390 (bottom) breast cancer samples. (H) The mRNA levels of ER-target genes in control or UCH-L1 knockdown HCC1806 cells following treatment with vehicle or 10nM E2 for 24 hours, were analyzed by real-time PCR (Mean ± s.d., n=3. ∗∗, p <0.01; ##, p <0.01 compared with E2). (I) ChIP-qPCR analysis. Fold enrichment of ERα at the CCND1/NRIP1 promoter regions in the presence of 10nM E2 for 24 hours (Mean ± s.d. of triplicate measurements. ∗∗, p <0.01). (J) ERE-luciferase assay in the control or UCH-L1 knockdown HCC1806 cells in the presence of 10nM E2 for 24 hours (Mean ± s.d., n=3. ∗∗, p <0.01).
Figure 3
Figure 3
UCH-L1 regulates the transcription of ERα gene via EGFR pathway. (A) MCF-7 or T47D cells were transfected with a control plasmid or a myc-his-UCH-L1 plasmid. (B and C) HCC1806 or BT549 cells were transfected with a non-targeting siRNA or UCH-L1 siRNAs for 72h (B), or were treated with 10 μM LDN for 24h (C). The ERα mRNA level was analyzed by real-time PCR. (D) MCF-7 cells were transfected with a control plasmid or a Flag-EGFR plasmid. The mRNA level of ERα was measured by real-time PCR. The expressions of EGFR and ERα were measured by western blot. β-actin was used as a loading control. Results shown are Mean ± s.d., n=3. ∗, p <0.05; ∗∗, p <0.01. (E) MCF-7/AdrR cells were transfected with a non-targeting siRNA or an UCH-L1 siRNA, followed by transfection with a Flag-EGFR expression plasmid. (F) MCF-7 cells overexpressing UCH-L1 were transfected with a non-targeting siRNA or an EGFR siRNA. The mRNA level of ERα was measured by real-time PCR. The expressions of UCH-L1, ERα and EGFR were measured by western blot. β-actin was used as a loading control.
Figure 4
Figure 4
UCH-L1 deubiquitinates and stabilizes EGFR. (A) MCF-7 cells were transfected with a control plasmid or a myc-his-UCH-L1 plasmid. The expressions of UCH-L1 and EGFR were measured by western blot. β-actin was used as a loading control. (B) Increasing amounts (0μg, 0.5μg, 1.5μg, 3μg) of UCH-L1 plasmid were transfected into HEK293 cells, and the expression of EGFR was measured by western blot. (C) HCC1806 or BT549 cells were transfected with a non-targeting siRNA or UCH-L1 siRNAs. The expressions of UCH-L1 and EGFR were measured by western blot. β-actin was used as a loading control. (D) MCF-7/AdrR cells were transfected with a non-targeting siRNA or an UCH-L1 siRNA, followed by transfection with a siRNA-resistant myc-his-UCH-L1 expression plasmid. The expressions of EGFR and Myc were measured by western blot. β-actin was used as a loading control. (E) HCC1806 or BT549 cells were transfected with a non-targeting siRNA or an UCH-L1 siRNA, followed by treatment with 20μM MG132 for 4h. The expressions of UCH-L1 and EGFR were measured by western blot. β-actin was used as a loading control. (F and G) HCC1806 or BT549 cells were transfected with a non-targeting siRNA or an UCH-L1 siRNA, and then subjected to cycloheximide (10μg/ml) chase at the indicated time (F). HEK293T cells were transfected with a control plasmid or a myc-his-UCH-L1 plasmid, and then subjected to cycloheximide (10μg/ml) chase at the indicated time (G). The expression of EGFR was measured by western blot. β-actin was used as a loading control. (H) HEK293T cells were transfected with Flag-EGFR and myc-his-UCH-L1 plasmids, and then subjected to immunoprecipitation with anti-Flag or anti-Myc antibodies. The lysates and immunoprecipitates were then blotted. (I) MCF-7/AdrR cells transfected with myc-his-UCH-L1 plasmid were subjected immunoprecipitation with anti-Myc antibodies. The lysates and immunoprecipitates were analyzed. (J) Endogenous UCH-L1 and EGFR proteins interact with one another in MCF-7/AdrR cells. Endogenous EGFR proteins were immunoprecipitated with the anti-EGFR antibody. Endogenous UCH-L1 was detected by WB. (K) HEK293T cells transfected with Flag-EGFR were lysed and lysates were incubated with GST or GST-UCH-L1-GSH-Sepharose. Proteins retained on Sepharose were blotted with the indicated antibodies. (L and M) HEK293T cells transfected with the indicated constructs were treated with MG132 (20μM) for 8 hours before harvest. EGFR was immunoprecipitated with anti-Flag antibodies and immunoblotted with anti-HA antibodies. (N) Ubiquitinated EGFR was purified from MG132-treated HEK293T cells and then incubated with purified GST or GST-UCH-L1 in vitro, and then blotted with anti-HA antibodies.
Figure 5
Figure 5
High UCH-L1 expression is correlated with poor therapeutic outcome and prognosis in breast cancer. (A) Evaluation of the influence of UCHL1 expression in drug activity of tamoxifen. Left: Tamoxifen drug activity in the NCI-60 cell lines. The bar graphic shows the Z-score for sensitive (0 to +3) and resistant cell lines (0 to -3). Middle: Expression of UCHL1 across the NCI-60 cell lines. The y-axis shows name of cell line and x-axis shows the expression of UCHL1. Right: The expression of UCHL1 in the 59 cancer cell lines was inversely correlated with the sensitivity to tamoxifen (spearman r=-0.260 p=0.046). (B and C) Determination of prognostic value of UCHL1 mRNA expression in ERα positive BC patients (DMFS in Kaplan-Meier plotter). All the patients were received TAM as their only endocrine therapy, (B) Kaplan-Meir survival curves for the patients with ERα positive breast cancer, (C) Kaplan-Meier survival curves for the patients with ER-positive and Lymph node positive or negative status.
Figure 6
Figure 6
Inhibition of UCH-L1 increases tamoxifen and fulvestrant sensitivity in ERα (-) cancer cells in vitro. (A and B) BT549 or HCC1806 cells were transfected with a non-targeting siRNA or UCH-L1 siRNAs, followed by treatment with tamoxifen for 72h. Cell viability was measured using CCK-8 assay (Mean ± s.d., n=3 biologically independent experiments. ∗, p <0.05; ∗∗, p <0.01). (C, D) Colony formation of BT549 or HCC1806 cells stably expressing an UCH-L1-targeted shRNA or a control shRNA with 4μM tamoxifen treatment. (E and F) BT549 or HCC1806 cells were transfected with a non-targeting siRNA or UCH-L1 siRNAs, followed by treatment with 4μM tamoxifen for 72h. Cells proliferation capacity was detected by EdU. Magnification, ×200. (G) HCC1806 cells with UCH-L1 knockdown were transfected with an ERα siRNA, followed by treatment with 4μM tamoxifen for 72h. Cell viability was measured using CCK-8 assay. (H, I) BT549 or HCC1806 cells were transfected with a non-targeting siRNA or an UCH-L1 siRNA, followed by treatment with fulvestrant for 72h. Cellular viability was measured using CCK-8 assay. (J, K) Colony formation of BT549 or HCC1806 cells stably expressing an UCH-L1-targeted shRNA or a control shRNA and treated with 400nM fulvestrant. (L, M) BT549 (L) or HCC1806 (M) cells were transfected with a non-targeting siRNA or an UCH-L1 siRNA, followed by treatment with 400nM fulvestrant for 72h. Cells proliferation was determined by EdU assay. Magnification, ×200. Results shown are Mean ± s.d., n=3. ∗, p <0.05; ∗∗, p <0.01.
Figure 7
Figure 7
Inhibition of UCH-L1 increases tamoxifen sensitivity in ERα (-) cancer in vivo. 5-week-old female nude mice were inoculated s.c. with HCC1806 triple negative breast cancer cells. The tumor-bearing mice then received indicated treatment. The tumor sizes were measured on the days as indicated. (A) Subcutaneous tumors were excised and photopraphs were taken at the termination of the experiment. (B) Tumor sizes were measured on the days as indicated. Data represents the mean ± SD of tumor sizes of each group (n = 6). ∗∗, P <0.01. (C) Tumor weights were measured at the end of the experiments. Data represents the mean ± SD of tumor weights of each group (n = 6). ∗∗, P <0.01. (D) Immunohistochemistry staining for Ki67 in the tumor specimens from the mice. (E) The effect of treatment on mice body weight. (F) Mice liver and kidney functions were measured at the end of the experiments. BUN, blood urea nitrogen; ALT, alanine aminotransferase; AST, aspartate aminotransferase. (G) Western blot for EGFR and ERα protein expressions in the xenograft specimens from mice. (H) A proposed model for regulation of ERα by UCH-L1. The EGFR protein was maintained dynamic homeostasis by ubiquitin E3 ligases and deubiquitinases orchestrating precisely, while high expression of UCH-L1 broke this balance by de-polyubiquitination, leading to overexpression of EGFR, thereby down-regulating ERα gene transcription. Targeting UCH-L1 could facilitate proteasomal-mediated EGFR degradation, leading to ERα re-expression and re-sensitization to endocrine therapies.

Similar articles

Cited by

References

    1. Bray F, Ferlay J, Soerjomataram I, Global cancer statistics 2018: GLOBOCAN estimates of incidence and mortality worldwide for 36 cancers in 185 countries. CA Cancer J Clin; 2018. - PubMed
    1. Sherr CJ. Cancer cell cycles. Science. 1996;274:1672–7. - PubMed
    1. Wang G, Gormley M, Qiao J. et al. Cyclin D1-mediated microRNA expression signature predicts breast cancer outcome. Theranostics. 2018;8:2251–63. - PMC - PubMed
    1. Dahlman-Wright K, Cavailles V, Fuqua SA. et al. International Union of Pharmacology. LXIV. Estrogen receptors. Pharmacol Rev. 2006;58:773–81. - PubMed
    1. Gronemeyer H, Gustafsson JA, Laudet V. Principles for modulation of the nuclear receptor superfamily. Nat Rev Drug Discov. 2004;3:950–64. - PubMed

Publication types