

Monitoring innate immune cell dynamics in the glioma microenvironment by magnetic resonance imaging and multiphoton microscopy (MR-MPM)
- PMID: 32042342
- PMCID: PMC6993231
- DOI: 10.7150/thno.38659
Monitoring innate immune cell dynamics in the glioma microenvironment by magnetic resonance imaging and multiphoton microscopy (MR-MPM)
Abstract
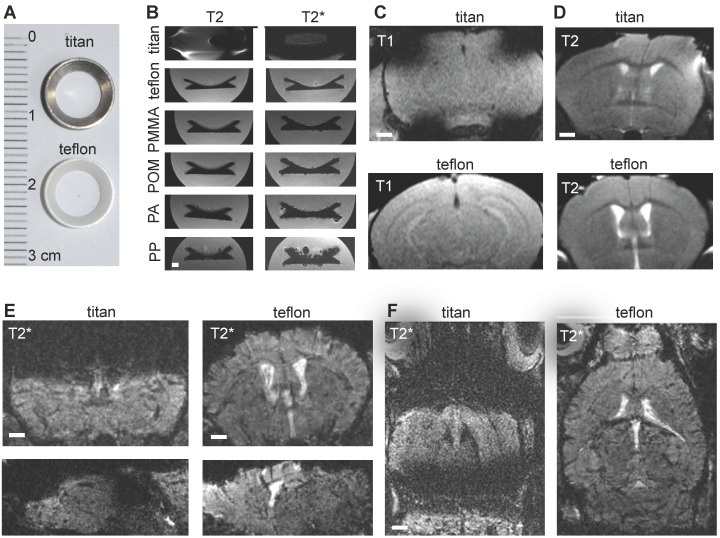
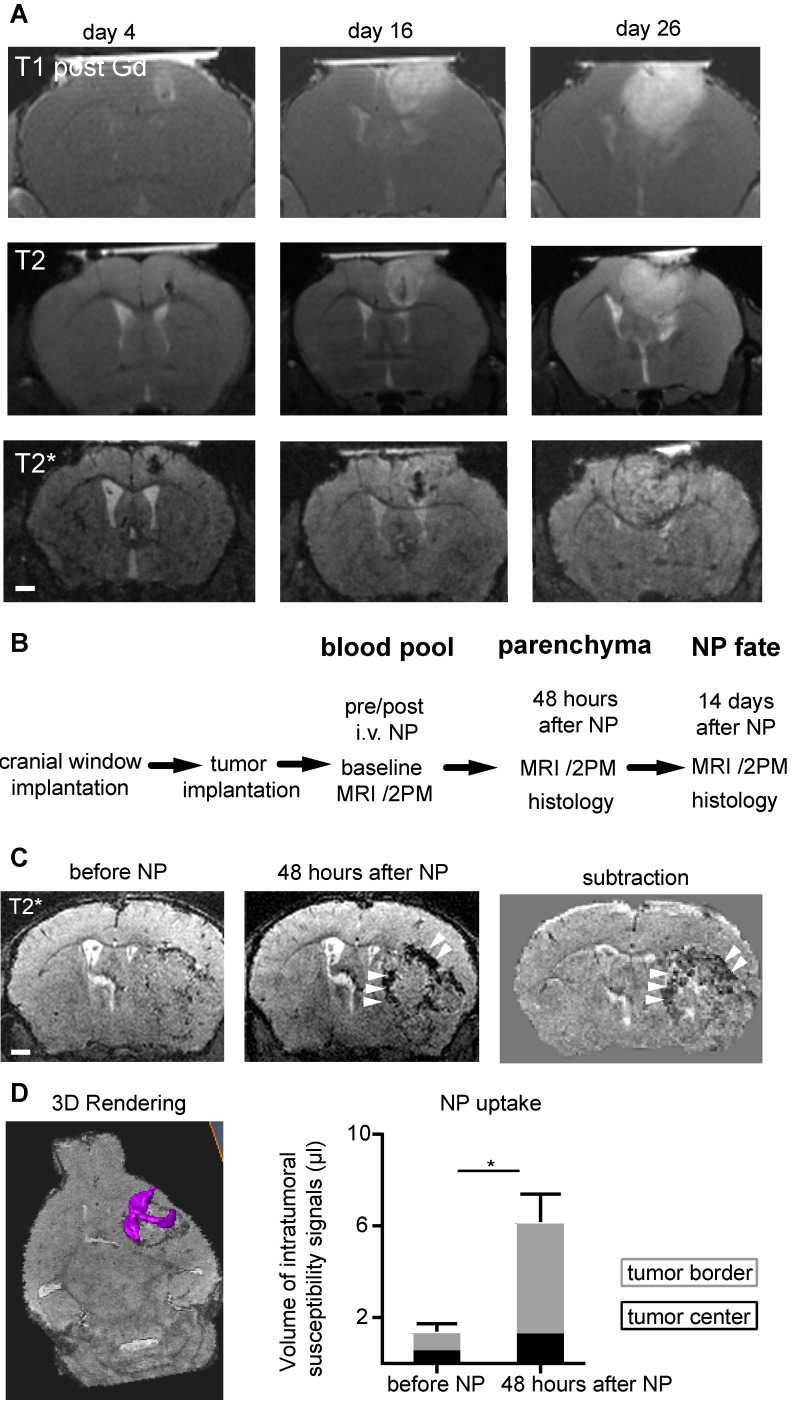
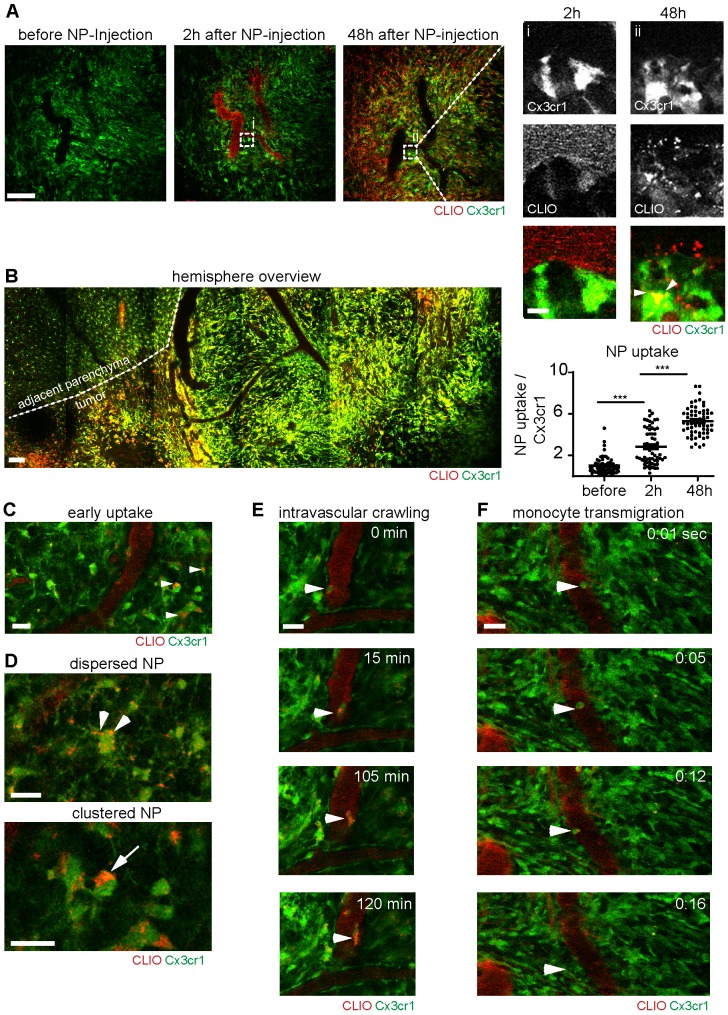
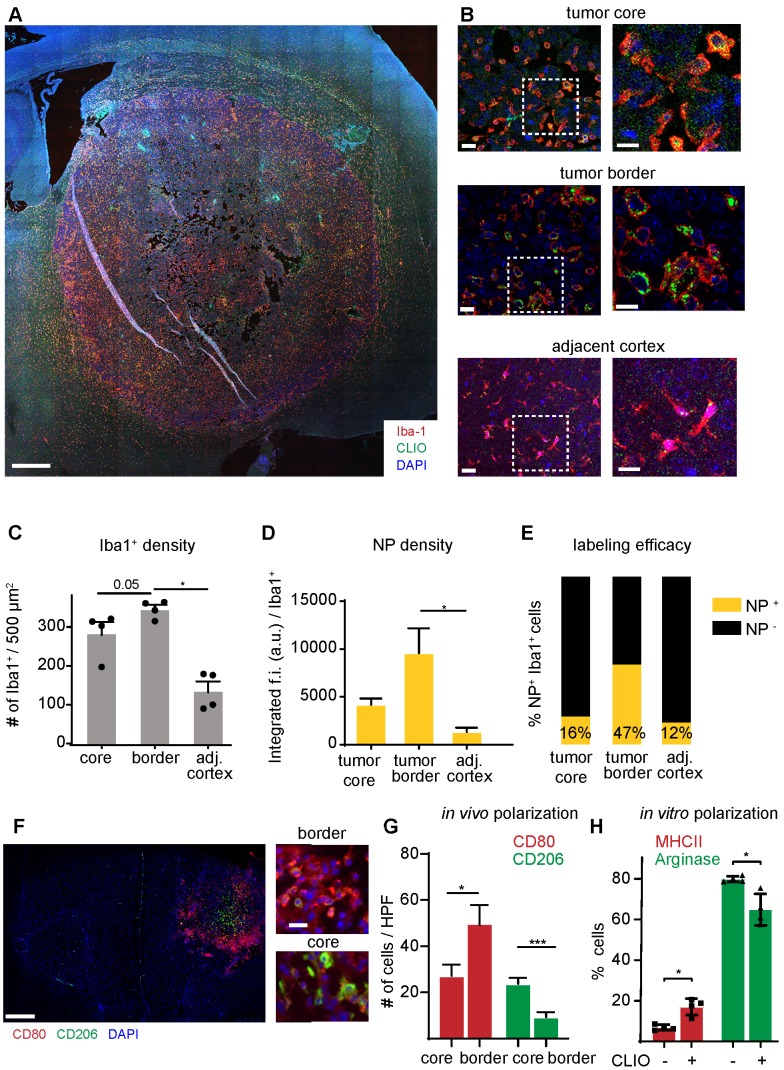
Rationale: Glioblastoma is the most frequent, primary brain tumor that is characterized by a highly immunosuppressive tumor microenvironment (TME). The TME plays a key role for tumor biology and the effectiveness of immunotherapies. Composition of the TME correlates with overall survival and governs therapy response. Non invasive assessment of the TME has been notoriously difficult. Methods: We have designed an in vivo imaging approach to non invasively visualize innate immune cell dynamics in the TME in a mouse glioma model by correlated MRI and multiphoton microscopy (MR-MPM) using a bimodal, fluorescently labeled iron oxide nanoparticle (NP). The introduction of Teflon cranial windows instead of conventional Titanium rings dramatically reduced susceptibility artifacts on MRI and allowed longitudinal MR-MPM imaging for innate immune cell tracking in the same animal. Results: We visualized tumor associated macrophage and microglia (TAM) dynamics in the TME and dissect the single steps of NP uptake by blood-born monocytes that give rise to tumor-associated macrophages. Next to peripheral NP-loading, we identified a second route of direct nanoparticle uptake via the disrupted blood-brain barrier to directly label tissue resident TAMs. Conclusion: Our approach allows innate immune cell tracking by MRI and multiphoton microscopy in the same animal to longitudinally investigate innate immune cell dynamics in the TME.
Keywords: MRI; immunotherapy.; iron oxide nanoparticles; multiphoton microscopy; tumor microenvironment; tumor-associated macrophages.
© The author(s).
Conflict of interest statement
Competing Interests: The authors have declared that no competing interest exists.
Figures
Similar articles
-
A subtype specific probe for targeted magnetic resonance imaging of M2 tumor-associated macrophages in brain tumors.Acta Biomater. 2025 Mar 1;194:336-351. doi: 10.1016/j.actbio.2025.01.003. Epub 2025 Jan 11. Acta Biomater. 2025. PMID: 39805525
-
In vivo nanoparticle-based T cell imaging can predict therapy response towards adoptive T cell therapy in experimental glioma.Theranostics. 2023 Sep 25;13(15):5170-5182. doi: 10.7150/thno.87248. eCollection 2023. Theranostics. 2023. PMID: 37908732 Free PMC article.
-
When Immune Cells Turn Bad-Tumor-Associated Microglia/Macrophages in Glioma.Int J Mol Sci. 2018 Feb 1;19(2):436. doi: 10.3390/ijms19020436. Int J Mol Sci. 2018. PMID: 29389898 Free PMC article. Review.
-
Blocking NHE1 stimulates glioma tumor immunity by restoring OXPHOS function of myeloid cells.Theranostics. 2021 Jan 1;11(3):1295-1309. doi: 10.7150/thno.50150. eCollection 2021. Theranostics. 2021. PMID: 33391535 Free PMC article.
-
Brain Tumor Microenvironment and Host State: Implications for Immunotherapy.Clin Cancer Res. 2019 Jul 15;25(14):4202-4210. doi: 10.1158/1078-0432.CCR-18-1627. Epub 2019 Feb 25. Clin Cancer Res. 2019. PMID: 30804019 Free PMC article. Review.
Cited by
-
Three-photon microscopy: an emerging technique for deep intravital brain imaging.Nat Rev Neurosci. 2025 Sep;26(9):521-537. doi: 10.1038/s41583-025-00937-y. Epub 2025 Jun 20. Nat Rev Neurosci. 2025. PMID: 40542182 Review.
-
Multifunctional magnetic iron oxide nanoparticles: an advanced platform for cancer theranostics.Theranostics. 2020 May 15;10(14):6278-6309. doi: 10.7150/thno.42564. eCollection 2020. Theranostics. 2020. PMID: 32483453 Free PMC article. Review.
-
Multimodal imaging of the dynamic brain tumor microenvironment during glioblastoma progression and in response to treatment.iScience. 2022 Jun 9;25(7):104570. doi: 10.1016/j.isci.2022.104570. eCollection 2022 Jul 15. iScience. 2022. PMID: 35769877 Free PMC article.
-
3D Whole-Brain Imaging Approaches to Study Brain Tumors.Cancers (Basel). 2021 Apr 15;13(8):1897. doi: 10.3390/cancers13081897. Cancers (Basel). 2021. PMID: 33920839 Free PMC article. Review.
-
T cell-independent eradication of experimental glioma by intravenous TLR7/8-agonist-loaded nanoparticles.Nat Commun. 2023 Feb 11;14(1):771. doi: 10.1038/s41467-023-36321-6. Nat Commun. 2023. PMID: 36774352 Free PMC article.
References
Publication types
MeSH terms
LinkOut - more resources
Full Text Sources
Miscellaneous
