

Spatial heterogeneity of nanomedicine investigated by multiscale imaging of the drug, the nanoparticle and the tumour environment
- PMID: 32042343
- PMCID: PMC6993242
- DOI: 10.7150/thno.38625
Spatial heterogeneity of nanomedicine investigated by multiscale imaging of the drug, the nanoparticle and the tumour environment
Abstract
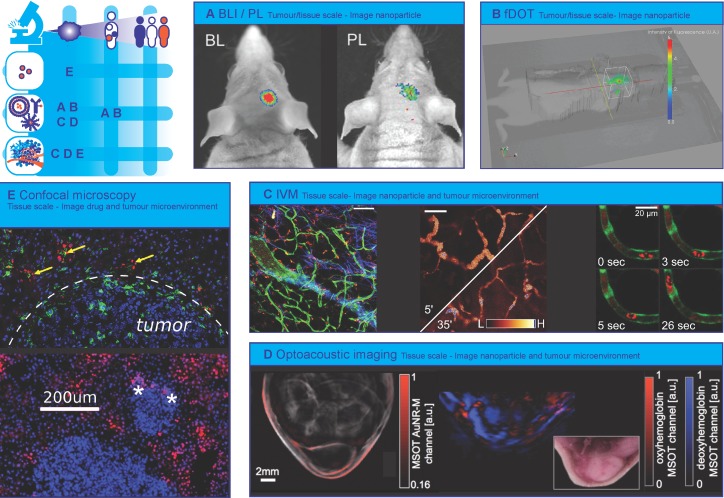
Genetic and phenotypic tumour heterogeneity is an important cause of therapy resistance. Moreover, non-uniform spatial drug distribution in cancer treatment may cause pseudo-resistance, meaning that a treatment is ineffective because the drug does not reach its target at sufficient concentrations. Together with tumour heterogeneity, non-uniform drug distribution causes "therapy heterogeneity": a spatially heterogeneous treatment effect. Spatial heterogeneity in drug distribution occurs on all scales ranging from interpatient differences to intratumour differences on tissue or cellular scale. Nanomedicine aims to improve the balance between efficacy and safety of drugs by targeting drug-loaded nanoparticles specifically to tumours. Spatial heterogeneity in nanoparticle and payload distribution could be an important factor that limits their efficacy in patients. Therefore, imaging spatial nanoparticle distribution and imaging the tumour environment giving rise to this distribution could help understand (lack of) clinical success of nanomedicine. Imaging the nanoparticle, drug and tumour environment can lead to improvements of new nanotherapies, increase understanding of underlying mechanisms of heterogeneous distribution, facilitate patient selection for nanotherapies and help assess the effect of treatments that aim to reduce heterogeneity in nanoparticle distribution. In this review, we discuss three groups of imaging modalities applied in nanomedicine research: non-invasive clinical imaging methods (nuclear imaging, MRI, CT, ultrasound), optical imaging and mass spectrometry imaging. Because each imaging modality provides information at a different scale and has its own strengths and weaknesses, choosing wisely and combining modalities will lead to a wealth of information that will help bring nanomedicine forward.
Keywords: Clinical Imaging; Drug distribution; Mass Spectrometry Imaging.; Nanomedicine; Optical imaging.
© The author(s).
Conflict of interest statement
Competing Interests: The authors have declared that no competing interest exists.
Figures


Similar articles
-
Using imaging modalities to predict nanoparticle distribution and treatment efficacy in solid tumors: The growing role of ultrasound.Wiley Interdiscip Rev Nanomed Nanobiotechnol. 2024 Mar-Apr;16(2):e1957. doi: 10.1002/wnan.1957. Wiley Interdiscip Rev Nanomed Nanobiotechnol. 2024. PMID: 38558290 Free PMC article. Review.
-
Nanoparticles for multimodal in vivo imaging in nanomedicine.Int J Nanomedicine. 2014 Jan 29;9:711-26. doi: 10.2147/IJN.S53717. eCollection 2014. Int J Nanomedicine. 2014. PMID: 24511229 Free PMC article. Review.
-
Multi-modal molecular imaging maps the correlation between tumor microenvironments and nanomedicine distribution.Theranostics. 2022 Feb 14;12(5):2162-2174. doi: 10.7150/thno.68000. eCollection 2022. Theranostics. 2022. PMID: 35265205 Free PMC article.
-
High-resolution 3D visualization of nanomedicine distribution in tumors.Theranostics. 2020 Jan 1;10(2):880-897. doi: 10.7150/thno.37178. eCollection 2020. Theranostics. 2020. PMID: 31903157 Free PMC article.
-
Multimodal Precision Imaging of Pulmonary Nanoparticle Delivery in Mice: Dynamics of Application, Spatial Distribution, and Dosimetry.Small. 2019 Dec;15(49):e1904112. doi: 10.1002/smll.201904112. Epub 2019 Oct 22. Small. 2019. PMID: 31639283
Cited by
-
The Effect of Sulfobetaine Coating in Inhibiting the Interaction between Lyotropic Liquid Crystalline Nanogels and Proteins.Gels. 2022 Oct 14;8(10):653. doi: 10.3390/gels8100653. Gels. 2022. PMID: 36286154 Free PMC article.
-
Sonopermeation With Size-sorted Microbubbles Synergistically Increases Survival and Enhances Tumor Apoptosis With L-DOX by Increasing Vascular Permeability and Perfusion in Neuroblastoma Xenografts.Ultrasound Med Biol. 2025 Feb;51(2):348-357. doi: 10.1016/j.ultrasmedbio.2024.10.014. Epub 2024 Nov 23. Ultrasound Med Biol. 2025. PMID: 39581819
-
The Nanocarrier Landscape─Evaluating Key Drug Delivery Vehicles and Their Capabilities: A Translational Perspective.ACS Appl Mater Interfaces. 2025 Jul 2;17(26):37383-37403. doi: 10.1021/acsami.5c07366. Epub 2025 Jun 17. ACS Appl Mater Interfaces. 2025. PMID: 40526827 Free PMC article. Review.
-
An Updated Review on EPR-Based Solid Tumor Targeting Nanocarriers for Cancer Treatment.Cancers (Basel). 2022 Jun 10;14(12):2868. doi: 10.3390/cancers14122868. Cancers (Basel). 2022. PMID: 35740534 Free PMC article. Review.
-
Linking spatial drug heterogeneity to microbial growth dynamics in theory and experiment.bioRxiv [Preprint]. 2024 Nov 28:2024.11.21.624783. doi: 10.1101/2024.11.21.624783. bioRxiv. 2024. PMID: 39605592 Free PMC article. Preprint.
References
-
- Global Burden of Disease Cancer Collaboration, Fitzmaurice C, Allen C, Barber RM, Barregard L, Bhutta ZA. et al. Global, Regional, and National Cancer Incidence, Mortality, Years of Life Lost, Years Lived With Disability, and Disability-Adjusted Life-years for 32 Cancer Groups, 1990 to 2015: A Systematic Analysis for the Global Burden of Disease Study. JAMA Oncol. 2017;3:524–48. - PMC - PubMed
-
- Cros J, Raffenne J, Couvelard A, Pote N. Tumor Heterogeneity in Pancreatic Adenocarcinoma. Pathobiology. 2018;85:64–71. - PubMed
-
- Marusyk A, Almendro V, Polyak K. Intra-tumour heterogeneity: a looking glass for cancer? Nat Rev Cancer. 2012;12:323–34. - PubMed
Publication types
MeSH terms
Substances
LinkOut - more resources
Full Text Sources
Medical
