

Flow cytometric micronucleus assay and TGx-DDI transcriptomic biomarker analysis of ten genotoxic and non-genotoxic chemicals in human HepaRG™ cells
- PMID: 32042365
- PMCID: PMC7001283
- DOI: 10.1186/s41021-019-0139-2
Flow cytometric micronucleus assay and TGx-DDI transcriptomic biomarker analysis of ten genotoxic and non-genotoxic chemicals in human HepaRG™ cells
Abstract
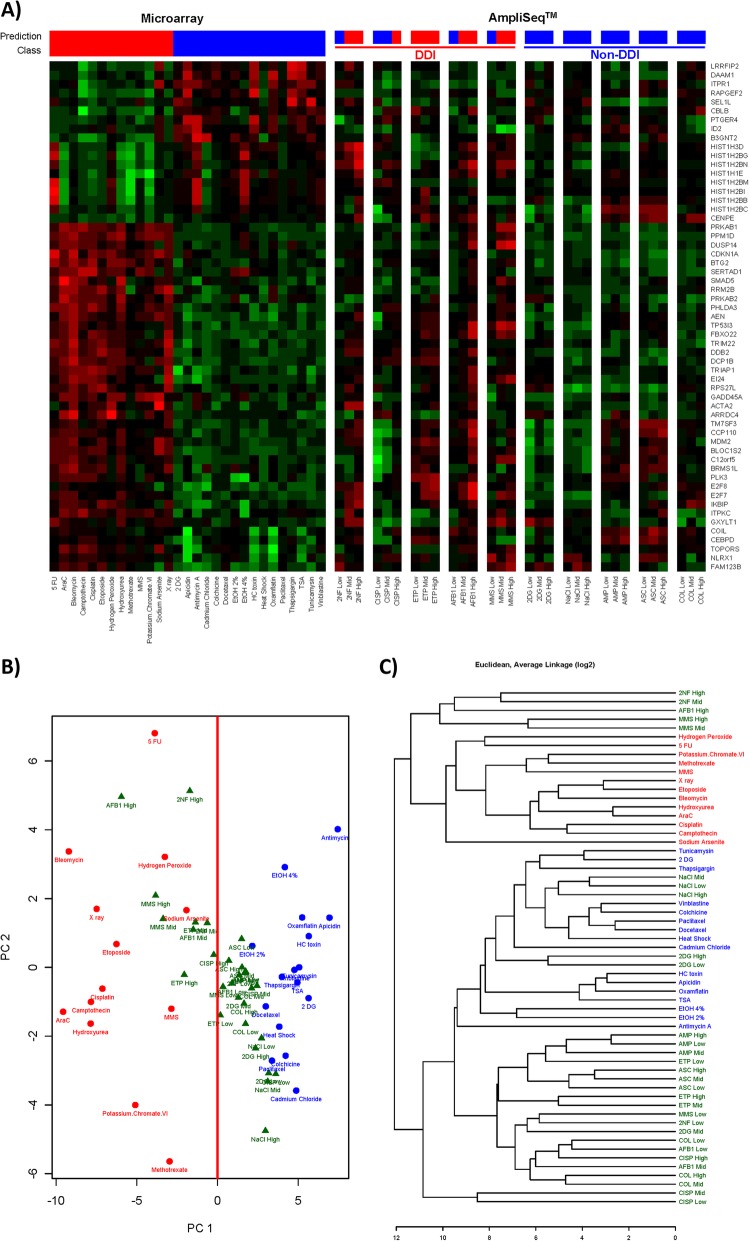
Background: Modern testing paradigms seek to apply human-relevant cell culture models and integrate data from multiple test systems to accurately inform potential hazards and modes of action for chemical toxicology. In genetic toxicology, the use of metabolically competent human hepatocyte cell culture models provides clear advantages over other more commonly used cell lines that require the use of external metabolic activation systems, such as rat liver S9. HepaRG™ cells are metabolically competent cells that express Phase I and II metabolic enzymes and differentiate into mature hepatocyte-like cells, making them ideal for toxicity testing. We assessed the performance of the flow cytometry in vitro micronucleus (MN) test and the TGx-DDI transcriptomic biomarker to detect DNA damage-inducing (DDI) chemicals in human HepaRG™ cells after a 3-day repeat exposure. The biomarker, developed for use in human TK6 cells, is a panel of 64 genes that accurately classifies chemicals as DDI or non-DDI. Herein, the TGx-DDI biomarker was analyzed by Ion AmpliSeq whole transcriptome sequencing to assess its classification accuracy using this more modern gene expression technology as a secondary objective.
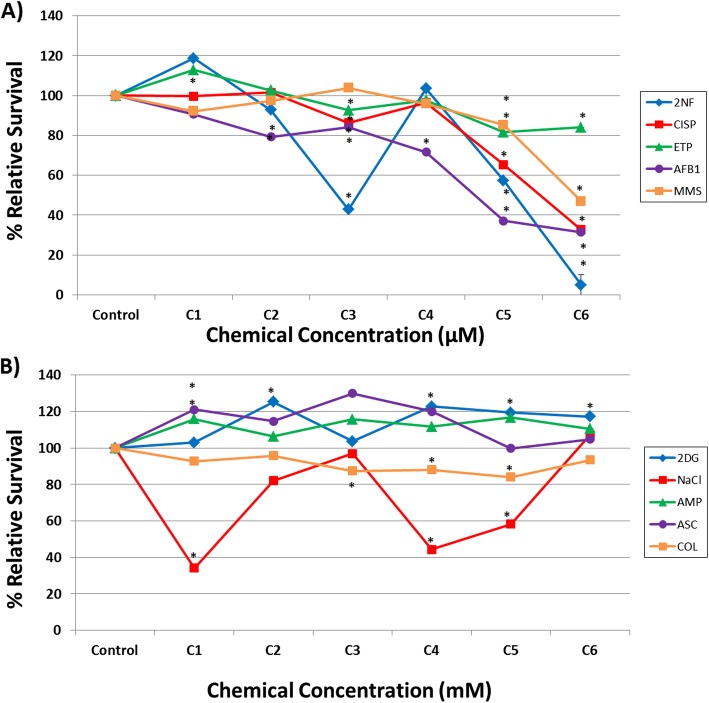
Methods: HepaRG™ cells were exposed to increasing concentrations of 10 test chemicals (six genotoxic chemicals, including one aneugen, and four non-genotoxic chemicals). Cytotoxicity and genotoxicity were measured using the In Vitro MicroFlow® kit, which was run in parallel with the TGx-DDI biomarker.
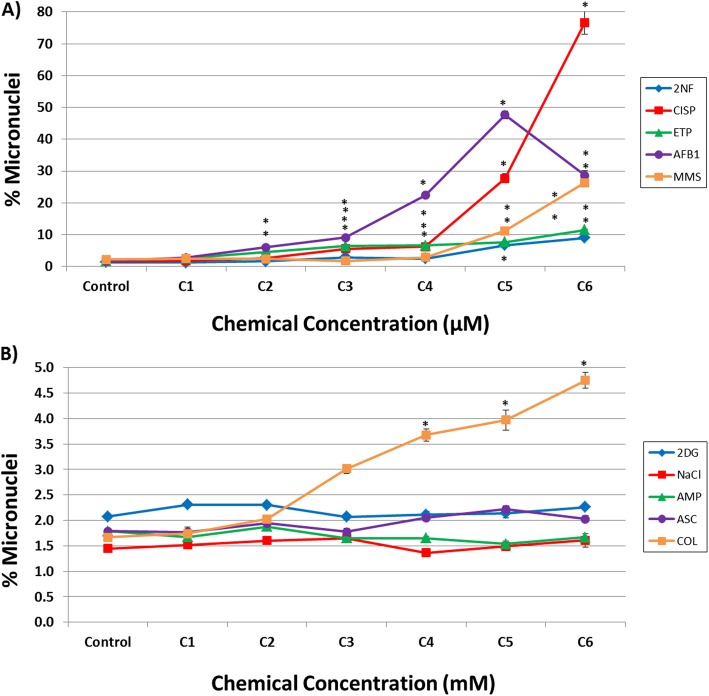
Results: A concentration-related decrease in relative survival and a concomitant increase in MN frequency were observed for genotoxic chemicals in HepaRG™ cells. All five DDI and five non-DDI agents were correctly classified (as genotoxic/non-genotoxic and DDI/non-DDI) by pairing the test methods. The aneugenic agent (colchicine) yielded the expected positive result in the MN test and negative (non-DDI) result by TGx-DDI.
Conclusions: This next generation genotoxicity testing strategy is aligned with the paradigm shift occurring in the field of genetic toxicology. It provides mechanistic insight in a human-relevant cell-model, paired with measurement of a conventional endpoint, to inform the potential for adverse health effects. This work provides support for combining these assays in an integrated test strategy for accurate, higher throughput genetic toxicology testing in this metabolically competent human progenitor cell line.
Keywords: Genetic toxicology; Micronucleus; RNA-Seq; TGx-28.65 genomic biomarker; Toxicogenomics.
© The Author(s) 2020.
Conflict of interest statement
Competing interestsStephen Ferguson disclaims that the statements and opinions expressed in the text are not those of the US government. The authors declare that they have no competing interests.
Figures
Similar articles
-
Application of a new approach methodology (NAM)-based strategy for genotoxicity assessment of data-poor compounds.Front Toxicol. 2023 Jan 23;5:1098432. doi: 10.3389/ftox.2023.1098432. eCollection 2023. Front Toxicol. 2023. PMID: 36756349 Free PMC article.
-
A Modern Genotoxicity Testing Paradigm: Integration of the High-Throughput CometChip® and the TGx-DDI Transcriptomic Biomarker in Human HepaRG™ Cell Cultures.Front Public Health. 2021 Aug 18;9:694834. doi: 10.3389/fpubh.2021.694834. eCollection 2021. Front Public Health. 2021. PMID: 34485225 Free PMC article.
-
Application of the TGx-28.65 transcriptomic biomarker to classify genotoxic and non-genotoxic chemicals in human TK6 cells in the presence of rat liver S9.Environ Mol Mutagen. 2016 May;57(4):243-60. doi: 10.1002/em.22004. Epub 2016 Mar 4. Environ Mol Mutagen. 2016. PMID: 26946220 Free PMC article.
-
TGx-DDI, a Transcriptomic Biomarker for Genotoxicity Hazard Assessment of Pharmaceuticals and Environmental Chemicals.Front Big Data. 2019 Oct 8;2:36. doi: 10.3389/fdata.2019.00036. eCollection 2019. Front Big Data. 2019. PMID: 33693359 Free PMC article. Review.
-
Consensus findings of an International Workshops on Genotoxicity Testing workshop on using transcriptomic biomarkers to predict genotoxicity.Environ Mol Mutagen. 2025 Jan 5. doi: 10.1002/em.22645. Online ahead of print. Environ Mol Mutagen. 2025. PMID: 39757731 Review.
Cited by
-
Unlocking the Power of Transcriptomic Biomarkers in Qualitative and Quantitative Genotoxicity Assessment of Chemicals.Chem Res Toxicol. 2024 Mar 18;37(3):465-475. doi: 10.1021/acs.chemrestox.3c00318. Epub 2024 Feb 26. Chem Res Toxicol. 2024. PMID: 38408751 Free PMC article.
-
Application of a new approach methodology (NAM)-based strategy for genotoxicity assessment of data-poor compounds.Front Toxicol. 2023 Jan 23;5:1098432. doi: 10.3389/ftox.2023.1098432. eCollection 2023. Front Toxicol. 2023. PMID: 36756349 Free PMC article.
-
Evaluating the mutagenicity of N-nitrosodimethylamine in 2D and 3D HepaRG cell cultures using error-corrected next generation sequencing.Arch Toxicol. 2024 Jun;98(6):1919-1935. doi: 10.1007/s00204-024-03731-4. Epub 2024 Apr 7. Arch Toxicol. 2024. PMID: 38584193 Free PMC article.
-
Review of Transcriptomic Biomarkers That Predict In Vitro Genotoxicity in Human Cell Lines.Environ Mol Mutagen. 2025 Mar 4:10.1002/em.70004. doi: 10.1002/em.70004. Online ahead of print. Environ Mol Mutagen. 2025. PMID: 40035370 Review.
-
A Modern Genotoxicity Testing Paradigm: Integration of the High-Throughput CometChip® and the TGx-DDI Transcriptomic Biomarker in Human HepaRG™ Cell Cultures.Front Public Health. 2021 Aug 18;9:694834. doi: 10.3389/fpubh.2021.694834. eCollection 2021. Front Public Health. 2021. PMID: 34485225 Free PMC article.
References
-
- Choudhuri S, Patton GW, Chanderbhan RF, Mattia A, Klaassen CD. From classical toxicology to Tox21: some critical conceptual and technological advances in the molecular understanding of the toxic response beginning from the last quarter of the 20th century. Toxicol Sci. 2018;161(1):5–22. doi: 10.1093/toxsci/kfx186. - DOI - PMC - PubMed
-
- Cote I, Andersen ME, Ankley GT, Barone S, Birnbaum LS, Boekelheide K, et al. The next generation of risk assessment multi-year study-highlights of findings, applications to risk assessment, and future directions. Environ Health Perspect. 2016;124(11):1671–1682. doi: 10.1289/EHP233. - DOI - PMC - PubMed
LinkOut - more resources
Full Text Sources
Molecular Biology Databases
