

A method for comparing perceptual distances and areas with multidimensional scaling
- PMID: 32042601
- PMCID: PMC6997901
- DOI: 10.1016/j.mex.2020.100790
A method for comparing perceptual distances and areas with multidimensional scaling
Abstract
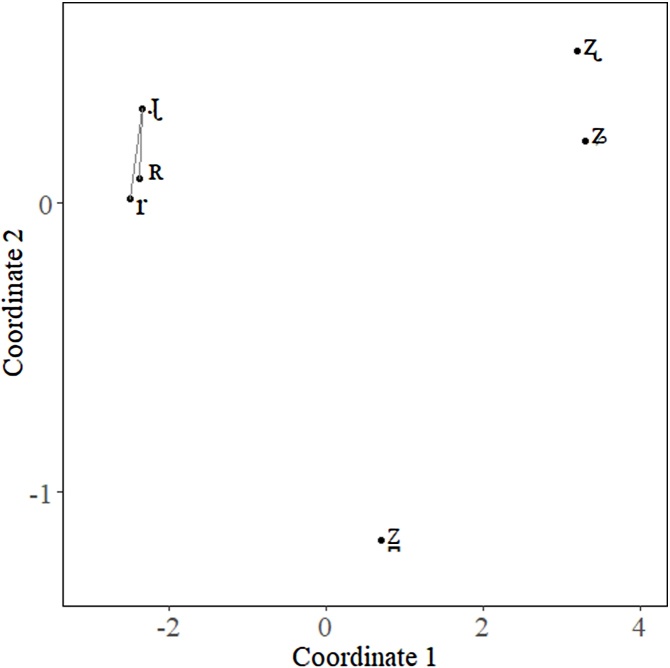
This paper presents a method for adding additional statistical comparisons to multidimensional scaling (MDS). The object of study in our work is perceptual distances between speech sound categories. Typically, MDS solutions do not receive inferential statistical treatment and their visualizations present average results across numerous participants. This is problematic because it ignores inter-participant variation. To account for this variance, we have devised a simple technique for adding statistical power to the traditional MDS solution so that the distances between objects and the areas occupied by groups of objects can be compared more reliably than visual inspection of an MDS plot. We provide a method for comparing distances between two objects and for comparing the area of three or more objects. This method can be paired with varying statistical analysis to suit the researcher's needs. •Adds statistical power to multidimensional scaling.•Compares distances between segments.•Compares dispersion of groups of objects in multidimensional space.
Keywords: Distance and area comparison with multidimensional scaling; Linguistics; Principle Coordinate Analysis; Speech perception.
© 2020 The Author(s).
Figures


References
-
- Gower J.C. Some distance properties of latent root and vector methods used in multivariate analysis. Biometrika. 1966;53:325–328.
-
- Gower J.C., Legendre P. Metric and Euclidean properties of dissimilarity coefficients. J. Classif. 1986;3:5–48.
-
- Cox T.F., Cox M.A.A. Chapman and Hall; 2001. Multidimensional Scaling.
-
- Mead A. Review of the development of multidimensional scaling methods. J. R. Stat. Soc. Ser. D. 1992;41(1):27–39.
-
- Macmillan N., Creelman C. 1991. Detection Theory: A User’s Guide. New York.
LinkOut - more resources
Full Text Sources
Research Materials
Miscellaneous
