. 2019 Dec;7(23):715.
doi: 10.21037/atm.2019.12.27.

Serum amyloid A1 as a biomarker for radiation dose estimation and lethality prediction in irradiated mouse

Affiliations

Serum amyloid A1 as a biomarker for radiation dose estimation and lethality prediction in irradiated mouse

Jinfeng Huang et al. Ann Transl Med. 2019 Dec.

Abstract

Background: Fast and reliable biomarkers are needed to distinguish whether individuals were exposed or not to radiation and assess radiation dose, and to predict the severity of radiation damage in a large-scale radiation accident. Serum amyloid A1 (SAA1) is a protein induced by multiple factors including inflammatory. Therefore, this study aimed at exploring the role of SAA1 in the radiation dose estimation and lethality prediction after radiation.

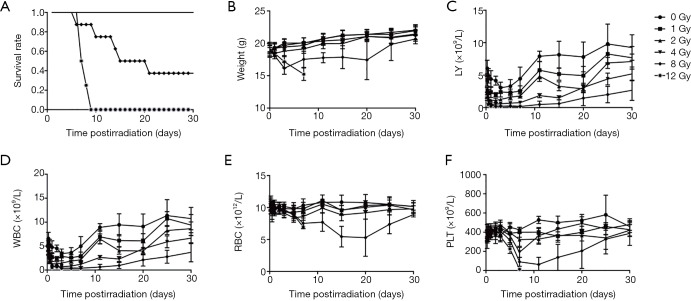
Methods: C57BL/6J female mice were exposed to total body irradiation (TBI) at different doses and time points and amifostine, a drug used to reduce the side effects of radiotherapy, was injected before irradiation. Patients with nasopharyngeal carcinoma subjected to radiotherapy were used as the irradiation model in humans.

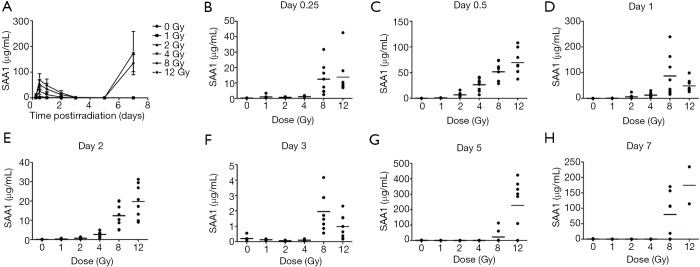
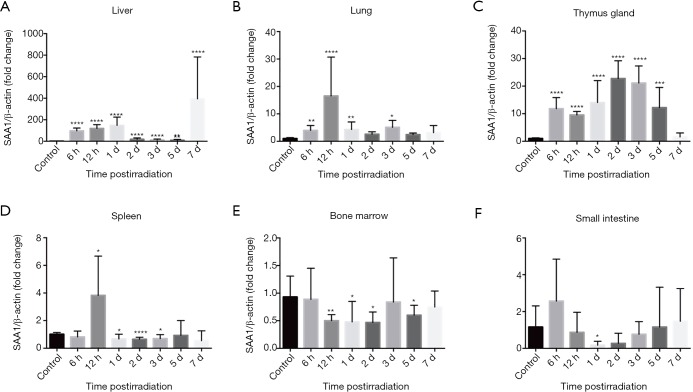
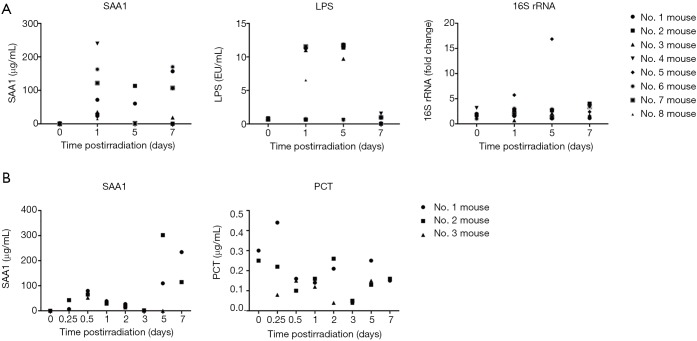
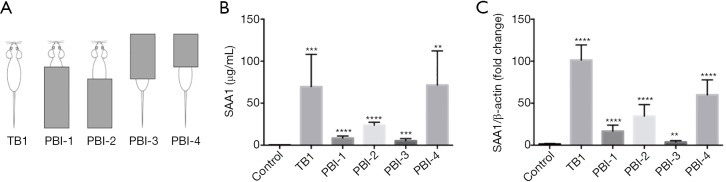
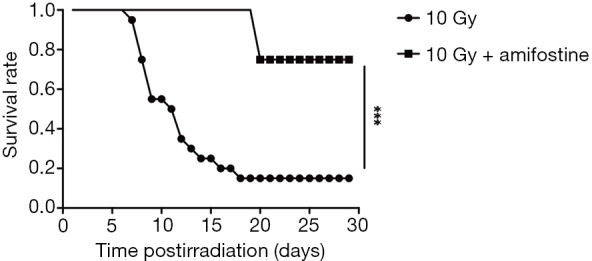
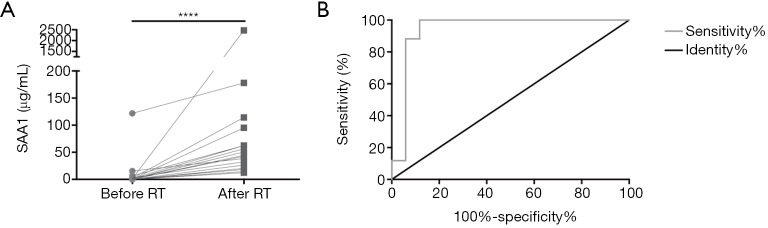
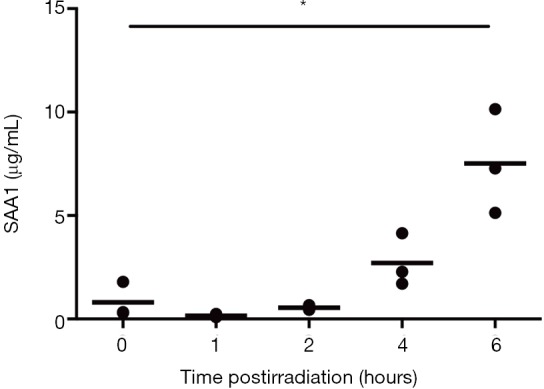
Results: A moderate SAA1 increase was observed at 6 hours in serum samples from irradiated mice at all doses used, with a peak at 12 hours, then decreased to day 3 after exposure. A second SAA1 increase was observed from day 5 to 7, which was associated to subsequent lethality. Treatment with amifostine before irradiation could prevent mice death and inhibit the second SAA1 increase. SAA1 increase after radiation was confirmed in human serum of nasopharyngeal carcinoma patients after radiotherapy.

Conclusions: Serum SAA1 levels could represent a biomarker for radiation dose estimation and its second increase might be a useful lethality indicator after radiation in a mouse model.

Keywords: Serum amyloid A1 (SAA1); biomarker; lethality; radiation.


Conflict of interest statement

Conflicts of Interest: The authors have no conflicts of interest to declare.

Figures

Figure 1
Figure 1
Time and dose response of SAA1 after TBI. (A) SAA1 was measured using ELISA in 0, 1, 2, 4, 8 and 12 Gy irradiated female C57BL/6J mice at 0.125, 0.5, 1, 2, 3, 5 and 7 days post-irradiation. SAA1 dose-dependent change at (B) 0.25, (C) 0.5, (D) 1, (E) 2, (F) 3, (G) 5 and (H) 7 days after exposure to radiation. Each black dot represents one animal. Error bars indicate ± 1 SD for each radiation exposure group. n=8 per group (n=7 at 7 days after 8 Gy, n=2 at 7 days after 12 Gy). SAA1, serum amyloid A1; TBI, total body irradiation.
Figure 2
Figure 2
SAA1 mRNA time-dependent increase after radiation in (A) liver, (B) lung, (C) thymus, (D) spleen, (E) bone marrow and (F) small intestine measured using Quantitative PCR in control and 8 Gy irradiated female C57BL/6J mice at 0.125, 0.5, 1, 2, 3, 5 and 7 days post-irradiation. Error bars indicate ± 1 SD for each radiation exposure group. n=6 to 8 per group. *, P<0.05, *, P<0.01, ***, P<0.001, and ****, P<0.0001 in the irradiated mice compared with the control mice. SAA1, serum amyloid A1.
Figure 3
Figure 3
SAA1 expression and systemic infection parameters in the same mice. (A) SAA1 and LPS in serum and 16S rRNA in the liver of the same animals measured on 31 mice on day 0,1, 5 and 7 (7 mice on day 7, and 8 per group on day 0, 1 and 5) after exposure to 8 Gy TBI. (B) SAA1 and PCT in serum in the same animals was on 23 mice on days 0, 0.125, 0.5, 1, 2, 3, 5 and 7 (2 mice on days 7 and 3 per group on days 0, 0.125, 0.5, 1, 2, 3 and 5) after exposure to 12 Gy TBI. SAA1, serum amyloid A1; TBI, total body irradiation.
Figure 4
Figure 4
PBI patterns and SAA1 response. (A) The liver of C57BL/6J mice was shielded in PBI-1 and PBI-3 and in the corresponding groups PBI-2 and PBI-4 the liver was exposed. (B) SAA1 concentration in serum and (C) mRNA expression in liver of control, total-body irradiation and PBI group at 12 hours after 8 Gy irradiation. Error bars indicate ±1 SD for each radiation exposure group. n=6 per group. **, P<0.01, ***, P<0.001, and ****, P<0.0001 in the irradiated mice compared with the control mice. PBI, partial body irradiation; SAA1, serum amyloid A1.
Figure 5
Figure 5
Kaplan-Meier survival curves of mice. P value determined by log-rank test. Serum SAA1 in mice treated with amifostine before 10 Gy irradiation and in the 10 Gy group on day −4, 1, 3, 5 and 7. n=8 in 10 Gy + Amifostine group, n=20 in 10 Gy group. ***, P<0.001. SAA1, serum amyloid A1.
Figure 6
Figure 6
Effect of radiotherapy on serum SAA1 in nasopharyngeal carcinoma patients. (A) The scatter plot shows SAA1 concentration before radiotherapy and corresponding expression after radiotherapy in 17 patients with nasopharyngeal carcinoma (****, P<0.0001). (B) ROC curve of SAA1 as a biomarker for predicting radiation exposure in patients with nasopharyngeal carcinoma. SAA1, serum amyloid A1.
Figure S1
Figure S1
Radiation time response in mouse SAA1 measured using ELISA in 8 Gy irradiated female C57BL/6J mice at 0, 1, 2, 4, and 6 hours post-irradiation. n=3 per group. *, P<0.05 in the irradiated mice compared with control mice.
Figure S2
Figure S2
The (A) survival rate, (B) weight, (C) lymphocyte count, (D) white blood cell count, (E) red blood cell count, and (F) platelet count in irradiated mice. Error bars indicate ±1 SD in each radiation exposure group. n=8 per group.

Comment in

Similar articles

Cited by

References

    1. Chin FK. Scenario of a dirty bomb in an urban environment and acute management of radiation poisoning and injuries. Singapore Med J 2007;48:950-7. - PubMed
    1. Coeytaux K, Bey E, Christensen D, et al. Reported radiation overexposure accidents worldwide, 1980-2013: a systematic review. PLoS One 2015;10:e0118709. 10.1371/journal.pone.0118709 - DOI - PMC - PubMed
    1. Pernot E, Hall J, Baatout S, et al. Ionizing radiation biomarkers for potential use in epidemiological studies. Mutat Res 2012;751:258-86. 10.1016/j.mrrev.2012.05.003 - DOI - PubMed
    1. Marchetti F, Coleman MA, Jones IM, et al. Candidate protein biodosimeters of human exposure to ionizing radiation. Int J Radiat Biol 2006;82:605-39. 10.1080/09553000600930103 - DOI - PubMed
    1. Goans RE, Holloway EC, Berger ME, et al. Early dose assessment following severe radiation accidents. Health Phys 1997;72:513-8. 10.1097/00004032-199704000-00001 - DOI - PubMed