Identification of genes and pathways related to atherosclerosis comorbidity and depressive behavior via RNA-seq and bioinformation analysis in ApoE-/- mice
- PMID: 32042749
- PMCID: PMC6990041
- DOI: 10.21037/atm.2019.11.118
Identification of genes and pathways related to atherosclerosis comorbidity and depressive behavior via RNA-seq and bioinformation analysis in ApoE-/- mice
Abstract
Background: Depression is an independent risk factor for atherosclerosis (AS), which can increase the risk of death and disability from AS. However, the mechanism of AS comorbidity with depression is complex.
Methods: ApoE-/- and C57BL/6J mice were fed with a high-fat diet (model group, N=12 ♂) and a normal diet (control group, N=12 ♂). During the 15-week experimental period, the following tests were performed: coat color score, body weight, and sucrose preference tests (every 2 weeks); open-field test (1st, 7th, and 15th weeks); and light/dark and tail suspension tests (15th week). Oil Red O and hematoxylin and eosin (HE) stainings were used to assess the area of atherosclerotic status. The levels of triglyceride and total and low-density lipoprotein cholesterol in the serum and secretion of pro-inflammatory cytokines were determined using the enzyme-linked immunosorbent assay. The differentially expressed genes (DEGs) in the hippocampus and prefrontal cortex were screened by RNA-sequencing (RNA-seq) and analyzed using the Gene Ontology (GO) annotation and Kyoto Encyclopedia of Genes and Genomes (KEGG) annotations.
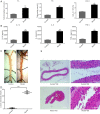
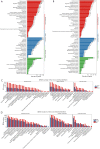
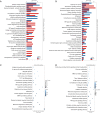
Results: Our findings showed that compared with C57 mice in the control group, ApoE-/- mice in the model group gradually developed depression-like behavioral changes with elevated blood lipid concentrations, serum inflammatory factor levels, and atherosclerotic plaque formation in the thoracic aorta. Consequently, in the RNA-seq and bioinformatics analysis, the high expression of inflammatory chemokine genes was found in the hippocampus and prefrontal cortex area. The regulation of movement, feeding, and reproduction of the gene expression decreased.
Conclusions: These results indicate that when ApoE-/- mice were fed a high-fat diet for 15 weeks, depression-like behavioral changes occurred with the formation of atherosclerotic lesions. The RNA-seq, combined with bioinformatics analysis, showed that this AS comorbidity with depressive behavior was associated with the high expression of inflammation-related genes and pathways in the hippocampus and prefrontal cortex.
Keywords: ApoE; Atherosclerosis (AS); RNA; depression.
2019 Annals of Translational Medicine. All rights reserved.
Conflict of interest statement
Conflicts of Interest: The authors have no conflicts of interest to declare.
Figures


Similar articles
-
Effects of the Lipid Metabolites and the Gut Microbiota in ApoE-/- Mice on Atherosclerosis Co-Depression From the Microbiota-Gut-Brain Axis.Front Mol Biosci. 2022 Apr 26;9:786492. doi: 10.3389/fmolb.2022.786492. eCollection 2022. Front Mol Biosci. 2022. PMID: 35558553 Free PMC article.
-
Chaihu-Shugan-San and absorbed meranzin hydrate induce anti-atherosclerosis and behavioral improvements in high-fat diet ApoE-/- mice via anti-inflammatory and BDNF-TrkB pathway.Biomed Pharmacother. 2019 Jul;115:108893. doi: 10.1016/j.biopha.2019.108893. Epub 2019 Apr 22. Biomed Pharmacother. 2019. PMID: 31022598
-
[Impact of rosuvastatin on atherosclerosis lesions in apolipoprotein E knockout mice].Zhonghua Xin Xue Guan Bing Za Zhi. 2011 Aug;39(8):743-8. Zhonghua Xin Xue Guan Bing Za Zhi. 2011. PMID: 22169423 Chinese.
-
The impact of PSRC1 overexpression on gene and transcript expression profiling in the livers of ApoE-/- mice fed a high-fat diet.Mol Cell Biochem. 2020 Feb;465(1-2):125-139. doi: 10.1007/s11010-019-03673-x. Epub 2019 Dec 14. Mol Cell Biochem. 2020. PMID: 31838625
-
TUG1 knockdown ameliorates atherosclerosis via up-regulating the expression of miR-133a target gene FGF1.Cardiovasc Pathol. 2018 Mar-Apr;33:6-15. doi: 10.1016/j.carpath.2017.11.004. Epub 2017 Dec 2. Cardiovasc Pathol. 2018. PMID: 29268138
Cited by
-
Protective Effects of Cannabidiol on Chemotherapy-Induced Oral Mucositis via the Nrf2/Keap1/ARE Signaling Pathways.Oxid Med Cell Longev. 2022 May 25;2022:4619760. doi: 10.1155/2022/4619760. eCollection 2022. Oxid Med Cell Longev. 2022. PMID: 35669853 Free PMC article.
-
miRNAs from Plasma Extracellular Vesicles Are Signatory Noninvasive Prognostic Biomarkers against Atherosclerosis in LDLr-/-Mice.Oxid Med Cell Longev. 2022 Aug 17;2022:6887192. doi: 10.1155/2022/6887192. eCollection 2022. Oxid Med Cell Longev. 2022. PMID: 36035214 Free PMC article.
-
Effects of the Lipid Metabolites and the Gut Microbiota in ApoE-/- Mice on Atherosclerosis Co-Depression From the Microbiota-Gut-Brain Axis.Front Mol Biosci. 2022 Apr 26;9:786492. doi: 10.3389/fmolb.2022.786492. eCollection 2022. Front Mol Biosci. 2022. PMID: 35558553 Free PMC article.
-
Acupuncture Relieves Stress-Induced Depressive Behavior by Reducing Oxidative Stress and Neuroapoptosis in Rats.Front Behav Neurosci. 2022 Jan 4;15:783056. doi: 10.3389/fnbeh.2021.783056. eCollection 2021. Front Behav Neurosci. 2022. PMID: 35058758 Free PMC article.
-
Multi-tissue transcriptome analysis to identify candidate genes associated with weight regulation in Hanwoo cattle.Front Genet. 2024 Jan 9;14:1304638. doi: 10.3389/fgene.2023.1304638. eCollection 2023. Front Genet. 2024. PMID: 38264212 Free PMC article.
References
-
- WHO. The top 10 causes of death. 2018. Available online: http://www.who.int/news-room/fact-sheets/detail/the-top-10-causes-of-death
LinkOut - more resources
Full Text Sources
Research Materials
Miscellaneous
