

In-depth mining of clinical data: the construction of clinical prediction model with R
- PMID: 32042812
- PMCID: PMC6989986
- DOI: 10.21037/atm.2019.08.63
In-depth mining of clinical data: the construction of clinical prediction model with R
Abstract
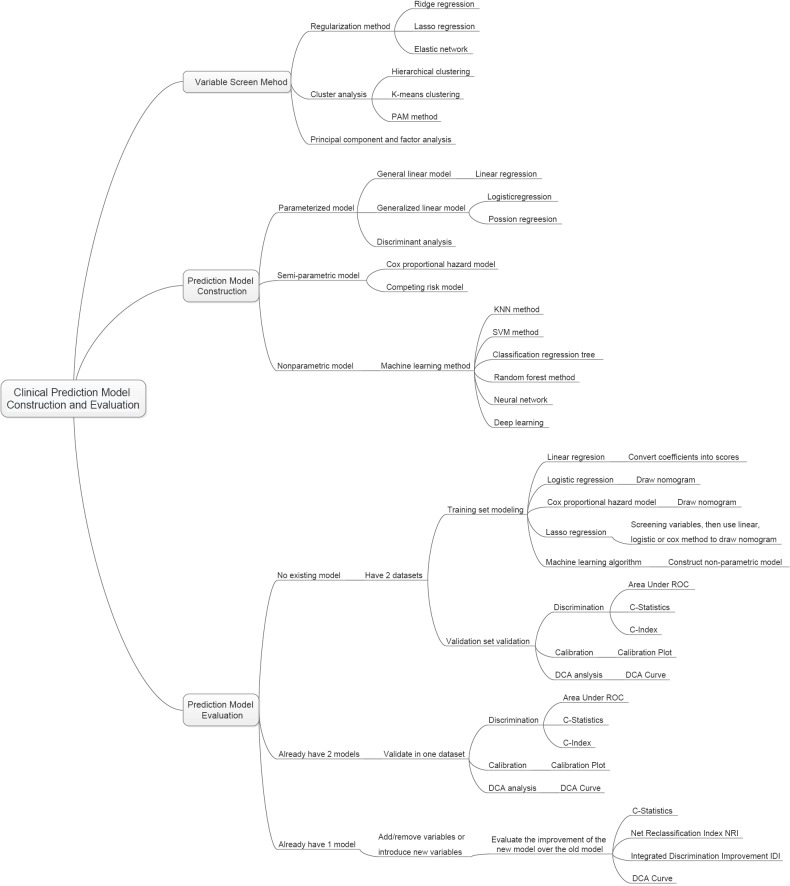
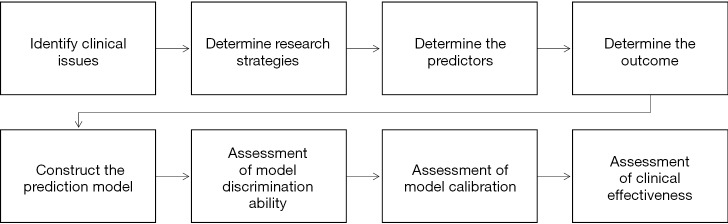
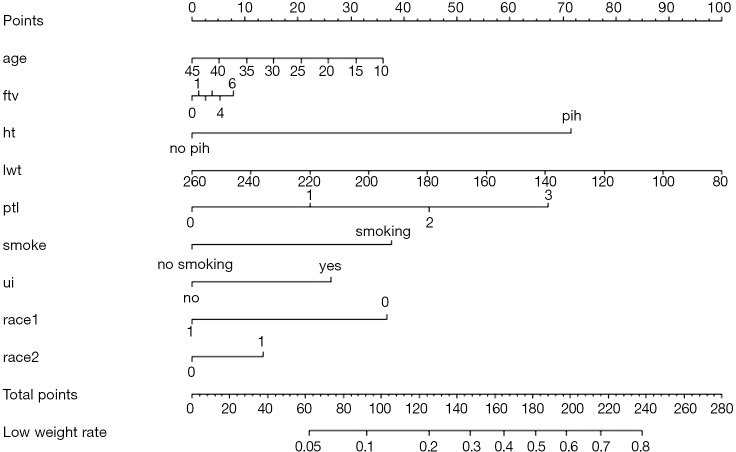
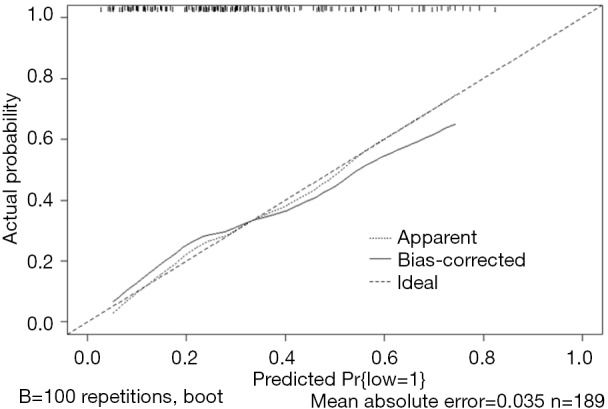
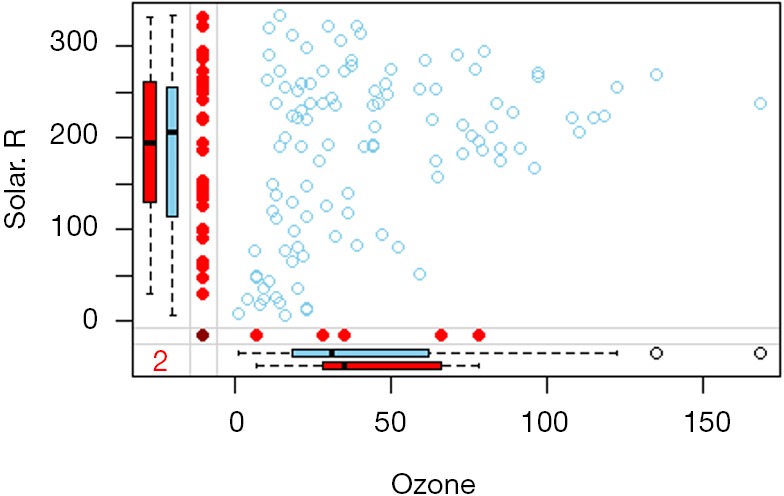
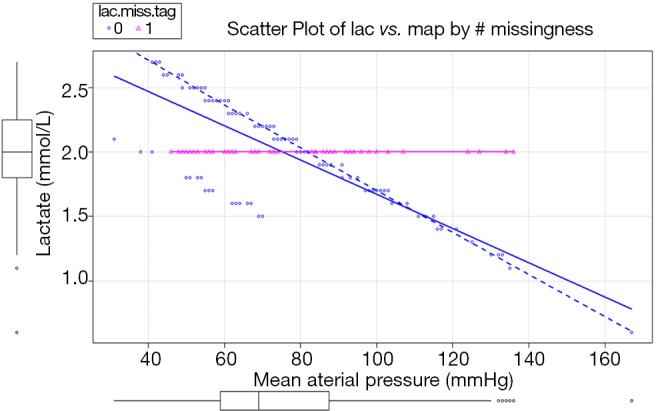
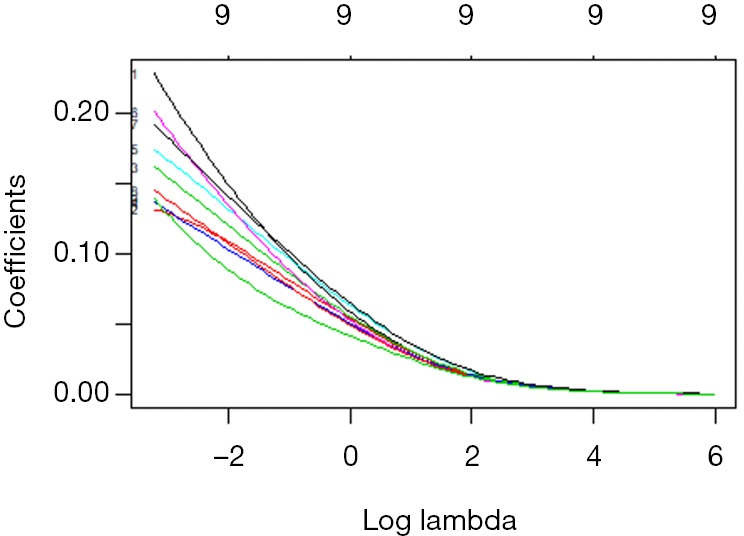
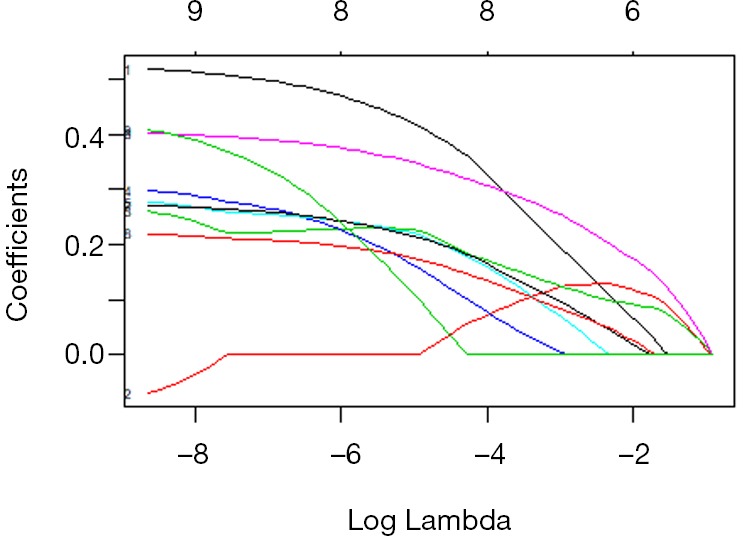
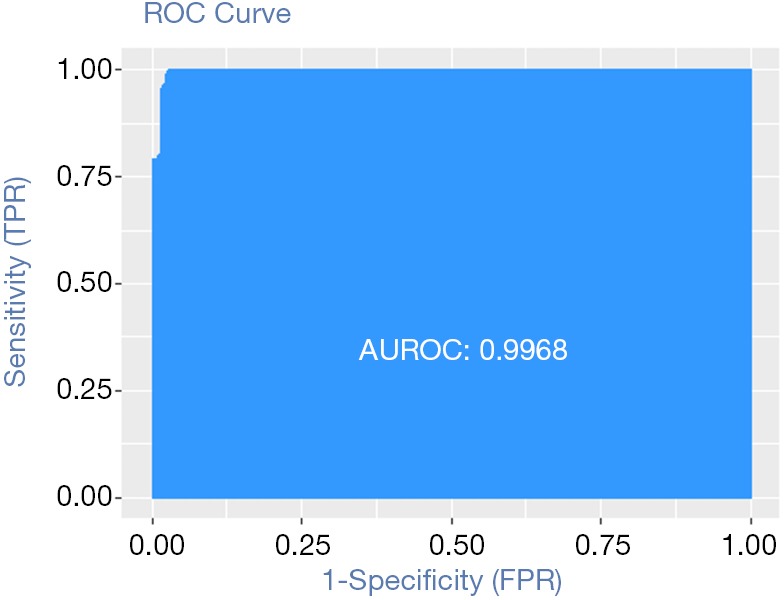
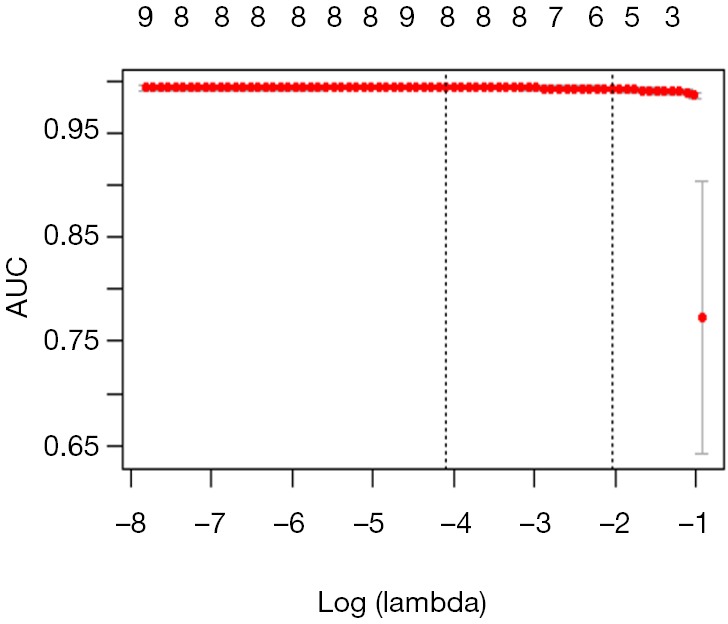
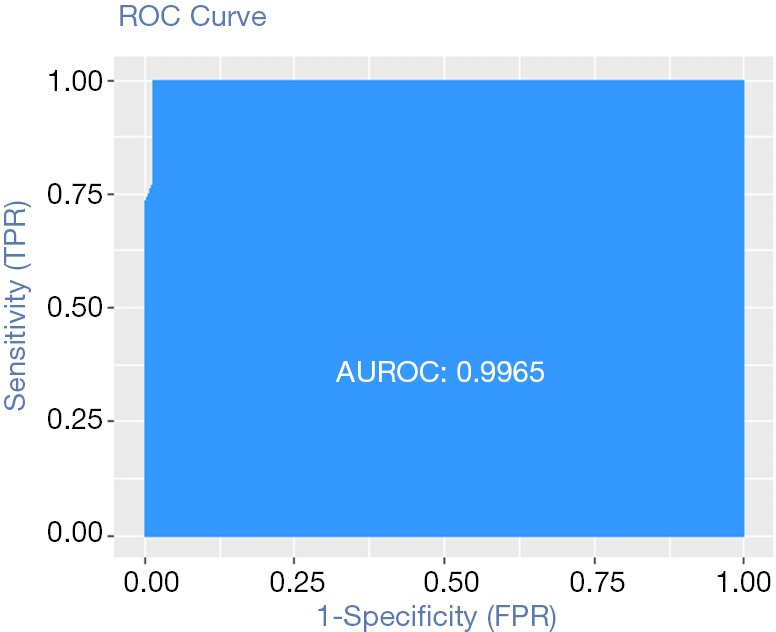
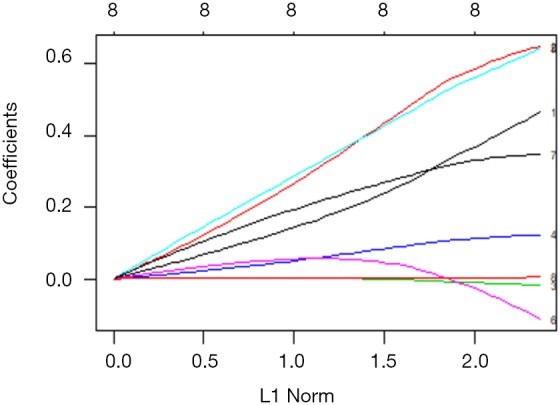
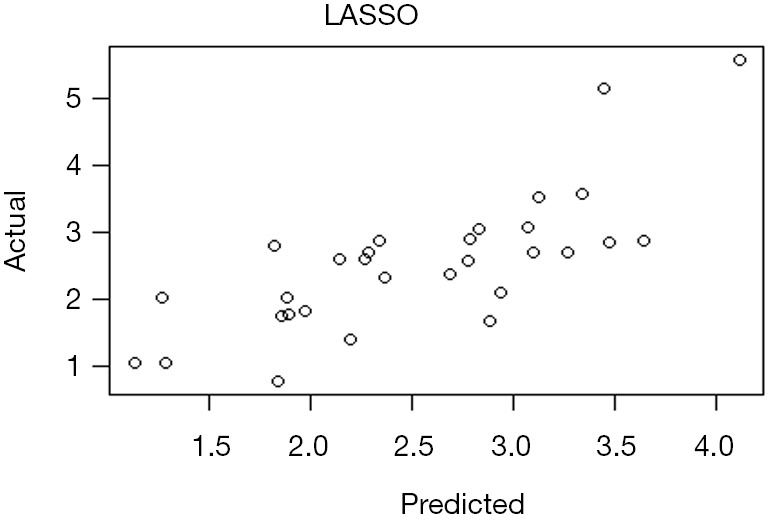
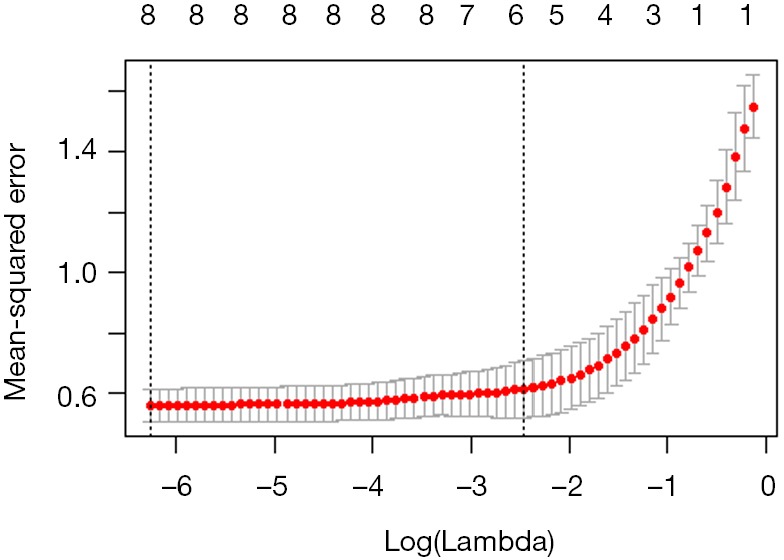
This article is the series of methodology of clinical prediction model construction (total 16 sections of this methodology series). The first section mainly introduces the concept, current application status, construction methods and processes, classification of clinical prediction models, and the necessary conditions for conducting such researches and the problems currently faced. The second episode of these series mainly concentrates on the screening method in multivariate regression analysis. The third section mainly introduces the construction method of prediction models based on Logistic regression and Nomogram drawing. The fourth episode mainly concentrates on Cox proportional hazards regression model and Nomogram drawing. The fifth Section of the series mainly introduces the calculation method of C-Statistics in the logistic regression model. The sixth section mainly introduces two common calculation methods for C-Index in Cox regression based on R. The seventh section focuses on the principle and calculation methods of Net Reclassification Index (NRI) using R. The eighth section focuses on the principle and calculation methods of IDI (Integrated Discrimination Index) using R. The ninth section continues to explore the evaluation method of clinical utility after predictive model construction: Decision Curve Analysis. The tenth section is a supplement to the previous section and mainly introduces the Decision Curve Analysis of survival outcome data. The eleventh section mainly discusses the external validation method of Logistic regression model. The twelfth mainly discusses the in-depth evaluation of Cox regression model based on R, including calculating the concordance index of discrimination (C-index) in the validation data set and drawing the calibration curve. The thirteenth section mainly introduces how to deal with the survival data outcome using competitive risk model with R. The fourteenth section mainly introduces how to draw the nomogram of the competitive risk model with R. The fifteenth section of the series mainly discusses the identification of outliers and the interpolation of missing values. The sixteenth section of the series mainly introduced the advanced variable selection methods in linear model, such as Ridge regression and LASSO regression.
Keywords: Clinical prediction models; R; statistical computing.
2019 Annals of Translational Medicine. All rights reserved.
Conflict of interest statement
Conflicts of Interest: The authors have no conflicts of interest to declare.
Figures


Comment in
-
Predictive analytics in the era of big data: opportunities and challenges.Ann Transl Med. 2020 Feb;8(4):68. doi: 10.21037/atm.2019.10.97. Ann Transl Med. 2020. PMID: 32175361 Free PMC article. No abstract available.
-
Real-life clinical data mining: generating hypotheses for evidence-based medicine.Ann Transl Med. 2020 Feb;8(4):69. doi: 10.21037/atm.2019.10.99. Ann Transl Med. 2020. PMID: 32175362 Free PMC article. No abstract available.
-
Joint forces for making clinical prediction models contribute to science.Ann Transl Med. 2020 Feb;8(4):70. doi: 10.21037/atm.2019.11.10. Ann Transl Med. 2020. PMID: 32175363 Free PMC article. No abstract available.
-
Overview of clinical prediction models.Ann Transl Med. 2020 Feb;8(4):71. doi: 10.21037/atm.2019.11.121. Ann Transl Med. 2020. PMID: 32175364 Free PMC article. No abstract available.
-
Clinical prediction models: evaluation matters.Ann Transl Med. 2020 Feb;8(4):72. doi: 10.21037/atm.2019.11.143. Ann Transl Med. 2020. PMID: 32175365 Free PMC article. No abstract available.
-
Statistical methods and models in the analysis of time to event data.Ann Transl Med. 2020 Feb;8(4):73. doi: 10.21037/atm.2019.12.66. Ann Transl Med. 2020. PMID: 32175366 Free PMC article. No abstract available.
-
Models and prediction, how and what?Ann Transl Med. 2020 Feb;8(4):75. doi: 10.21037/atm.2019.12.133. Ann Transl Med. 2020. PMID: 32175368 Free PMC article. No abstract available.
-
How to use statistical models and methods for clinical prediction.Ann Transl Med. 2020 Feb;8(4):76. doi: 10.21037/atm.2020.01.22. Ann Transl Med. 2020. PMID: 32175369 Free PMC article. No abstract available.
-
The power of clinical data empowered by clinical prediction model: an R tutorial.Ann Transl Med. 2020 Feb;8(4):77. doi: 10.21037/atm.2020.01.114. Ann Transl Med. 2020. PMID: 32175370 Free PMC article. No abstract available.
-
A nomogram with enhanced function facilitated by nomogramEx and nomogramFormula.Ann Transl Med. 2020 Feb;8(4):78. doi: 10.21037/atm.2020.01.71. Ann Transl Med. 2020. PMID: 32175371 Free PMC article. No abstract available.
-
Clinical prediction models in the precision medicine era: old and new algorithms.Ann Transl Med. 2020 Mar;8(6):274. doi: 10.21037/atm.2020.02.63. Ann Transl Med. 2020. PMID: 32355718 Free PMC article. No abstract available.
-
Multinomial and ordinal Logistic regression analyses with multi-categorical variables using R.Ann Transl Med. 2020 Aug;8(16):982. doi: 10.21037/atm-2020-57. Ann Transl Med. 2020. PMID: 32953782 Free PMC article. No abstract available.
References
LinkOut - more resources
Full Text Sources
Other Literature Sources
Medical