

The application of weighted gene co-expression network analysis in identifying key modules and hub genes associated with disease status in Alzheimer's disease
- PMID: 32042816
- PMCID: PMC6989876
- DOI: 10.21037/atm.2019.12.59
The application of weighted gene co-expression network analysis in identifying key modules and hub genes associated with disease status in Alzheimer's disease
Abstract
Background: Alzheimer's disease (AD) is the most common neurodegenerative condition that affects more than 15 million individuals globally. However, a predictive molecular biomarker to distinguish the different stages of AD patients is still lacking.
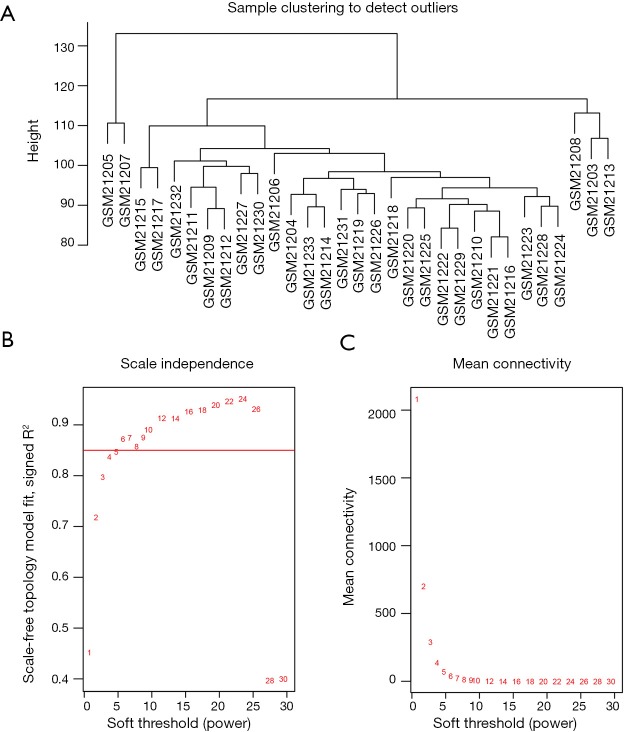
Methods: A weighted gene co-expression network analysis (WGCNA) was employed to systematically identify the co-expressed gene modules and hub genes connected with AD development based on a microarray dataset (GSE1297) from the Gene Expression Omnibus (GEO) database. An independent validation cohort, GSE28146, was utilized to assess the diagnostic efficiency for distinguishing the different stages of AD. Quantitative real-time reverse transcription polymerase chain reaction (qRT-PCR) and western blotting analysis were applied to examine the mRNA and protein level of GRIK1, respectively, in AD mice established with the expression of mutant amyloid precursor protein and wild type mice. The morphology of neurons was investigated using phalloidin staining.
Results: We identified 16 co-expressed genes modules, with the pink module showing significant association with all three disease statuses [neurofibrillary tangle (NFT), BRAAK, and mini-mental state examination (MMSE)]. Enrichment analysis specified that these modules were enriched in phosphatidylinositol 3-kinase (PI3K) signaling and ion transmembrane transport. The validation cohort GSE28146 confirmed that six hub genes in the pink module could distinguish severe and non-severe AD patients [area under the curve (AUC) >0.7]. These hub genes might act as a biomarker and help to differentiate diverse pathological stages for AD patients. Finally, one of the hubs, GRIK1, was validated by an animal AD model. The mRNA and protein level of GRIK1 in the AD hippocampus was increased compared with the control group (NC) hippocampus. Phalloidin staining showed that dendritic length of the GRIK1 pCDNA3.1 group was shorter than that of the NC group.
Conclusions: In summary, we systematically recognized co-expressed gene modules and genes related to AD stages, which gave insight into the fundamental mechanisms of AD progression and revealed some probable targets for the treatment of AD.
Keywords: Alzheimer’s disease (AD); gene modules; pathological stage; weighted gene co-expression network analysis (WGCNA).
2019 Annals of Translational Medicine. All rights reserved.
Conflict of interest statement
Conflict of Interest: The authors have no conflicts of interest to declare.
Figures


Similar articles
-
Application of Weighted Gene Co-Expression Network Analysis to Explore the Key Genes in Alzheimer's Disease.J Alzheimers Dis. 2018;65(4):1353-1364. doi: 10.3233/JAD-180400. J Alzheimers Dis. 2018. PMID: 30124448 Free PMC article.
-
[Identification of potential hub genes of Alzheimer's disease by weighted gene co-expression network analysis].Nan Fang Yi Ke Da Xue Xue Bao. 2021 Dec 20;41(12):1752-1762. doi: 10.12122/j.issn.1673-4254.2021.12.01. Nan Fang Yi Ke Da Xue Xue Bao. 2021. PMID: 35012905 Free PMC article. Chinese.
-
Identification and validation of oxidative stress and immune-related hub genes in Alzheimer's disease through bioinformatics analysis.Sci Rep. 2023 Jan 12;13(1):657. doi: 10.1038/s41598-023-27977-7. Sci Rep. 2023. PMID: 36635346 Free PMC article.
-
A review and analysis of key biomarkers in Alzheimer's disease.Front Neurosci. 2024 Feb 20;18:1358998. doi: 10.3389/fnins.2024.1358998. eCollection 2024. Front Neurosci. 2024. PMID: 38445255 Free PMC article. Review.
-
Sensogenomics of music and Alzheimer's disease: An interdisciplinary view from neuroscience, transcriptomics, and epigenomics.Front Aging Neurosci. 2023 Feb 3;15:1063536. doi: 10.3389/fnagi.2023.1063536. eCollection 2023. Front Aging Neurosci. 2023. PMID: 36819725 Free PMC article.
Cited by
-
Co-expression network analysis of frontal cortex during the progression of Alzheimer's disease.Cereb Cortex. 2022 Nov 9;32(22):5108-5120. doi: 10.1093/cercor/bhac001. Cereb Cortex. 2022. PMID: 35076713 Free PMC article.
-
Differential Transcriptional Programs Reveal Modular Network Rearrangements Associated with Late-Onset Alzheimer's Disease.Int J Mol Sci. 2025 Mar 6;26(5):2361. doi: 10.3390/ijms26052361. Int J Mol Sci. 2025. PMID: 40076979 Free PMC article.
-
Identification of TNFAIP6 as a hub gene associated with the progression of glioblastoma by weighted gene co-expression network analysis.IET Syst Biol. 2022 Sep;16(5):145-156. doi: 10.1049/syb2.12046. Epub 2022 Jun 29. IET Syst Biol. 2022. PMID: 35766985 Free PMC article.
-
Identification of the molecular subgroups in Alzheimer's disease by transcriptomic data.Front Neurol. 2022 Sep 20;13:901179. doi: 10.3389/fneur.2022.901179. eCollection 2022. Front Neurol. 2022. PMID: 36204002 Free PMC article.
-
Establishing a competing endogenous RNA (ceRNA)-immunoregulatory network associated with the progression of Alzheimer's disease.Ann Transl Med. 2022 Jan;10(2):65. doi: 10.21037/atm-21-6762.. Ann Transl Med. 2022. PMID: 35282112 Free PMC article.
References
-
- Albert MS, DeKosky ST, Dickson D, et al. The diagnosis of mild cognitive impairment due to Alzheimer's disease: recommendations from the National Institute on Aging-Alzheimer's Association workgroups on diagnostic guidelines for Alzheimer's disease. Alzheimers Dement 2011;7:270-9. 10.1016/j.jalz.2011.03.008 - DOI - PMC - PubMed
-
- Sperling RA, Aisen PS, Beckett LA, et al. Toward defining the preclinical stages of Alzheimer's disease: recommendations from the National Institute on Aging-Alzheimer's Association workgroups on diagnostic guidelines for Alzheimer's disease. Alzheimers Dement 2011;7:280-92. 10.1016/j.jalz.2011.03.003 - DOI - PMC - PubMed
LinkOut - more resources
Full Text Sources